VISIT STATE HEALTH COMPARE
Blog & News


50-State Infographics Provide an Updated Overview of the Evolving Opioid Crisis
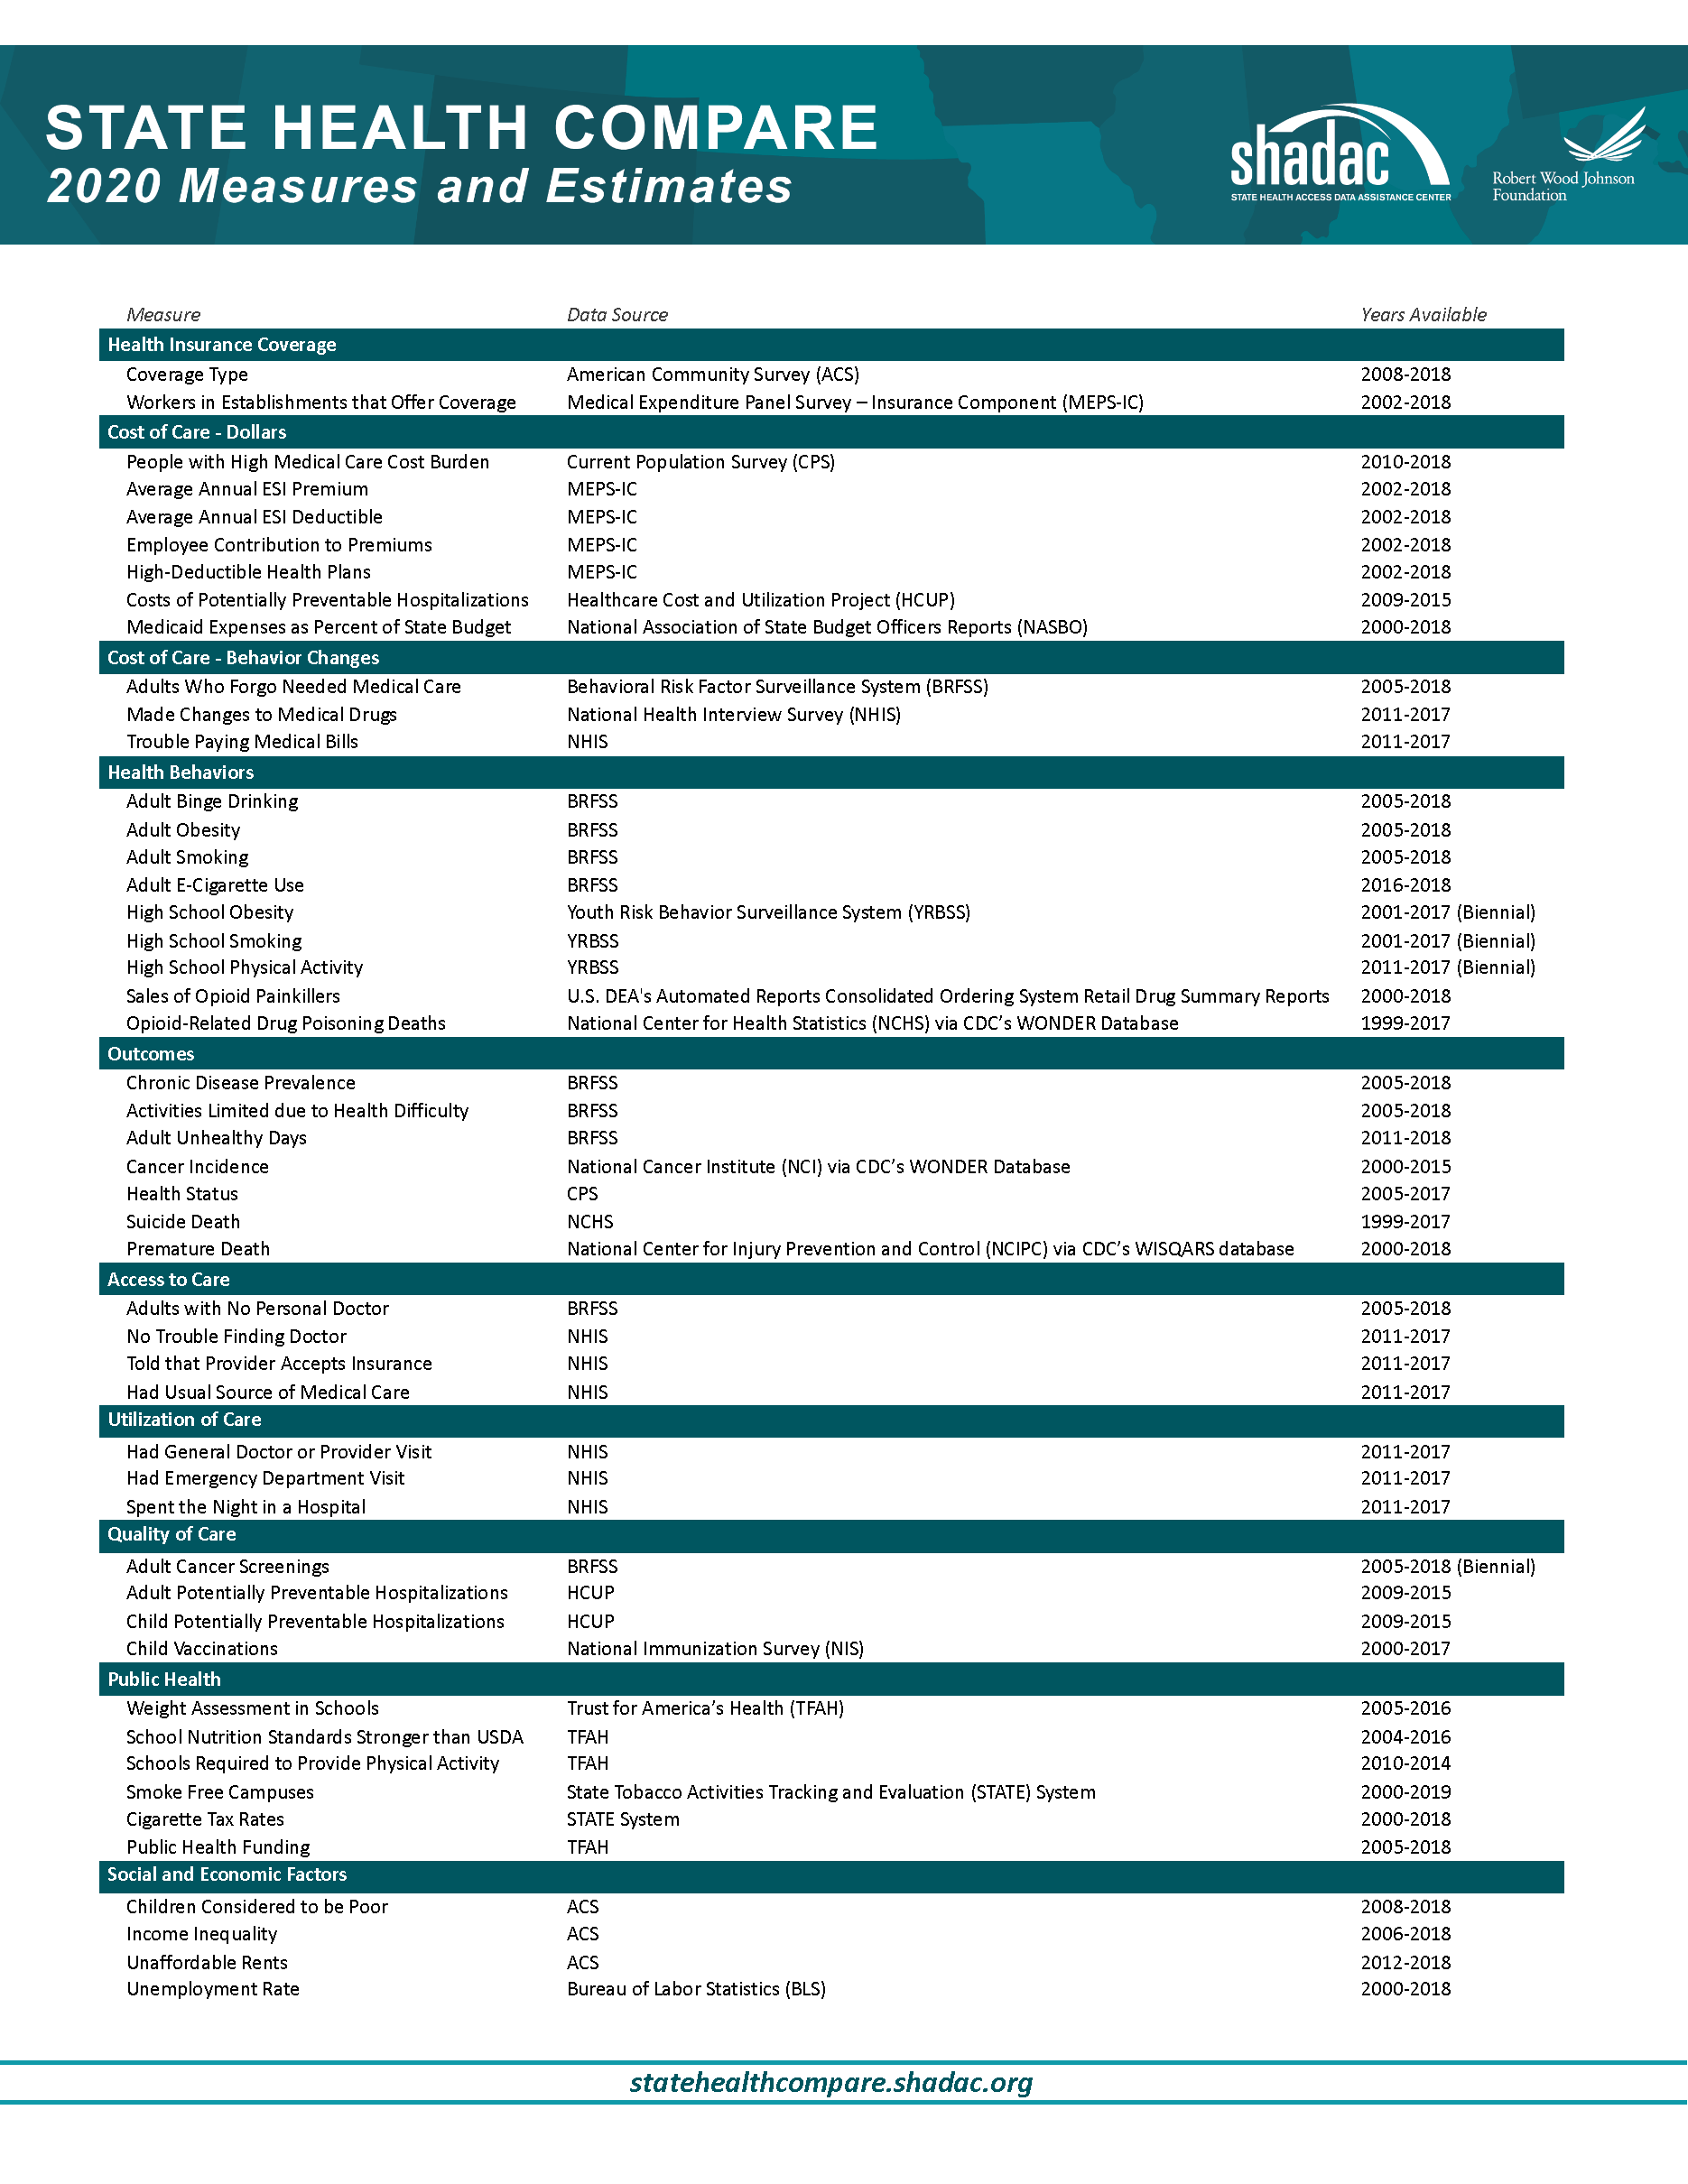
July 15, 2020:Though still in the midst of the coronavirus pandemic, the United States continues to grapple with other national public health emergencies, such as the opioid crisis. Indeed, many public health experts have voiced concerns about the potential effects of COVID-19 on mental health and associated issues, including the rates of suicide deaths, alcohol-related deaths, and opioid and related drug overdose deaths, commonly referred to as “deaths of despair.”
SHADAC researchers have been researching these topics using vital statistics data, recently publishing an analysis of national and state suicide death rates, as well as producing this set of updated two-page infographics focused on opioid and opioid-related drug overdose deaths using the latest annual data for all 50 states and the District of Columbia. SHADAC also makes all of the 2018 data used in those infographics publicly available through our State Health Compare online data tool.*
Click on a state below to see its two-page infographic or download all state's infographics here.

HIGHLIGHTS
Background: U.S. trends in drug overdose deaths
 As data have increasingly shown, the opioid crisis has continued to evolve beyond just the different classes of opioids—such as natural and semi-synthetic opioids, synthetic opioids, and heroin—to include two types of non-opioid illicit drugs that have commonly been reported in combination with opioid overdoses: cocaine and psychostimulants (such as methamphetamine).
From 2000 to approximately 2011, the growth in opioid overdose deaths was driven primarily by natural and semi-synthetic opioids (i.e., prescription opioid painkillers); but that death rate has since largely plateaued. Beginning around 2011, deaths from heroin began to increase more rapidly, but reached their own plateau in 2015. Since around 2013, it is deaths from synthetic opioids (such as fentanyl) that have experienced the largest increases—a trend that continued in 2018, with the national rate from this drug category (9.9 deaths per 100,000 people) registering nearly three times as high as natural and semi-synthetic opioids (3.8 per 100,000 people) and almost double that of heroin (4.7 per 100,000 people).
Around the same time that death rates from heroin and synthetic opioids began to increase, deaths from cocaine and psychostimulants (e.g., methamphetamine) also began to rise; due in part, evidence has strongly suggested, to deaths involving multiple drugs.1 In 2018, overdose death rates for both drugs reached new highs at 4.5 per 100,000 people for cocaine and 3.9 per 100,000 people for psychostimulants.

State variation in overdose deaths
While it is important to understand the national toll of the crisis, the story at the state level shows the dynamics of this public health crisis can vary widely, both in the prevalence of overdose deaths and the types of drugs associated with those deaths.
Opioid Overdose Deaths
Although most states have experienced measurable increases in opioid overdose deaths between 2017 and 2018, the scale of the crisis has seen wide variation. For example, while the rate for the state with the number of deaths from synthetic opioids in 2018, West Virginia, decreased from 37.4 per 100,000 people in 2017 to 34.0 per 100,000 in 2018, this rate was still nearly 30 times the rate of the lowest state, Texas (1.2 deaths per 100,000 people).
The types of opioids most commonly associated with overdoses can also vary across states. For example, as in 2017, Utah had the second-highest rate of deaths from natural and semi-synthetic opioids in 2018, at 9.6 deaths per 100,000 people; however, contrary to the U.S. trajectory, the state’s rate of deaths from synthetic opioids remained relatively steady, at 3.1 per 100,000 people in 2017 and 2.9 per 100,000 in 2018—well below the U.S. rate of 9.9 per 100,000 people (up significantly from 9.0 per 100,000 in 2017).
Overdose Deaths from Cocaine and Psychostimulants
The scale of overdose deaths from non-opioid illicit drugs also varies widely across states. For example, the 2018 overdose death rate from cocaine was highest in Delaware at 15.9 per 100,000; the state jumped four places to overtake the District of Columbia (17.6 deaths per 100,000 people in 2017), and Delaware’s rate was 17 times that of Arkansas and Minnesota (0.9 deaths per 100,000 people).
In 2018, the state with the highest overdose death rate from psychostimulants was again West Virginia at 19.3 per 100,000 people, a significant increase from 13.6 deaths per 100,000 people in 2017; West Virginia’s rate was more than 19 times the rate of 1.0 deaths per 100,000 people in New York.
Regional Patterns in Drug Overdose Death Rates
Despite the evidence of state variation in drug overdose death rates, further analysis illustrates some broader patterns across regions that have remained fairly consistent between 2017 and 2018:
Heroin and synthetic opioids
Death rates from heroin and synthetic opioids are generally higher east of the Mississippi River, particularly among states in the Northeast, the Appalachian region, and the industrial Midwest.
Natural and semi-synthetic opioids
Higher death rates from natural and semi-synthetic opioids are more geographically dispersed than those from heroin and synthetic opioids. While some eastern U.S. states have particularly high rates of deaths from natural and semi-synthetic opioids (e.g., Maryland, Tennessee, and West Virginia), there are other states in the western U.S. that also have similarly high death rates from these drugs (e.g., Utah, New Mexico, and Nevada).
Cocaine
An examination of cocaine death rates reveals a pattern similar to that of death rates from heroin and synthetic opioids, with states east of the Mississippi River exhibiting higher rates of cocaine overdose deaths.
Psychostimulants
Death rate patterns from psychostimulants appear to be almost the opposite of those for heroin and synthetic opioids, with relatively low death rates in the Northeast and particularly high rates of deaths in the western U.S. and the Southeast. Only two states—Kentucky and West Virginia—show strong overlaps between psychostimulant and heroin and synthetic opioid deaths.
Conclusion
Some early data from the CDC show encouraging signs that progress is being made in the fight against opioids, with the national drug overdose rate declining from 2017 to 20182; however, examining trends at the state level show a more nuanced picture. While improvements have been found in key states such as Ohio, which saw significant decreases in nearly every drug category (heroin, natural and semi-synthetic opioids, synthetic opioids, and cocaine) from 2017 to 2018, other states such as Delaware have seen historic increases in their rates of overdose deaths from synthetic opioids, heroin, and cocaine (the state now ranks highest among all 50 states in the latter two drug categories) for this same time period. Because of the opioid crisis’s history of evolving and changing, it will be important to continue monitoring data on drug overdoses to track whether death rates continue to decline or experience a resurgence—possibly driven by new drugs.
Explore the drug overdose death data further on State Health Compare.
Further Reading and Resources
The Opioid Epidemic in the United States
SHADAC Resource, March 2020 (Updated)
The Evolving Opioid Epidemic: Observing the Changes in the Opioid Crisis through State-level Data
SHADAC Webinar, September 2019
The Opioid Epidemic: National and State Trends in Opioid-Related Overdose Deaths from 2000 to 2017
SHADAC Briefs, June 2019
1 Kariisa, M., Scholl, L., Wilson, N., Seth, P., & Hoots, B. (2019, May 3). Drug overdose deaths involving cocaine and psychostimulants with abuse potential—United States, 2003-2017. MMWR, 68(17), 388-395. DOI: http://dx.doi.org/10.15585/mmwr.mm6817a3
Drug Enforcement Administration (DEA) Strategic Intelligence Section. (2020). 2019 National Drug Threat Assessment [DEA-DCT-DIR-007-20]. Retrieved from https://www.dea.gov/sites/default/files/2020-01/2019-NDTA-final-01-14-2020_Low_Web-DIR-007-20_2019.pdf
Insufficient evidence exists as to whether the pattern of non-opioid illicit substances is driven primarily by unintentional contamination (e.g., drug traffickers accidentally mixing fentanyl into cocaine due to sloppy packaging) or intentional mixing of different drug types (e.g., drug traffickers purposefully blending methamphetamine and fentanyl into counterfeit prescription pills).
2 Hedegaard, H., Miniño, A.M., & Warner, M. (2020). Drug overdose deaths in the United States, 1999-2018 [Data brief No. 356]. Retrieved from https://www.cdc.gov/nchs/data/databriefs/db356-h.pdf
Blog & News

State Health Compare data offer baseline for measuring pandemic’s impact on suicide, drug overdose death rates
July 02, 2020:Even as thousands of Americans continue to die each day from COVID-19, many people are beginning to worry about the pandemic’s effects on other of the country’s ongoing public health crises, such as “deaths of despair” caused by suicides, alcohol abuse, and overdoses from opioids and other drugs. Over the past two decades, the United States has seen alarming rises in death rates from these causes, including a nearly 40 percent increase in suicide deaths between 2000 and 2018,[1] and a roughly 250 percent increase in drug overdose deaths in that same time period.

Some experts have warned that the stress of the pandemic itself—as well as from the historic economic downturn and social isolation caused by efforts to reduce person-to-person virus transmission—could exacerbate these already grim public health situations.
For example, a recent perspective in the research journal JAMA Psychiatry acknowledged that consequences and responses to the pandemic “may increase the risk of suicide.”[2] And a similar article in JAMA Health Forum raised concerns that the pandemic could stall or reverse nascent progress in combatting the opioid crisis by reducing access to interventions, such as medication-assisted treatment (MAT) and the overdose-reversing medication naloxone, and possibly even cause the opioid crisis to deepen as “millions more may be at increased risk for developing a substance use disorder” due to the trauma of the crisis.[3]
Early evidence also suggests that the coronavirus pandemic may be influencing the deaths of despair crises. For instance, a recent SHADAC COVID-19 Survey found that 15 percent of U.S. adults reported increased alcohol use due to the crisis,[4] mental health crisis hotlines have reported increased volume,[5],[6],[7] and a White House drug policy office has found increased drug overdose deaths during early 2020.[8]
The coronavirus crisis is still evolving, but as policymakers, researchers and others seek to understand the potential impacts, SHADAC has made data on state suicide and drug overdose death rates available through our State Health Compare website. Although updated data for 2020 aren’t expected until late 2021, the currently available data through 2018 provide an important baseline for understanding the prevalence and trends of suicide and drug overdose deaths leading up to the COVID-19 pandemic.
[1] State Health Access Data Assistance Center (SHADAC). (2020). Suicide rates on the rise: Examining continuing trends and variation across the nation and in the states from 2000 to 2018. Available from https://www.shadac.org/2020SuicideBriefs
[2] Reger, M.A., Stanley, I.H., & Joiner, T.E. (2020, April 10). Suicide mortality and coronavirus disease 2019—A perfect storm? JAMA Psychiatry. doi: 10.1001/jamapsychiatry.2020.1060
[3] Slat, S., Thomas, J., & Lagisetty, P. (2020, May 29). Coronavirus disease 2019 and opioid use—A pandemic within and epidemic. JAMA Health Forum. Available from https://jamanetwork-com.ezp3.lib.umn.edu/channels/health-forum/fullarticle/2766790?resultClick=1
[4] State Health Access Data Assistance Center (SHADAC). (2020, May 26). 90 percent of U.S. adults report increased stress due to pandemic. Available from https://www.shadac.org/SHADAC_COVID19_Stress_AmeriSpeak-Survey
[5] Noguchi, Y. (2020, May 4). Flood of calls and texts to crisis hotlines reflects Americans’ rising anxiety. Retrieved from https://www.npr.org/sections/health-shots/2020/05/04/847841791/flood-of-calls-and-texts-to-crisis-hotlines-reflects-americans-rising-anxiety
[6] Cabanatuan, M. (2020, April 15). Bay Area suicide hotlines see high volume from anxious callers during coronavirus crisis. San Francisco Chronicle. Retrieved from https://www.sfchronicle.com/bayarea/article/Suicide-hotlines-seeing-an-increase-in-calls-for-15200885.php
[7] Jackson, A. (2020, April 10). A crisis mental-health hotline has seen an 891% spike in calls. Retrieved from https://www.cnn.com/2020/04/10/us/disaster-hotline-call-increase-wellness-trnd/index.html
[8] Ehley, B. (2020, June 29). Pandemic unleashes a spike in overdose deaths. Politico. Retrieved from https://www.politico.com/news/2020/06/29/pandemic-unleashes-a-spike-in-overdose-deaths-345183?nname=politico-nightly-coronavirus-special-edition&nid=00000170-c000-da87-af78-e185fa700000&nrid=0000014c-2416-d9dd-a5ec-34be2b4a0000&nlid=2670445
Blog & News
Now Available on State Health Compare: Updated Measures on Access and Cost of Care, Public Health, Health Behaviors and Outcomes, and Social and Economic Factors
May 6, 2020:SHADAC has added two brand new measures and updated four previously existing measures with the latest available estimates on the State Health Compare website.

The new measures include:
Broadband Internet Access
 This measure indicates the percentage of non-group quarters households that have a broadband internet subscription, which includes a cellular data plan, cable, fiber optic, DSL, or satellite internet service. Households counted in this measure are also limited to those that pay a cell phone or internet service provider for the broadband access, as households that have access to broadband internet without paying for it do exist, but are a relatively small percentage (3.0 percent in 2018). Estimates are available for years 2016-2018 and can be broken down by family income levels, metropolitan status, Medicaid coverage, and disability status.
Medical Out-of-Pocket Spending
The state-level estimates for this measure indicate the annual median family medical out-of-pocket spending (MOOP), including premiums, for individuals in the civilian noninstitutionalized population. “Out-of-pocket” (OOP) is the term used to describe the costs of health care that are not covered by health insurance but paid for out of an individual’s own resources. These costs include premiums and medical expenses not covered by their medical plan, including copays for doctor and dentist visits, diagnostic tests, prescription medicine, glasses and contacts, and medical supplies. This measure can also be viewed by coverage type for those with employer-based coverage, and is available for years 2017 and 2018.
The updated measures include:
State Public Health Funding
Estimates for this measure represent the dollar amount of state per capita public health funding during the fiscal year. Data is available starting in 2005 (except in 2006, when no data was available) through 2019.
Unemployment Rate
This measure records the rate of unemployment (seasonally adjusted) as a percentage for each state. Estimates are available from 2000 through 2018.
Opioid-related Drug Poisoning Deaths
The measure for opioid-related drug poisoning deaths encompasses all age-adjusted rates of deaths caused by drug poisoning (i.e., overdose) per 100,000 people. Data breakdowns are available for users to select by individual drug types, which now include natural and semi-synthetic opioids, synthetic opioids (non-methadone), the illegal opioid heroin, cocaine, and psychostimulants, as well as rolling up into selective “all opioids” and “all drugs” categories. Estimates are available from 1999-2018.
Health Status
This measure encompasses the percentange of adults who report being in either "fair" or "poor" health. Estimates can be viewed by demographics including education level and race/ethnicity, and are available beginning in 2005 through 2017, and also from 2017-2018 after the Current Population Survey (CPS), from which this measure is drawn, updated their data processing system.
Explore these updated estimates on State Health Compare!
Data Sources
The State Health Compare estimates for broadband internet access come from the American Community Survey (ACS). The measures of median medical out-of-pocket spending and health status come from the Current Population Survey (CPS). Per person state public health funding estimates are from the Trust for America’s Health annual Impact of Chronic Underfunding on America’s Public Health System report. Unemployment rates are produced using data from the U.S. Bureau of Labor Statistics. The estimates for the opioid-related drug poisoning deaths measure come from the National Center for Health Statistics (NCHS) via the Center for Disease Control and Prevention’s (CDC) WONDER database.
Blog & News

Studying the Impact of COVID-19: State-Level Data Resources on State Health Compare
April 20, 2020:Though the spread of disease caused by the novel coronavirus (COVID-19) has impacted the lives of individuals across the United States, the magnitude of the virus' effects has varied greatly across different states. Access to current, accurate state-level data is important in order to inform state researchers, analysts, and policymakers’ efforts to understand and respond to the disparate impacts of COVID-19 on their resident populations.
To that end, this blog provides a high-level overview of a range of data measures currently housed in our online data tool, State Health Compare, as well as a number of related resources that provide more in-depth analysis for certain measures. Notably, estimates for each of the measures listed are available for subpopulations that often highlight persistent disparities in health—a feature that may prove especially useful as calls to further break down data related to COVID-19 into subcategories (e.g., gender, age, race/ethnicity, etc.) to track the impact of the disease on specific populations have recently increased.
Risk Factors
Chronic Disease Prevalence
This measure captures the percent of adults who reported having one or more common chronic conditions such as diabetes, cardiovascular disease, heart attack, stroke, or asthma. It includes breakdowns by race/ethnicity and educational attainment. (2005-2010, 2011-2019)*
Adult Smoking
This measure shows the percent of adults who reported smoking, defined as adults who have smoked 100 or more cigarettes in their lifetime and who currently smoke some days or every day. The measure is broken down by race/ethnicity and educational attainment. (2005-2010, 2011-2019)*
Related Resource: SHADAC researchers used data from the Behavioral Risk Factor Surveillance System (BRFSS) to produce analyses focused on several different health behaviors, including Adult Smoking and E-cigarette Use in the United States. This blog, part of a spotlight series including binge drinking and obesity, looks at national and state-level rates at which adults with different racial/ethnic backgrounds smoke and vape in 2018 and 2017.
State Health Funding
Medicaid Expenses as Percent of State Budget
This measure captures state and federal spending on Medicaid as a share of each state’s budget. (2000-2018)
Public Health Funding
This measure shows state public health funding per capita by fiscal year. (2005-2019; no data available for 2006)
Related Resource: SHADAC researchers produce an annual brief, Exploring Public Health Indicators with State Health Compare: State Public Health Funding, exploring the wide variation in per capita public health funding by state, and why public health funding data, in conjunction with state performance on other public health indicators, might signal which states are best suited to absorb a potential decrease in funding and which states might be hit hardest.
Access to Health Care
Had Usual Source of Medical Care
This measure counts the percent of people who had a usual source of medical care other than the emergency department (i.e., doctor’s office, clinic, health center, etc.) in the past year. Breakdowns by age and coverage type are also available. (2011-2017)
Adults with No Personal Doctor
This measure denotes the percent of adults without a personal doctor and offers breakdowns by education level and race/ethnicity. (2005-2010, 2011-2019)*
Related Resource: SHADAC recently produced a blog and infographic - Affordability and Access to Care in 2018: Examining Racial and Educational Inequities across the United States (Infographic) - focusing on racial/education inequities in access and ability to afford medical care, using this measure along with estimates for Adults Who Forgo Needed Medical Care.
Broadband Internet Access
This measure shows the percent of households that have a broadband internet subscription (i.e., that pay a cell phone or internet services provider for the service), which includes a cellular data plan, cable, fiber optic, DSL, or satellite internet service. (2016-2018)
Related Resource: A new SHADAC blog explores the way that Internet Access Measures the Impact of the Digital Divide and COVID-19. An initial analysis of the estimates shows variation in access to broadband across states, and reveals disparities by income, rurality, coverage, and disability status.
Insurance Coverage
Coverage Type
This measure shows the rates of different types of health insurance coverage, including Medicare, employer-sponsored insurance (ESI), Medicaid, and individual coverage, as well as no insurance coverage. Users can view this measure by a variety of breakdowns, including: age, citizenship, disability status, education, family income, health status, limited English proficiency, marital status, poverty level, race/ethnicity, sex, and work status. (2008-2018)
Health Care Costs and Affordability
People with High Medical Care Cost Burden
This measure highlights the percent of individuals in families where out-of-pocket health care spending, including premiums, has exceeded 10 percent of annual income. Breakdowns by employer coverage, income, and race/ethnicity are available for each state. (2010-2012, 2013-2017, 2017-2018)*
Medical Out-of-Pocket Spending
This measure estimates the annual median family “out-of-pocket” spending, including premiums, on health care costs that are typically not covered by health insurance but paid for out of an individual’s own resources. These costs can include copays for doctor and dentist visits, diagnostic tests, prescription medicine, glasses and contacts, and medical supplies. (2017-2018)
Related Resource: SHADAC used this measure to produce a brief entitled State-level Estimates of Medical Out-of-Pocket Spending for Individuals with Employer-sponsored Insurance Coverage, which shows state variation in medical out-of-pocket spending (with a brief section that also looks at high medical cost burden) for people with employer-sponsored insurance.
High-Deductible Health Plans
This measure reports the percent of private-sector employees enrolled in high-deductible health insurance plans. High-deductible health plans are defined as plans that meet the minimum deductible amount required for Health Savings Account (HSA) eligibility (e.g., $1,350 for an individual and $2,700 for a family in 2018); breakdowns by firm size are offered. (2012-2019)
Average Annual ESI Deductible and Average Annual ESI Premium
This first measure reports the average annual deductible for private-sector workers who receive a health insurance plan through their employer that has a deductible. The second measure reports the average annual premium for private-sector workers who get health insurance through their employer. Both measures can be broken down by plan type (family or single). (2003-2019; partial data for 2002)
Related Resources: SHADAC produces an annual report, the latest being State-level Trends in Employer-sponsored Insurance (ESI), 2014-2018, focused on the more than 62 million private-sector employees enrolled in Employer-Sponsored Insurance (ESI) coverage and their growing out-of-pocket costs. The report includes a narrative summary, interactive map, two-page state profiles, and data tables.
From the data used to produce our annual ESI report, SHADAC researchers also created A Deeper Dive on Employer-sponsored Health Insurance: Costs in Five States in Comparison with the United States; a focused, five state analysis of ESI trends in order to better understand which states are most affected by increasing premiums and deductibles or might have a population with high enrollment in high-deductible health plans (HDHPs), leaving them financially vulnerable in case of an unexpected health crisis that leads to large medical bills.
Adults Who Forgo Needed Medical Care
The measure indicates the percent of adults in each state who could not get needed medical care due to cost. Breakdowns by education level and race/ethnicity are available for all states. (2005-2010, 2011-2019)
Related Resource: SHADAC recently produced a blog and infographic - Affordability and Access to Care in 2018: Examining Racial and Educational Inequities across the United States (Infographic) - focusing on racial/education inequities in access and ability to afford medical care, using this measure along with estimates for Adults with No Personal Doctor.
Trouble Paying Medical Bills
This measure tracks the rates of individuals who had difficulty paying off medical bills during the past twelve months or that were paying off medical bills over time. The measure can be broken down by age and insurance coverage type. (2011-2017)
Related Resource: In light of rising health care cost burdens, SHADAC produced a blog, Measuring Health Care Affordability with State Health Compare: Trouble Paying Medical Bills, assessing changes and patterns in health care affordability across the United States by tracking the percent of individuals that had difficulty paying off medical bills currently or over time.
Explore these measures on State Health Compare!
Notes
For a full overview of all available state-level measures, please visit the “Explore Data” page on State Health Compare, or take a look at our one-page guide to State Health Compare measures and their data sources.
All measures marked with an “*”: This indicates a break in series due to survey changes in either data processing or implementation methodology.
Blog & News
Internet Access Measures the Impact of the Digital Divide and COVID-19
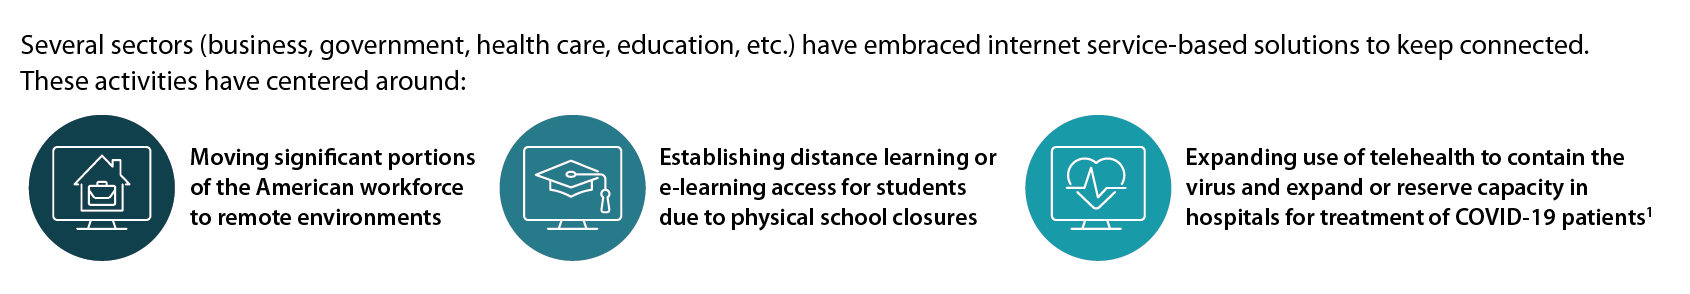
March 27, 2020:The arrival of the novel coronavirus (COVID-19) has fundamentally changed the way we work, live, and seek health care. As more and more of the population across the United States is being asked to stay in their homes to assist the efforts toward containment and prevention of the virus, access to the internet has become a vital lifeline for families and individuals to keep in touch with their loved ones, participate in online school activities, and to work from home. Several sectors (business, government, health care, education, etc.) have embraced internet service-based solutions to keep connected. These activities have centered around:
These shifts not only test the capabilities of our current broadband internet systems, but also bring into sharp relief an issue commonly known as the “digital divide,” or the divide between individuals who have access to telecommunications and internet service (including the ability to connect to broadband in-home) and those who do not.2
SHADAC has added a new measure to our state data web tool, State Health Compare, to provide information about the digital divide at the state level and for key subpopulations: the percentage of households with access to broadband internet services. From an initial analysis of the newly available estimates, our findings show variation in access to broadband across states, and reveal disparities by income, rurality, coverage, and disability status.* We discuss these findings in more detail below.
State Variation in Internet Access
Rates of broadband internet access ranged substantially across states in 2018, from a high of 89.9 percent in Utah to a low of 76.4 percent in Mississippi. When compared to the national rate (85.0 percent)...


Access to Broadband Internet Service by…
Household Income
Nationally, households with incomes of $50,000 or higher were 45 percent more likely to have broadband internet access than households with incomes less than $25,000 (93.5 percent vs. 64.3 percent).
- In all 50 states and D.C., households with incomes $50,000 or higher were over 25 percent more likely to have broadband internet access than households with less than $25,000 in income.
- In 17 states, this disparity of access rose to 50 percent when comparing households with incomes $50,000 or higher to households with less than $25,000 in income.
Metropolitan Area
Nationally, households that were located in a metropolitan statistical area (MSA) were 11 percent more likely to have broadband internet access than households located in a non-metropolitan area (86.7 percent vs. 78.1 percent). Among the 44 states where estimates of broadband internet access by MSA/non-MSA were available:
- Households located in metropolitan areas had higher rates of broadband internet access than households in non-metropolitan areas in 39 states.
- In nine states (Alaska, Arizona, Arkansas, Florida, Georgia, Hawaii, Louisiana, Mississippi, Virginia), households located in metropolitan areas were over 20 percent more likely to have broadband internet access than their non-metropolitan counterparts.
- In Arizona, the disparity in access rose to over 60 percent when comparing metropolitan to non-metropolitan households.
Medicaid Coverage
Nationally, households that included someone enrolled in Medicaid were approximately 9 percent less likely to have broadband internet access than households that did not include an individual with Medicaid coverage (79.2 percent vs. 86.9 percent).
- In 19 states (including DC), households that included someone with Medicaid coverage were over 10 percent less likely to have internet access than households that did not include a Medicaid enrollee.
- This gap in access more than doubled in D.C., where households that included someone with Medicaid coverage were over 20 percent less likely (21.4 percent) to have internet access than households not including a Medicaid enrollee.
Disability Status
Nationally, households that included someone with a disability were approximately 14 percent less likely to have broadband internet access than households that did not include anyone with a disability (76.0 percent vs. 88.1 percent).
- In 23 states (including D.C.), households that included someone with a disability were over 15 percent less likely to have internet access than households that did include someone with a disability.
- In four states (Alabama, Maine, Minnesota, and Mississippi) and D.C., households that included someone with a disability were over 17 percent less likely to have internet access than households that did not.
Discussion
The lack of equitable access to broadband internet services across all households has been an issue of concern among health care experts even prior to the coronavirus pandemic. Initially, the problem of digital divide was studied in terms of barriers to health plan application and enrollment during the rollout of the newly developed online health insurance marketplace.3
Now, in light of recent events, lack of access to broadband internet services has also emerged as a potential challenge to efforts to respond to the coronavirus; not only in preventing individuals from accessing the real-time information they need surrounding COVID-19, but also in lost chances for utilization of telemedicine services, ability to work remotely, keeping pace with an e-learning curriculum, or to help mitigate the dangers of social isolation while practicing social distancing.4
Notes and Definitions
* All differences described in this blog are statistically significant at the 95% confidence level unless otherwise specified.
In the definition of the new State Health Compare measure, a broadband subscription includes a cellular data plan, cable, fiber optic, or DSL or satellite internet service. Households with a broadband subscription only include those who pay a cell phone or internet provider for the service. The percent of households that have access to broadband without paying for it is relatively small (approximately 3% in 2018).
Households' metropolitan status is determined at the public use microdata area (PUMA) level. Households are classified as “metropolitan” if their PUMA lies entirely inside a metropolitan statistical area (MSA) and are classified as “non-metropolitan” if their PUMA lies entirely outside an MSA.
“Medicaid enrollment” is defined as at least one person in the household having Medicaid coverage and “disability” is defined as at least one person of the household having a functional disability.
Related Resources
General Provider Telehealth and Telemedicine Tool Kit
The Coronavirus Outbreak Could Finally Make Telemedicine Mainstream in the U.S.
Opportunities to Expand Telehealth Use amid the Coronavirus Pandemic
Connectivity Considerations for Telehealth Programs
Telemedicine during COVID-19: Benefits, limitations, burdens, adaptation
Growth of Telemedicine Slowed by Internet Access Challenges
References
1 One of the most publicized and recognizable notices recently came from the Centers for Medicare & Medicaid Services, which expanded Medicare telehealth services. Centers for Medicare & Medicaid Services (CMS). (2020, March 17). Medicare telemedicine health care provider fact sheet. https://www.cms.gov/newsroom/fact-sheets/medicare-telemedicine-health-care-provider-fact-sheet
2 Congressional Research Service. (2020, March 13). COVID-19 and broadband: Potential implications for the digital divide. https://crsreports.congress.gov/product/pdf/IN/IN11239
3 Boudreaux, M.H., Gonzales, G., & Blewett, L.A. (2016). Residential high-speed internet among those likely to benefit from an online health insurance marketplace. INQUIRY, 53, 1-7. https://doi.org/10.1177/0046958015625231
4 Henning-Smith, C. (2020, March 18). COVID-19 poses an unequal risk of isolation and loneliness. The Hill. https://thehill.com/opinion/healthcare/488215-covid-19-poses-an-unequal-risk-of-isolation-and-loneliness