| RESOURCES |
|
State Profiles 50-State Comparison Tables
Interactive Map |
Introduction
Health reform continues to be an ever-changing landscape, with numerous states in various stages and forms of Medicaid expansion, the fate of the Affordable Care Act as yet unknown, and politicians putting forward proposals to create new public coverage options or replace private coverage entirely. Though the future of health care may be unclear, it is important to understand the current state of affordability and access in our existing system, which, in the United States, is predominated by employment-based health insurance coverage, with more than 62 million private-sector employees enrolled in Employer-Sponsored Insurance (ESI) coverage in 2018.
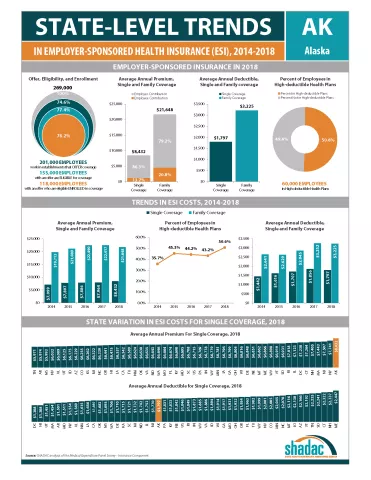
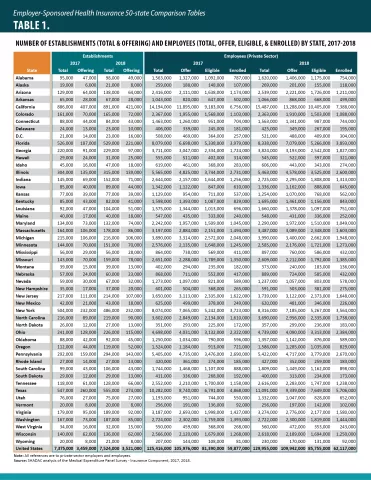
To this end, SHADAC presents four related products analyzing the experiences of private-sector employees who had employer-sponsored insurance (ESI), from 2014–2018: a series of individual state profiles highlighting ESI trends, 50-state comparison data tables, a national-level infographic with an accompanying blog, and a 50-state interactive map showing levels of, and changes in, average annual premiums for single coverage in 2018. These analyses use estimates from the Medical Expenditure Panel Survey–Insurance Component (MEPS–IC), recently produced by the Agency for Healthcare Research and Quality (AHRQ).
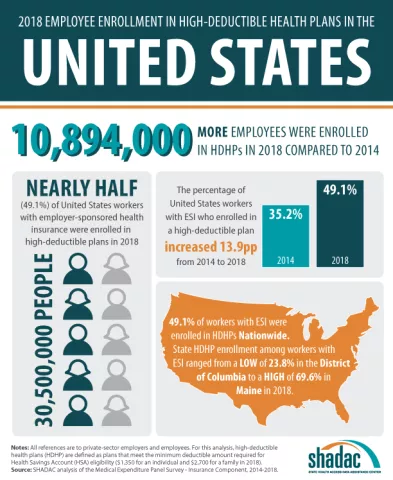
This post provides an overview of the trends in affordability of ESI coverage and employees’ access to ESI. As in previous years, ESI premiums are high and have continued their sizeable increase—the average premium for family coverage was nearly $20,000 per year in 2018. In addition, employees with ESI face substantial cost-sharing, with average annual deductibles of more than $1,800 for single coverage and nearly $3,400 for family coverage in 2018. Additionally, almost half (49.1 percent) of employees receiving ESI nationwide were enrolled in a high-deductible health plan (HDHP).[1]
Premiums rose nationally and in 22 states in 2018
Among private sector workers who receive ESI, average annual premiums increased nationally and in 22 states (including D.C.) between 2017 and 2018. No states experienced decreases in average premiums over that period. Georgia had the largest increase in single premiums at 16.2 percent ($950) to $6,799 in 2018 from $5,849 in 2017, and Kentucky had the largest increase in family premiums at 13.7 percent ($2,329) to $19,277 in 2018 from $16,948 in 2017. The chart below shows trends in single and family premiums for the states with the largest significant increases in single or family premiums between 2017 and 2018.
States with the Largest Increases in Average Family Premiums, 2017-2018
States with the Largest Increases in Average Single Premiums, 2017-2018
(Grey lines in the charts above allow you to compare across the 5 states with the largest increases in premiums)
Premiums also ranged significantly across the states in 2018, from $5,971 in Tennessee to $8,432 in Alaska for single coverage and from $17,337 in North Dakota to $22,294 in New Jersey for family coverage.
Deductibles were stable in 2018 but remained high
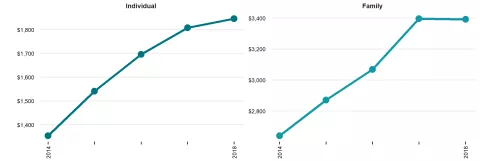
Employees with coverage through their employer continued to face large deductibles in 2018. Nationally, the average deductible reached $1,846 for individuals and $3,392 for families. Eight states saw increases in individual deductibles, and just four states saw increases in family deductibles. Average individual deductibles fell in one state (Utah), and family deductibles fell in two states (Utah and Nebraska).
Average Individual and Family Deductibles, 2014–2018
There was a great deal of variation across states in the size of deductibles, ranging from $1,308 in Hawaii and D.C. to $2,447 in Maine for individual deductibles and from $2,362 in D.C. to $4,644 in New Hampshire for family deductibles.
Overall, individual and family deductibles were stable from 2017 to 2018 at the national level—a change from previous years, which saw large year-over-year growth in deductibles. Nevertheless, it is likely too soon to say if 2018 data represents a break in the long-running growth in ESI deductibles or just a temporary pause.
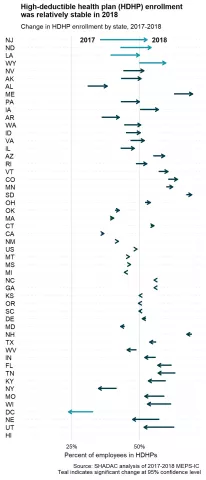
The percent of employees enrolled in a high-deductible health plan (HDHP) also held steady in 2018 at 49.1 percent nationwide. HDHP enrollment increased in four states and decreased in the District of Columbia from 2017 to 2018. A majority of employees were enrolled in a HDHP in nine states.
Employees’ access to ESI coverage largely unchanged in 2018
Employee access to ESI has three components:
- Employee Offer: An employee must work in an establishment that offers coverage.
- Employee Eligibility: An employee must meet the criteria established by the employer to be eligible for coverage that is offered. (For example, the employee might have to work a minimum number of hours per pay period or complete a minimum length of service with the employer in order to be eligible.)
- Employee Take-Up: The employee must decide to enroll in—or “take up”—the offer of ESI coverage.
Less than half (46.8 percent) of private-sector establishments offered coverage to their employees in 2018, statistically unchanged from 2017.
Nationally, 85.6 percent of employees worked at an establishment that offered ESI in 2018, also statistically unchanged from 2017. This trend in employee offer rates was reflected across the states, with only no states seeing an increase, and only two states seeing a decrease (Montana and South Carolina). However, substantial variation across the states remained, with employee offer rates ranging from 64.5 percent in Montana to 95.8 percent in Hawaii.
Among employees working at an offering establishment, 78.0 percent were eligible for ESI coverage in 2018, rising a small but statistically significant amount from 76.8 percent in 2017. In 2018, three states (Alabama, Pennsylvania, and Texas) and the District of Columbia saw increases in the eligibility rate, while just one state (South Dakota) saw a decrease.
Among employees eligible for coverage, 72.4 percent enrolled in ESI in 2018, a small decrease from 73.5 percent in 2017. However, the enrollment rate was largely stable across the country from 2017 to 2018, with one state (Utah) experiencing an increase, and three states (Michigan, Oklahoma, and Pennsylvania) experiencing a decrease.
“While employers continue to offer insurance benefits to their workers, fewer are taking up that coverage and those that do are facing ever-higher premiums and steep out-of-pocket costs,” said Elizabeth Lukanen, Deputy Director of SHADAC. “Medical bills can accrue quickly and for individuals with a high deductible and little or no savings, a health crisis or chronic illness can result in major medical debt.”
Overall, while it is heartening to see stability in ESI offer from establishments as well as a potential leveling-off for deductibles, our analysis saw concerning trends in fewer employees taking up offered ESI coverage and those that do are facing ever-higher premiums and steep out-of-pocket costs.
Interactive Map
Hover over a state on the map below to view the average annual single-coverage premium in 2018, or click a state to view and download its individual fact sheet.
| No Change in Average Annual Single-Coverage Premium in 2018 |
SIgnificant Increase in Average Annual Single-Coverage Premium in 2018 |
|---|
Significant change between 2017 and 2018 at the 95% confidence level.
For more detailed information on ESI findings from SHADAC, see the following products:
- Blog post highlighting key findings at the national level regarding ESI coverage affordability and access
- Two-page state profiles on ESI trends
- 50-state comparison tables
- Download a printable version of this report narrative
Notes and Sources
Notes. All changes and differences described in this report are statistically significant at the 95 percent confidence level unless otherwise specified. This analysis and linked products only pertain to employers, establishments, and employees in the private sector. Average premium prices have not been adjusted to account for variation in actuarial value.
Sources. Data are from the 2012–2018 Medical Expenditure Panel Survey–Insurance Component (MEPS-IC), produced by the Agency for Healthcare Research and Quality (AHRQ) and are available on SHADAC’s State Health Compare web tool at statehealthcompare.shadac.org.
Additional Resources
Employer-Sponsored Health Insurance at the State Level, 2013-2017: Chartbook and State Fact Sheets
Employer-Sponsored Insurance, 2013-2017: Premiums Grow Faster, Deductibles Continue to Increase
50-State Comparison Tables: Employer-Sponsored Insurance, 2016-2017
[1] Defined as plans that qualify for a tax-advantaged health savings account. In 2018, qualifying plans had to have an annual deductible of at least $1,350 for individual coverage or at least $2,700 for family coverage.

