VISIT STATE HEALTH COMPARE
Publication


BRFSS Spotlight Series
|
BRFSS SPOTLIGHT SERIES OVERVIEW |
Estimates are from SHADAC analysis of the Behavioral Risk Factor Surveillance System and are available on State Health Compare.

Blog & News

BRFSS Spotlight Series: Adult Obesity Prevalence in the United States (Infographic)
March 17, 2020:|
BRFSS SPOTLIGHT SERIES OVERVIEW |
Click on the infographic image to enlarge

Adult Obesity
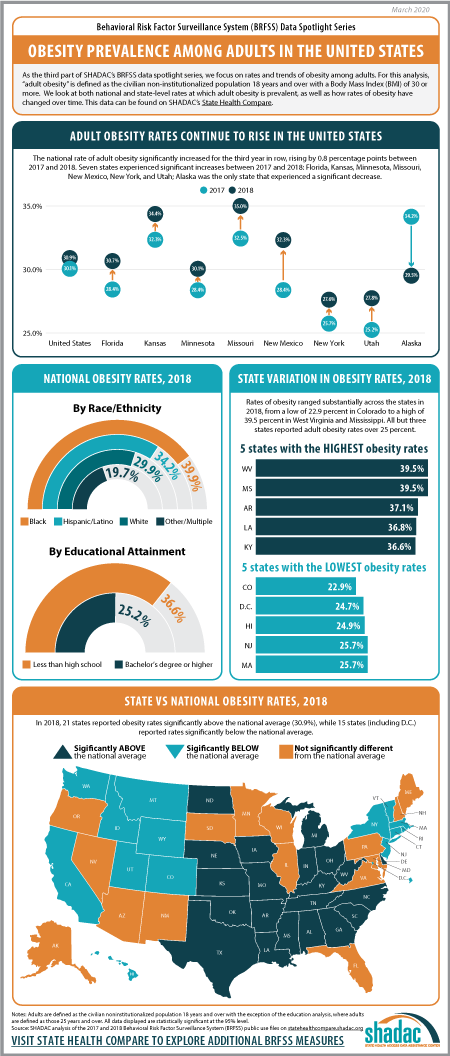
For the final post in our BRFSS Spotlight Series blog, we focused on trends in adult obesity rates. Though much attention has been paid to issues such as the opioid crisis or the rapid rise in youth vaping and e-cigarette use, the prevalence of obesity in the United States since the 1980s has made this one of the longest-running, currently declared public health emergencies in the nation.1
“Obesity” is defined as a Body Mass Index (BMI) of 30 and over, and the measure of “Adult Obesity” from the BRFSS encapsulates the self-reported prevalence of obesity among adults for the civilian non-institutionalized population 18 years and over. In using these BRFSS estimates, it is important to understand that self-reported data like these underestimates obesity rates as compared with the measured data from the National Health and Nutrition Examination Survey (NHANES). A 2016 research article from Ward et al. demonstrates a bias correction method for the BRFSS estimates that is beyond the scope of this analysis, but may be of interest to researchers.
Trends in Obesity Rates from 2017 to 2018*
The rate of adult obesity significantly increased for the third year in row nationwide from 2017 to 2018, rising by 0.8 percentage points to 30.9 percent from 30.1 percent in 2017.
Seven states experienced statistically significant increases in the rate of adult obesity from 2017 to 2018: Florida, Kansas, Minnesota, Missouri, New Mexico, New York, and Utah. Alaska was the only state to experience a statistically significant decline in the rate of obesity, decreasing 4.6 percentage points from 34.2 percent in 2017 to 29.5 percent in 2018.
Overall, however, a large majority of states (43 including D.C.) did not experience a statistically significant change in obesity rates from 2017.
State Variation (2018)
Rates of obesity ranged substantially across the states in 2018, from a high of 39.5% in West Virginia and Mississippi to a low of 22.9% in Colorado. When compared to the national rate…
- 21 states had obesity rates that were significantly higher.
- 15 states (including DC) had obesity rates that were significantly lower.
- 15 states had obesity rates that were not statistically different.
Persistently high rates of obesity are concerning in their own right, but also because obesity increases the risk for other serious health conditions such as heart disease, diabetes, stroke, and certain types of cancers, among many others.2
Unfortunately, current projections for the future indicate that the already high rates of obesity in America will only continue to increase. Without new interventions to prevent the spread of obesity, a new study using data from the BRFSS and published in the New England Journal of Medicine predicts that by 2030, nearly half of the United States population (48.9 percent) will be considered obese, with over a quarter of the nation registering as severely obese.
Notes
*All differences described here are significant at the 95% level of confidence unless otherwise specified.
For this analysis, adults are defined as those age 18 and over.
Estimates are from SHADAC analysis of the 2018 Behavioral Risk Factor Surveillance System and are available on State Health Compare.
1 Centers for Disease Control and Prevention (CDC). (1999, October 26). Obesity epidemic increases dramatically in the United States: CDCD director call for national prevention effort. Retrieved from https://www.cdc.gov/media/pressrel/r991026.htm
Health tidbits. (1999). J Natl Med Assoc, 91(12), 645. https://www.ncbi.nlm.nih.gov/pmc/articles/PMC2608606/
2 Centers for Disease Control and Prevention (CDC). (2020, February 4). Adult obesity causes & consequences. Retrieved from https://www.cdc.gov/obesity/adult/causes.html#Consequences
Blog & News
BRFSS Spotlight Series: Adult Binge Drinking Rates in the United States (Infographic)
February 27, 2020:|
BRFSS SPOTLIGHT SERIES OVERVIEW |
Click on the infographic image to enlarge

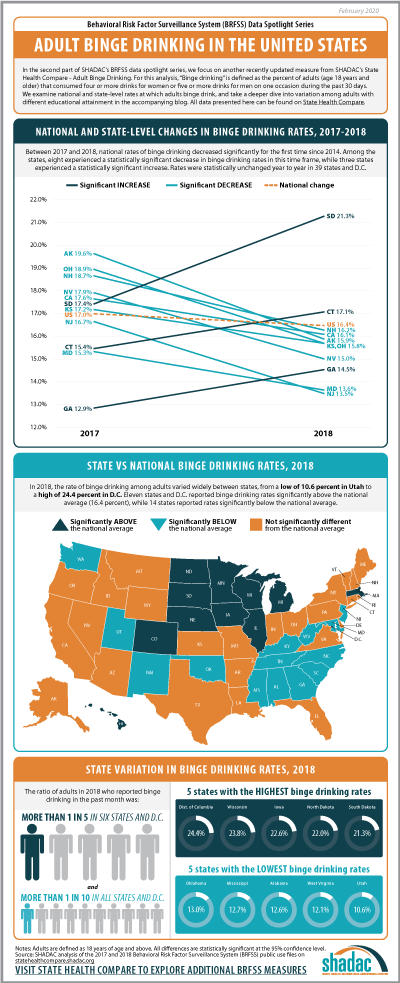
Adult Binge Drinking*
For this second post in our BRFSS Spotlight Series blog, we focus on an analysis of our Adult Binge Drinking measure (for which all differences described are statistically significant at a 95% confidence level unless otherwise specified). “Binge drinking” is defined by the Centers for Disease Control and Prevention (CDC) in the BRFSS as “drinking 5 or more drinks on an occasion for men or 4 or more drinks on an occasion for women" in the past 30 days.1
Over the past five years, adult binge drinking at the national level has increased a small but statistically significant amount from 16.0 percent in 2014 to 16.4 percent in 2018. For this analysis we also examined binge drinking by educational attainment, and found that adults (25 years and over) with a bachelor’s degree or higher in the U.S. reported a binge drinking rate of 15.7 percent in 2018, up from 15.3 percent in 2014 (percentage point difference was not statistically significant); and adults with less than a high school degree reported a rate of 13.5 percent in 2018, up from 12.8 percent in 2014.
Trends in Binge Drinking Rates from 2017 to 2018
Nationally, rates of binge drinking fell by 0.6 percentage points from 17.0 percent in 2017 to 16.4 percent in 2018—the first decrease since 2014. Statistically significant decreases in rates of binge drinking were seen in eight states: Alaska, California, Kansas, Maryland, New Hampshire, New Jersey, Nevada, and Ohio. Rates of binge drinking were statistically unchanged year to year in 39 states and D.C. Rates of binge drinking increased significantly in three states from 2017 to 2018: South Dakota, which experienced an increase of 3.9 percentage points (17.4 percent to 21.3 percent); Connecticut, which saw a 1.7 percentage-point increase (15.4 percent to 17.1 percent); and Georgia, with an increase of 1.6 percentage points (12.9 percent to 14.5 percent) between the two years.
State Variation (2018)
In 2018, rates of binge drinking varied widely between states, from a low of 10.6 percent in Utah to a high of 24.4 percent in D.C. Eleven states and D.C. reported rates of binge drinking above the national average (16.4 percent), and 14 states reported rates that fell below.
More than one in five adults reported binge drinking in the past month in six states—Iowa, Minnesota, Nebraska, North Dakota, South Dakota, and Wisconsin—and D.C., of which all but the latter were Midwest or Plains states.
Binge Drinking Rates across Education Levels+
Nationally, adults with less than a high school education were 14.1 percent less likely to report binge drinking compared to adults with a bachelor’s degree or higher level of education (13.5 percent vs. 15.7 percent).
Among the 48 states and D.C. where estimates of binge drinking among adults with a less than a high school education were statistically reliable^:
- Utah was both the only state where adults with less than a high school education were statistically more likely to report binge drinking than adults with a bachelor’s degree or higher, and also the state with the largest relative gap (89.2 percent) in binge drinking rates by education (14.7 percent vs. 7.8 percent).
- Adults with less than a high school education were statistically less likely to report binge drinking compared to adults with a bachelor’s degree or higher in 14 states, and the size of this gap varied from a low of 19.4 percent in Minnesota (15.1 percent vs. 18.8 percent) to a high of 56.6 percent in Missouri (7.8 percent vs. 17.9 percent).
- There was no statistically significant difference between these groups’ rates of binge drinking in 33 states and D.C.
This analysis follows recent trends reported by the Centers for Disease Control and Prevention, which indicates binge drinking is more common among people of higher educational levels and with household incomes of $75,000 or more. Individuals with lower incomes and educational levels in the U.S., however, consume more binge drinks (i.e., number of drinks in a binge drinking occasion) per year.2
Notes
All differences described in the post are statistically significant at the 95% confidence level unless otherwise specified.
* Rate of binge drinking among adults for the civilian noninstitutionalized population 18 years and over.
+ For the education analysis, adults are defined as those age 25 and older.
^ Estimates were considered statistically unreliable if the standard error was more than 30% as large as the estimate (i.e., RSE > 30%) - in this instance, estimates were statistically unreliable for Alaska and New Jersey.
References
1Centers for Disease Control and Prevention (CDC). (2020, January 2). Data on excessive drinking. Retrieved from https://www.cdc.gov/alcohol/data-stats.htm.
There is some differentiation between agencies (such as the CDC, National Institute of Alcohol Abuse and Alcoholism [NIAAA], and the National Institute of Health [NIH]) over whether binge drinking is defined as four drinks for women and five drinks for men on “one occasion” or “within a two-hour period,” but the question included in the BRFSS uses the “on one occasion” phrasing.
2 Kanny D, Naimi TS, Liu Y, Lu H, Brewer RD. (2018). Annual total binge drinks consumed by U.S. adults, 2015. Am J Prev Med, 54(4), 486-496.
Publication
Leveraging American Community Survey (ACS) Data to Address Social Determinants of Health and Advance Health Equity
 In a new issue brief for the Robert Wood Johnson Foundation’s State Health and Value Strategies, SHADAC Senior Researchers Lacey Hartman, MPP, Elizabeth Lukanen, MPH, and Colin Planalp, MPA explain how researchers and policymakers can leverage federal survey data to inform and target interventions that seek to address social determinants of health and advance health equity.
About the Issue Brief
As state Medicaid programs increasingly seek to understand and address social factors that contribute to poor health, they need data in order to identify priority areas of unmet social and economic needs, to execute SDOH initiatives, and to monitor and evaluate the impacts of these programs.
While Medicaid programs can choose to utilize data from a broad array of sources, this brief highlights several advantages to using data from one federal survey, the American Community Survey (ACS), to inform and target interventions that seek to address social determinants of health and advance health equity. The ACS contains a vast range of variables relevant to social determinants of health including but not limited to; food insecurity, unstable housing, and lack of access to social supports, and has a large sample size that supports estimates for smaller subpopulations.
This brief provides an overview of select social determinants of health measures and examples of how the data could be used to address questions and evaluate interventions related to housing, transportation, and nutrition. It also provides examples of states that use SDOH and health equity measures from the ACS, including which measures are used and what they are used for.
Access the new “Leveraging American Community Survey (ACS) Data to Address Social Determinants of Health and Advance Health Equity” brief in full to read more about how researchers can use federal-level SDOH survey data to advance health equity. Readers can also download the brief, along with a companion toolkit that includes a detailed data dictionary.
Support for this project was provided by the Robert Wood Johnson Foundation. The views expressed here do not necessarily reflect the views of the foundation.
Blog & News
BRFSS Spotlight Series: Adult Smoking and E-Cigarette Use in the United States (Infographic)
February 10, 2020:|
BRFSS SPOTLIGHT SERIES OVERVIEW |
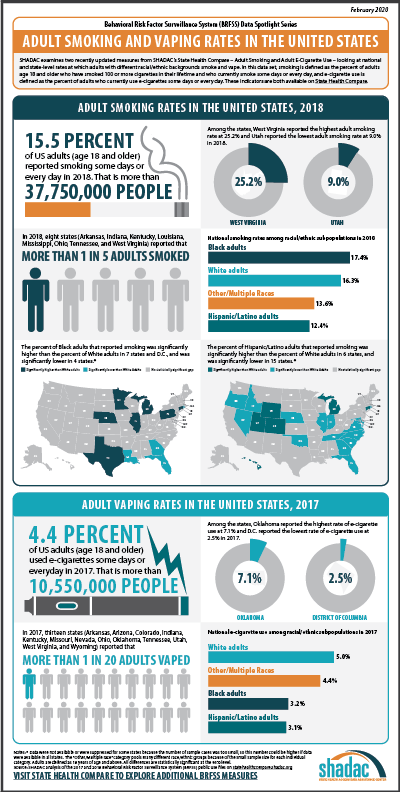
Adult Smoking and E-Cigarette Use
 In the first part of our BRFSS spotlight series, we analyzed newly available 2018 data for an existing measure, Adult Smoking, and a more complete set of existing data from 2017 (as data for 2018 was not available in a majority of states) for a brand new measure, Adult E-Cigarette Use.
According to the Centers for Disease Control and Prevention and the World Health Organization, smoking was the leading cause of preventable death in 2017, with cigarette smoking being responsible for approximately 480,000 deaths per year in the United States.1
Lately, however, concerns around growth in tobacco use have shifted away from cigarette smoking—which has declined across the nation from a rate of 20.1 percent in 2011 to 15.5 percent in 2018—in response to the rise of vaping and e-cigarette use in recent years, especially among youth.2
Though vaping/e-cigarette use is thought to be less harmful compared to regular cigarettes,3 mounting concerns about the short- and long-term effects of such use have led researchers to conduct studies such as a recent analysis conducted by scholars at the University of California, San Francisco and published in the American Journal of Preventive Medicine, which finds growing evidence linking e-cigarette use and respiratory diseases.
As researchers continue to monitor individual and population-level trends in health behaviors, such as tobacco use, data from surveys such as the BRFSS will have an important impact in increasing our understanding of the consequences of smoking and e-cigarettes.
Adult Smoking (2018)
Smoking is defined as adults (age 18 and older) who have smoked 100 or more cigarettes in their lifetime and who currently report smoking “some days” or “every day.” Nationally, 15.5 percent of adults smoked some days or every day in 2018, which decreased significantly from a reported rate of 16.4 percent the previous year. Across the states (and the District of Columbia), smoking rates varied from a low of 9.0 percent in Utah to a high of 25.2 percent in West Virginia.
Eight states (Arkansas, Indiana, Kentucky, Louisiana, Mississippi, Ohio, Tennessee, and West Virginia) reported that more than one in every five adults smoked in 2018. In better news, data from eight states (Arizona, Florida, Louisiana, Maryland, New Mexico, New York, Vermont, and Washington) showed significant declines in adult smoking rates from 2017 to 2018, and no states experienced significant increases.
Smoking Patterns by Race/Ethnicity*
When looking at 2018 data across the nation by race/ethnicity, Black adults were 6.7 percent more likely to smoke than White adults (17.4 percent vs. 16.3 percent). Correspondingly, rates of smoking were higher among Black adults than among White adults in seven states (Connecticut, Illinois, Michigan, Minnesota, Nebraska, Pennsylvania, and Texas) as well as in D.C., and were only lower than the rate of White adults in four states (Florida, Georgia, Louisiana, and Rhode Island). The gap between smoking rates of Black and White adults was highest in D.C., where Black adults were more than two times more likely than White adults to smoke (21.8 percent vs. 6.9 percent).
Nationally, Hispanic/Latino adults were 23.6 percent less likely to report smoking compared to White adults (12.4 percent vs. 16.3 percent). Rates of smoking were higher among Hispanic/Latino adults than White adults in only six states (Colorado, Connecticut, Hawaii, Michigan, Utah, and Wyoming) and were lower than White adult smoking rates in 15 states. Hawaii was highest among states with a statistically significant gap, with Hispanic/Latino adults who were 83.7 percent more likely to smoke than White adults (21.4 percent vs. 11.6 percent).
For the adult smoking measure, we also analyzed national-level data for adults of Other/Multiple races, a category that includes those who identify as American Indian or Alaska Native, Asian, Native Hawaiian/Pacific Islander, Other race, or Multiracial.+ The national data showed that, overall, Other/Multiracial adults were 16.4 percent less likely to smoke than White adults (13.6 percent vs. 16.3 percent). Of this group, American Indian or Alaska Natives were most likely to report smoking at 29.1 percent, followed by Multiracial adults (23.5 percent), Native Hawaiian/Pacific Islanders (21.8 percent), adults reporting as “Other” (16.9 percent), and Asian adults having the lowest smoking rate at 7.7 percent. A high-level state analysis also revealed that Other/Multiracial adults had the highest rates of smoking in 26 states over White adults, Black adults, and Hispanic/Latino adults.
Adult E-Cigarette Use (2017)
E-Cigarette use is the newest measure that has been added to SHADAC’s State Health Compare web tool. The measure is defined as adults who currently report using e-cigarettes either “some days” or “every day.” Due to the fact that data are not available for all states in 2018, this analysis uses 2017 data in order to give a more complete picture of trends in e-cigarette use across the nation.
Nationally in 2017, 4.4 percent of adults used e-cigarettes—a rate that was statistically unchanged from 4.5 percent in 2016. Among the states, e-cigarette use ranged from a low of 2.5 percent in D.C. to a high of 7.1 percent in Oklahoma. Thirteen states (Arkansas, Arizona, Colorado, Indiana, Kentucky, Missouri, Nevada, Ohio, Oklahoma, Tennessee, Utah, West Virginia, and Wyoming) reported an e-cigarette use rate of more than one in every twenty adults in 2017. Just one state (Indiana) saw an increase in rates of e-cigarette use, while five states (Connecticut, Louisiana, Massachusetts, Nebraska, and Washington) saw decreases in rates of e-cigarette use.
Nationally, 3.2 percent of Black adults reported using e-cigarettes in 2017, a rate that was 36.5 percent less than White adults, who had an e-cigarette use rate of 5.0 percent. Hispanic/Latino adults reported e-cigarette use at 3.1 percent, a rate that was 38.2 percent less than White adults (5.0 percent), and Other/Multiracial adults’ reported e-cigarettes use that same year was 11.4 percent less than White adults (5.0 percent) at 4.4 percent.
As e-cigarette use becomes more of public health focus, and as more state and federal surveys field questions about this topic, SHADAC will continue to monitor available data for future analysis involving state-level trends in e-cigarette use.
A brief on Adult Smoking and E-cigarette Use at the national and state levels is currently planned for release some time later this year, and will include a deeper analysis of these data.
Notes
All data are from SHADAC analysis of the Behavioral Risk Factor Surveillance System (BRFSS). All differences described in the post are statistically significant at the 95% confidence level unless otherwise specified.
* Data breakdowns by race/ethnicity for smoking rates were not available in all states due to sample size limitations.
+ The “Other/Multiple race” category pools many different race/ethnic groups because of the small sample size for each individual category.
1 Centers for Disease Control and Prevention (CDC). (2019, November 15). Smoking and tobacco use: Fast facts. Retrieved from https://www.cdc.gov/tobacco/data_statistics/fact_sheets/fast_facts/index.htm
World Health Organization (WHO). (2017, July 19). WHO report on the global tobacco epidemic, 2017. Available from https://www.who.int/tobacco/global_report/2017/en/