VISIT STATE HEALTH COMPARE
Blog & News


COVID-19 Vaccination Rates: State-level and Subpopulation Analysis of the Household Pulse Survey
April 14, 2021:Update 5: March 17 to March 29
Newly available COVID-19 vaccines promise to help protect individual Americans against infection and eventually provide population-level herd immunity. The pace of COVID-19 vaccination rollout in the United States has picked up after an unsteady start earlier in the year. The country is on track to meet the current administration’s new goal of immunizing 200 million in Biden’s first 100 days in office, despite hiccups in the rollout of the Johnson & Johnson vaccine.
The initial groups prioritized for vaccination were healthcare workers on the front lines of the pandemic and nursing facility residents, many of whom are especially vulnerable to COVID-19 infection and severe outcomes. While these and other high-priority groups continue to be first in line for vaccination slots, many states have since expanded vaccine access to the general adult population. However, there are concerns that these early prioritization decisions and the existing mechanisms of the vaccine rollout—in addition to evidence that lower-income individuals, people of color, and individuals without strong connections to the health care system are less likely to get vaccinated—have created challenges in equitably distributing the COVID-19 vaccine and could worsen existing pandemic-related health inequities.
The available data have not assuaged these concerns and show patterns of lower vaccination rates among people with lower incomes and levels of education and marginalized racial and ethnic groups. The U.S. Census Bureau recently released updated data on take-up of COVID-19 vaccines from the latest wave of its Household Pulse Survey (HPS), collected March 17 - 29, 2021.1 The HPS is an ongoing, weekly tracking survey designed to measure impacts of the COVID-19 pandemic. These data provide an updated snapshot of COVID-19 vaccination rates and are the only data source to do so at the state level by subpopulation.
This blog post presents top-level findings from the new data, focusing on rates of vaccination (one or more doses) among U.S. adults (age 18 and older) living in households and comparing the results to the most recent wave of the HPS, collected March 3 - 15, 2021.2
These data represent the last release from Phase 3 of the HPS. Data collection for Phase 3.1 will begin April 14 after a two-week break to make tweaks to questionnaire content. It is anticipated that the first results from Phase 3.1 will be released on May 5, 2021. Census has indicated that it plans to continue administering the survey through December 2021.
Almost half of U.S. adults had received one or more COVID-19 vaccinations by the end of March.
According to the new HPS data, 47.0% of U.S. adults had received one or more vaccinations by March 29th, though this varied by state from a low of 4.12% in Maryland to a high of 59.6% in Alaska. At least one in two adults had received a vaccine in ten states: Alaska, Connecticut, Hawaii, Nevada, New Mexico, New York, North Dakota, Oklahoma, South Dakota, and West Virginia.
Vaccination rates increased dramatically across nearly all states; states with lower rates catching up
Nationally, adult vaccination rates were up from the previous wave of the HPS, increasing from 34.2% during March 3 - 15, 2021, to 47.0% during March 17 - 29, 2021. Many states experienced a large increase in their vaccination rates. The size of these increases varied from a 5.7 percentage point (PP) increase in Vermont to a 20.0 PP increase in New Mexico. Twelve states saw increases of 15.0 PP or larger.
Percent of Adults Who Had Received a COVID-19 Vaccine

Disparities in vaccination rates improved, but slowly and unevenly
COVID-19 vaccination rates continued to vary to a great degree by demographic and socioeconomic factors. Gaps in vaccination compared to the national average narrowed slightly for most groups, though some groups saw larger improvements. As with prior weeks, vaccination rates were lower for certain subpopulations such as Hispanic/Latino adults, Black adults, and Other/Multiracial adults, and these rates were particularly low for very-low-income adults and for adults without a high school education. More resources, increased attention, or new strategies may be needed to close the gaps for the hardest-to-reach groups.
By race and ethnicity, Asian and white adults continued to have above-average vaccination rates at 51.4% and 50.1%, respectively. Rates among Black adults (42.0%), adults identifying with “Multiple” or “Some Other” race (40.0%), and Hispanic/Latino adults (37.7%) continued to be below the national average. However, vaccination rates among Black adults, “Multiple” or “Some Other” race adults, and Hispanic/Latino adults all improved somewhat relative to the national average.
Hispanic/Latino adults had the largest relative improvement, going from 26 percent below the national average in the first half of March (25.4% vs. 34.2%) to 20 percent below the national average in the second half of March (37.7% vs. 47.0%). This was a marked improvement after consistently being 25 to 30 percent below the national average with every bi-weekly release since the beginning of January.
Percent of Adults Who Had Received a COVID-19 Vaccine by Race/Ethnicity

Gaps in vaccination rates among income levels have continued to narrow, however, Adults with household incomes below $50,000 are still falling below the national average, whereas adults with household incomes above $50,000 remain higher than the national average. Vaccination rates among adults with incomes less than $35,000 continued to improve compared to the national average. This improvement was especially large among adults with incomes between $25,000 and $34,999, going from 22 percent below the national average in the first half of March (26.7% vs. 34.2%) to just 6 percent below the national average in the second half of March (46.6% vs. 47.0%).
Percent of Adults Who Had Received a COVID-19 Vaccine by Income

Disparities by level of education remained, with adults that hold a bachelor’s degree or higher continuing to have the highest vaccination rate at 59.9% and adults without a high school diploma having the lowest vaccination rates at 29.0%. Disparities by education did narrow somewhat relative to the national average, especially for adults with a high school education or equivalent and adults with less than a high school level of education. However, adults with less than a high school level of education continued to have the lowest rates of vaccination of any of the groups analyzed here.
Percent of Adults Who Had Received a COVID-19 Vaccine by Education

Nationally, More than four in five older adults had received a COVID-19 vaccine
Nationally, 80.1% of older adults (age 65 and older) had received at least one dose of the COVID-19 vaccine, which was 33.1 PP higher than the rate among all adults (47.0%). Vaccination rates for older adults ranged from a low of 67.4% in Hawaii to a high of 90.1% in Connecticut. Hawaii was the only state to have a 65+ vaccination rate of below 70 percent.
As may be expected given the high rates of vaccination in the older adult population, rates of increase in vaccination in this group slowed somewhat in the last half of March. No state increased its 65+ vaccination rate by more than 0.43x (Oregon), whereas ten states were able to increase vaccination rates by 0.5x or more in the first half of the month. Though the 65+ vaccination rates in Alaska appeared to have fallen in the second half of March, this was more than likely a statistical artifact rather than an actual decrease.
Percent of Adults Age 65+ Who Had Received a COVID-19 Vaccine

Notes about the Household Pulse Survey Data
The estimated rates presented in this post were calculated from the count estimates published by the Census Bureau. Though these counts are accompanied by standard errors, standard errors are not able to be accurately calculated for rate estimates. Therefore, we are not able to determine if the differences we found in our analysis are statistically significant or if the estimates themselves are statistically reliable. Estimates and differences for subpopulations at the state level should be assumed to have large confidence intervals around them and caution should be taken when drawing strong conclusions from this analysis. However, the fact that these early indications of COVID-19 inequities mirror patterns of other vaccinations inequities demonstrate reason for concern.
Though produced by the U.S. Census Bureau, the HPS is considered an “experimental” survey and does not necessarily meet the Census’ high standards for data quality and statistical reliability. For example, the survey has relatively low response rates (7.2% for March 17 - 29), and sampled individuals are contacted via email and text message, asking them to complete an internet-based survey. These issues in particular could be potential sources of bias but come with the tradeoffs of increased speed and flexibility in data collection as well as lower costs. A future post will investigate differences between COVID-19 vaccination rates estimated from survey data (such as the HPS) and administrative sources. The estimates presented in this post are based on responses from 77,104 adults. More information about the data and methods for the Household Pulse Survey can be found in a previous SHADAC blog post.
Previous Blogs in this Series
COVID-19 Vaccination Rates: State-level and Subpopulation Evidence from the Household Pulse Survey (Update 4: 3/3 - 3/15) (SHADAC Blog)
COVID-19 Vaccination Rates: State-level and Subpopulation Evidence from the Household Pulse Survey (Update 3: 2/17 - 3/1) (SHADAC Blog)
COVID-19 Vaccination Rates: State-level and Subpopulation Evidence from the Household Pulse Survey (Update 2: 2/3 - 2/15) (SHADAC Blog)
COVID-19 Vaccination Rates: State-level and Subpopulation Evidence from the Household Pulse Survey (Update: 1/10 - 2/1) (SHADAC Blog)
COVID-19 Vaccination Rates: New State-level and Subpopulation Evidence from the Household Pulse Survey (1/6 - 1/18) (SHADAC Blog)
Related Reading
State-level Flu Vaccination Rates among Key Population Subgroups (50-state profiles) (SHADAC Infographics)
50-State Infographics: A State-level Look at Flu Vaccination Rates among Key Population Subgroups (SHADAC Blog)
Anticipating COVID-19 Vaccination Challenges through Flu Vaccination Patterns (SHADAC Brief)
New Brief Examines Flu Vaccine Patterns as a Proxy for COVID – Anticipating and Addressing Coronavirus Vaccination Campaign Challenges at the National and State Level (SHADAC Blog)
Ensuring Equity: State Strategies for Monitoring COVID-19 Vaccination Rates by Race and Other Priority Populations (Expert Perspective for State Health & Value Strategies)
SHADAC Webinar - Anticipating COVID-19 Vaccination Challenges through Flu Vaccination Patterns (February 4th) (SHADAC Webinar)
Blog & News

Two New and Four Updated Measures are Now Available on SHADAC’s State Health Compare
April 9, 2021: Estimates for six measures on SHADAC’s State Health Compare web tool have recently been updated with new data or added as new measures. Data for each of these measures is drawn from a variety of different data sources.
New measures include:
Alcohol-Involved Deaths
Alcohol-Involved Deaths is a new measure to State Health Compare and measures state-level rates of deaths that were determined to be “alcohol-induced,” as defined by the Centers for Disease Control (CDC). These include deaths from conditions such as alcohol poisoning and alcoholic liver disease that CDC considers to be entirely alcohol-attributable. Data are available for years 1999 through 2019.
Adult Flu Vaccinations
Adult Flu Vaccinations is a new measure to State Health Compare and measures the percent of adults (age 18 and older) who received a flu vaccine in the past 12 months. The measure allows data users to compare national and state-level flu vaccination rates by breakdowns such as age, chronic disease status, health insurance coverage, educational attainment, household income, metropolitan status, personal doctor status, race/ethnicity, and sex. Data are available as an annual average for the time period 2017–2019.
Updated measures include:
Health Insurance Coverage by Type
Health Insurance Coverage by Type measures the percent of the population with health insurance coverage by type of coverage: private, public, insured, employer, individual, Medicaid/CHIP, and Medicare, in addition to uninsured. This measure allows data users to compare national and state-level rates of different types of health insurance coverage by numerous breakdowns, including age, citizenship, disability status, education, family income, health status, limited English proficiency, marital status, poverty level, race/ethnicity, sex, and work status. Data are available for most breakdowns for 2008 through 2019.
Premature Death
Premature Death measures the average number of years of potential life lost prior to age 75 per 100,000 persons. In addition to viewing this measure for the entire state population, data users can compare rates of premature death by race and ethnicity. Data are available for this measure for years 2000 through 2019.
Adverse Childhood Experiences
Adverse Childhood Experiences measures the percent of children (age 0–17) residing in households who had experienced no, one, or two or more adverse childhood experiences (ACEs) out of a possible nine ACEs ([1] hard to cover basics on family's income; [2] parent or guardian divorced or separated; [3] parent or guardian died; [4] parent or guardian served time in jail; [5] saw or heard parents or adults slap, hit, kick, punch one another in the home; [6] was a victim of violence or witnessed violence in neighborhood; [7] lived with anyone who was mentally ill, suicidal, or severely depressed; [8] lived with anyone who had a problem with alcohol or drugs; and [9] treated or judged unfairly due to race/ethnicity). Data users can compare national and state-level rates of ACEs by breakdowns such as age, health insurance coverage type, parental education, poverty level, and race/ethnicity. Data are available for the two-year pooled periods 2016–2017, 2017–2018, and 2018–2019.
Unemployment Rate
Unemployment Rate measures the average annual percent of the civilian labor force (age 16 and older) that was unemployed. Individuals are defined as unemployed if they do not have a job, have actively looked for work in the prior four weeks, and are currently available for work. Data are available by total and race/ethnicity. Data are available for years 2000 through 2020 for total; 2020 data by race/ethnicity are forthcoming.
Notes
Estimates for Health Insurance Coverage by Type are produced using microdata from the American Community Survey and the Current Population Survey. Data for Alcohol-Involved Deaths come from the CDC WONDER system. Data for Premature Death come from the CDC WISQARS system. Estimates for Adult Flu Vaccines are produced using microdata from the Behavioral Risk Factor Surveillance System survey. Estimates for Adverse Childhood Experiences are produced using microdata from the National Survey of Children’s Health. Data for Unemployment Rate come from the U.S. Bureau of Labor Statistics’ Local Area Unemployment Statistics program.
Click here to explore these measures on State Health Compare!
Blog & News
COVID-19 Vaccination Rates: State-level and Subpopulation Evidence from the Household Pulse Survey - Update 4
March 25, 2021:Update 4: March 3 to March 15
Newly available COVID-19 vaccines promise to help protect individual Americans against infection and eventually provide population-level herd immunity. The pace of COVID-19 vaccination rollout in the United States has picked up after an unsteady rollout earlier in the year. The country has met the current administration’s goal of administering 100 million COVID-19 vaccines sooner than expected, and further increases in supply are on the horizon as newly authorized Johnson & Johnson vaccines are anticipated to be available in the coming weeks.
The initial groups prioritized for vaccination were health care workers on the front lines of the pandemic and nursing facility residents, many of whom are especially vulnerable to COVID-19 infection and severe outcomes. While these groups continue to hold priority in vaccination slots, many states have since expanded vaccine access to other (still high-priority) segments of the general population. Additionally, a growing number of states have now expanded eligibility to all adults. However, there are concerns that these prioritization decisions and the existing mechanisms of the vaccine rollout—in addition to evidence that lower-income individuals, people of color, and individuals without strong connections to the health care system are less likely to get vaccinated—are inadequate to narrow the clear disparities in the distribution of the COVID-19 vaccine and could worsen existing pandemic-related health inequities.
The available data have not assuaged these concerns, and show patterns of lower vaccination rates among people with lower incomes and levels of education, and marginalized racial and ethnic groups. The U.S. Census Bureau recently released updated data on take-up of COVID-19 vaccines from the most recent wave of its Household Pulse Survey (HPS), collected March 3 - 15, 2021.1 The HPS is an ongoing, weekly tracking survey designed to measure the impacts of the COVID-19 pandemic. These data provide an updated snapshot of COVID-19 vaccination rates and are the only data source to do so at the state level by subpopulation.
This blog presents top-level findings from these new data, focusing on rates of vaccination (one or more doses) among U.S. adults (age 18 and older) living in households and how these findings compare to results from the most recent wave of the HPS, collected February 17 - March 1, 2021.2
The current phase of the HPS is slated to continue data collection through the end of March 2021, after which time the survey may be out of the field while changes are made to questionnaire content before returning in April. Census has indicated that it plans to continue administering the survey through December 2021.
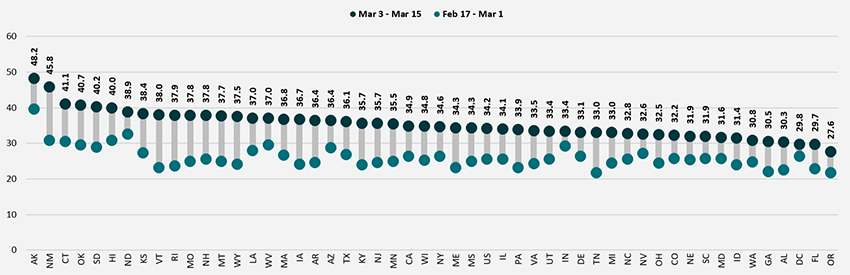
Nationally, more than one in three adults received a vaccination, but this varied by state
According to the new HPS data, 34.2% of U.S. adults had received one or more COVID-19 vaccinations by the end of the second week in March, though this varied by state from a low of 27.6% in Oregon to a high of 48.2% in Alaska. At least four in ten adults had received a vaccine in six states: Alaska, Connecticut, Hawaii, Oklahoma, and South Dakota.
Vaccination rates increased substantially across nearly all states; states with lower rates catching up
Nationally, adult vaccination rates were up from the previous wave of the HPS, increasing from 25.5% during February 17–March 1, 2021, to 34.2% during March 3–15, 2021. Every state experienced an increase in their vaccination rates, though the size of these increases varied from a 3.5 percentage point (PP) change in the District of Columbia to a 15.0 PP in New Mexico.
Percent of Adults Who Had Received a COVID-19 Vaccine
Disparities in vaccination rates improved, but slowly and unevenly
COVID-19 vaccination rates continued to vary to a great degree by demographic and socioeconomic factors. Gaps between most groups and the national average were largely unchanged from previous weeks, though some groups did see improvements. As with prior weeks, vaccination rates were lower for certain subpopulations such as Hispanic/Latino adults, Black adults, and Other/Multiracial adults, low-income adults, and for adults without a high school education. More resources and attention may be needed to close the gaps for the hardest-to-reach groups.
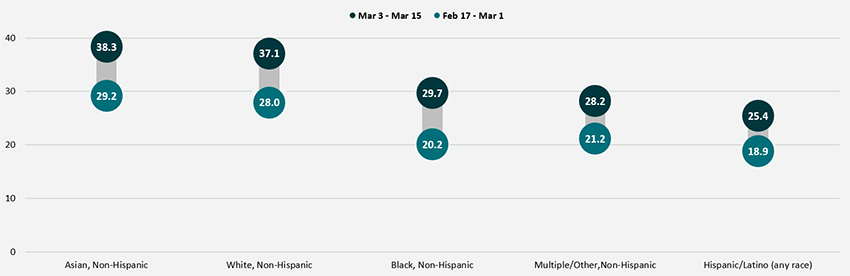
By race and ethnicity, Asian and White adults continued to have above-average vaccination rates at 38.3% and 37.1%, respectively. Rates among Black adults (29.7%), adults identifying with “Multiple” or “Some Other” race (28.2%), and Hispanic/Latino adults (25.4%) continued to be below the national average. However, vaccination rates among Black adults did improve somewhat relative to the national average, going from 21 percent below the national average (20.2% vs. 25.5%) in the second half of February to 13 percent below the national average (29.7% vs. 34.2%) in the first half of March.
Percent of Adults Who Had Received a COVID-19 Vaccine by Race/Ethnicity
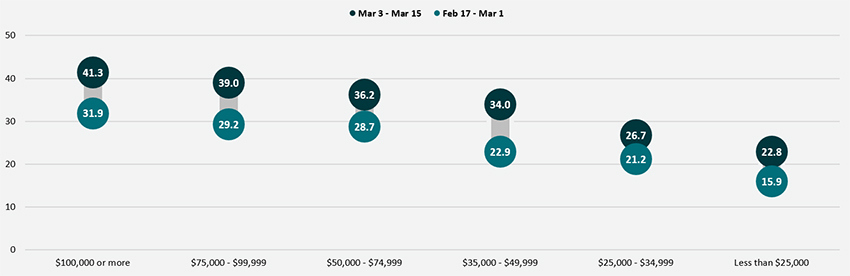
Disparities in vaccination rates by income continued to narrow, though progress was very slow and uneven across income groups. Adults with household incomes below $50,000 continued to have vaccination rates below the national average, whereas adults with household incomes above $50,000 had vaccination rates higher than the national average. However, the size of the gaps between the highest income and lowest income groups narrowed somewhat. Whereas in the second half of February adults with household incomes of $100,000 or higher had vaccination rates nearly 2.0x those of adults with incomes less than $25,000, that gap had narrowed slightly to 1.8x in the first half of March.
Percent of Adults Who Had Received a COVID-19 Vaccine by Income
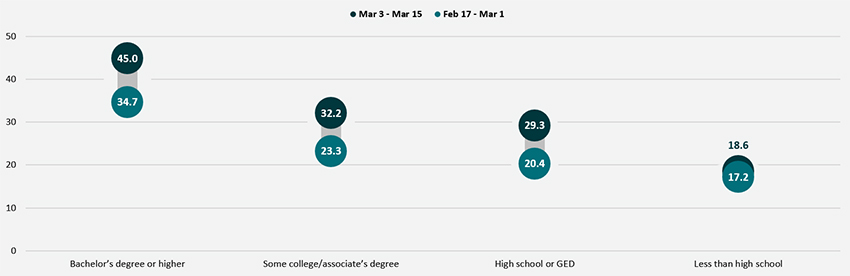
Disparities by level of education remained, with adults holding a bachelor’s degree or higher continuing to have the highest vaccination rate at 45.0%, and adults without a high school diploma having the lowest vaccination rates at 18.6%. Though adults with some college or an associate’s degree and adults with a high school degree or equivalent saw solid growth in their vaccination rates, almost no progress was made among adults without a high school diploma or equivalent. The gap between that group and the national average widened in the first half of March to 46 percent below the national average (18.6% vs. 34.2%) from 32 percent below the national average (17.2% vs. 25.5%) in the second half of February.
Percent of Adults Who Had Received a COVID-19 Vaccine by Education
Nationally, More than two-thirds of older adults received a COVID-19 vaccine and many states continued to make considerable progress in vaccinating older adults
Nationally, 69.7% of older adults (age 65 and older) had received at least one dose of the COVID-19 vaccine, which was 35.5 percentage points higher than the rate among all adults (34.2%). Vaccination rates for older adults ranged from a low of 52.3% in Oregon to a high of 84.4% in South Dakota. Older adult vaccination rates were below 60% in just four states (Alabama, Hawaii, New Jersey and Oregon) and at or above 75% in ten states (Alaska, Colorado, Connecticut, Indiana, Minnesota, North Dakota, Oklahoma, South Dakota, Utah and Wisconsin).
As in the previous period, states continued to make good progress in increasing rates of vaccinations among older adults. Compared to the second half of February, 10 states increased their age 65+ vaccination rates by at least 0.5x, with Vermont more than doubling its vaccination rate for adults age 65+. Only a handful of states failed to make substantial progress in increasing vaccination rates among older adults. Though the 65+ vaccination rates in Louisiana and the District of Columbia appeared to have fallen in the first half of March, this was more than likely a statistical artifact rather than an actual decrease.
Percent of Adults Age 65+ Who Had Received a COVID-19 Vaccine

Notes about the Household Pulse Survey Data
The estimated rates presented in this post were calculated from the count estimates published by the Census Bureau. Though these counts are accompanied by standard errors, standard errors are not able to be accurately calculated for rate estimates. Therefore, we are not able to determine if the differences we found in our analysis are statistically significant or if the estimates themselves are statistically reliable. Estimates and differences for subpopulations at the state level should be assumed to have large confidence intervals around them and caution should be taken when drawing strong conclusions from this analysis. However, the fact that these early indications of COVID-19 inequities mirror patterns of other vaccinations inequities demonstrate reason for concern.
Though produced by the U.S. Census Bureau, the HPS is considered an “experimental” survey and does not necessarily meet the Census’s high standards for data quality and statistical reliability. For example, the survey has relatively low response rates (7.4% for March 3 - 15), and sampled individuals are contacted via email and text message, asking them to complete an internet-based survey. These issues in particular could be potential sources of bias but come with the tradeoffs of increased speed and flexibility in data collection as well as lower costs. A future post will investigate differences between COVID-19 vaccination rates estimated from survey data (such as the HPS) and administrative sources. The estimates presented in this post are based on responses from 78,306 adults. More information about the data and methods for the Household Pulse Survey can be found in a previous SHADAC blog post.
Previous Blogs in this Series
COVID-19 Vaccination Rates: State-level and Subpopulation Evidence from the Household Pulse Survey (Update 3: 2/17 - 3/1) (SHADAC Blog)
COVID-19 Vaccination Rates: State-level and Subpopulation Evidence from the Household Pulse Survey (Update 2: 2/3 - 2/15) (SHADAC Blog)
COVID-19 Vaccination Rates: State-level and Subpopulation Evidence from the Household Pulse Survey (Update: 1/10 - 2/1) (SHADAC Blog)
COVID-19 Vaccination Rates: New State-level and Subpopulation Evidence from the Household Pulse Survey (1/6 - 1/18) (SHADAC Blog)
Related Reading
State-level Flu Vaccination Rates among Key Population Subgroups (50-state profiles) (SHADAC Infographics)
50-State Infographics: A State-level Look at Flu Vaccination Rates among Key Population Subgroups (SHADAC Blog)
Anticipating COVID-19 Vaccination Challenges through Flu Vaccination Patterns (SHADAC Brief)
New Brief Examines Flu Vaccine Patterns as a Proxy for COVID – Anticipating and Addressing Coronavirus Vaccination Campaign Challenges at the National and State Level (SHADAC Blog)
Ensuring Equity: State Strategies for Monitoring COVID-19 Vaccination Rates by Race and Other Priority Populations (Expert Perspective for State Health & Value Strategies)
SHADAC Webinar - Anticipating COVID-19 Vaccination Challenges through Flu Vaccination Patterns (February 4th) (SHADAC Webinar)
Blog & News
COVID-19 Vaccination Rates: State-level and Subpopulation Evidence from the Household Pulse Survey - Update 3
March 12, 2021:Update 3: Feb 17 to Mar 1
Newly available COVID-19 vaccines promise to help protect individual Americans against infection and eventually provide population-level herd immunity. The pace of COVID-19 vaccination rollout in the United States has been somewhat unsteady, with a sizeable share of ups and downs from week to week—reports of slow early going were followed by states’ responsive attempts to pick up the pace in following period, only to be hampered by storms across the southern region interfering with supply. However, signs of vaccination progress have resumed, with the recent approval and release of the one-dose Johnson & Johnson vaccine, manufacturers ramping up vaccine production, and achieving the benchmark of 100 million COVID vaccination shots administered to Americans far earlier than anticipated.
The initial groups prioritized for vaccination were health care workers on the front lines of the pandemic and nursing facility residents, many of whom are especially vulnerable to COVID-19 infection and severe outcomes. While these groups continue to hold priority in vaccination slots, many states have since expanded vaccine access to other (still high-priority) segments of the general population such as older adults, K-12 and child care workers, essential workers, and those with high-risk medical conditions, with further vaccine eligibility expansion guidelines potentially coming soon. However, there are concerns that these prioritization decisions and the existing mechanisms of the vaccine rollout—in addition to evidence that lower-income individuals, people of color, and individuals without strong connections to the health care system are less likely to get vaccinated—are inadequate to narrow the clear disparities in the vaccine rollout so far and could worsen existing pandemic-related health inequities.
The available data have not assuaged these concerns, and show patterns of lower vaccination rates among people with lower incomes and levels of education, and marginalized racial and ethnic groups. The U.S. Census Bureau recently released updated data on take-up of COVID-19 vaccines from the most recent wave of its Household Pulse Survey (HPS), collected February 17-March 1, 2021.1 The HPS is an ongoing, weekly tracking survey designed to measure impacts of the COVID-19 pandemic. These data provide an updated snapshot of COVID-19 vaccination rates and are the only data source to do so at the state level by subpopulation.
This blog post presents top-level findings from these new data, focusing on rates of vaccination (one or more doses) among U.S. adults (age 18 and older) living in households and comparing to results from the most recent wave of the HPS, collected February 3-15, 2021.2 As of publication, no HPS data collection past March 1 has been announced, so this may be the final post in this series. SHADAC will continue to monitor any further data collection announcements related to the HPS and will update our readers accordingly.
More than one in four adults received a vaccination, but this varied by state
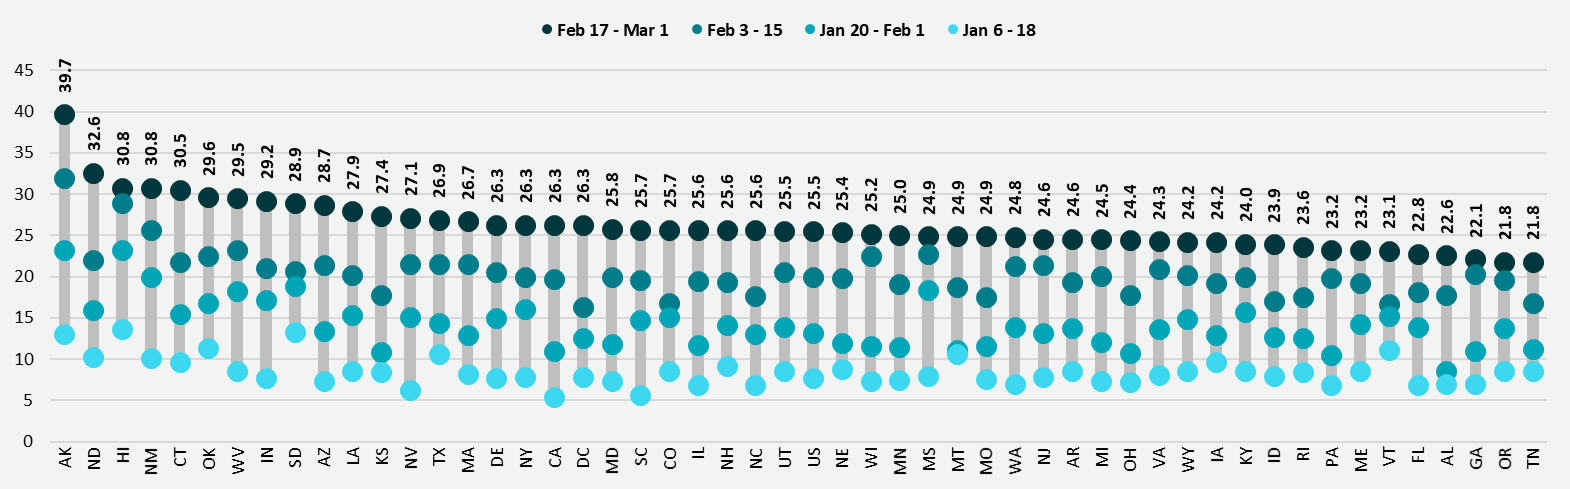
According to the new HPS data, 25.5% of U.S. adults had received one or more COVID-19 vaccinations during this two-week period in the second half of February, though this varied by state from a low of 21.8% in Tennessee to a high of 39.7% in Alaska. More than three in ten adults had received a vaccine in five states: Alaska, Connecticut, Hawaii, New Mexico, and North Dakota.
Vaccination rates increased substantially across nearly all states; states with lower rates catching up
Nationally, adult vaccination rates were up from the previous wave of the HPS, increasing from 19.9% during February 3-15, 2021, to 25.5% during February 17-March 1, 2021. Most states also experienced increases in their vaccination rates, though again the size of these increases varied across the states, from an increase of 1.8 percentage points (PP) in Georgia to an increase of 10.6 PP in North Dakota.
Percent of Adults Who Had Received a COVID-19 Vaccine
Disparities in vaccination rates have not improved
COVID vaccination rates continued to vary to a great degree by demographic and socioeconomic factors, and disparities were largely unchanged from previous weeks. There has been little progress in getting more vaccines to certain groups such as low-income, Hispanic, and Black adults, for instance, and new vaccination strategies and greater emphasis on equity may be needed to close the gaps for the hardest-to-reach groups.
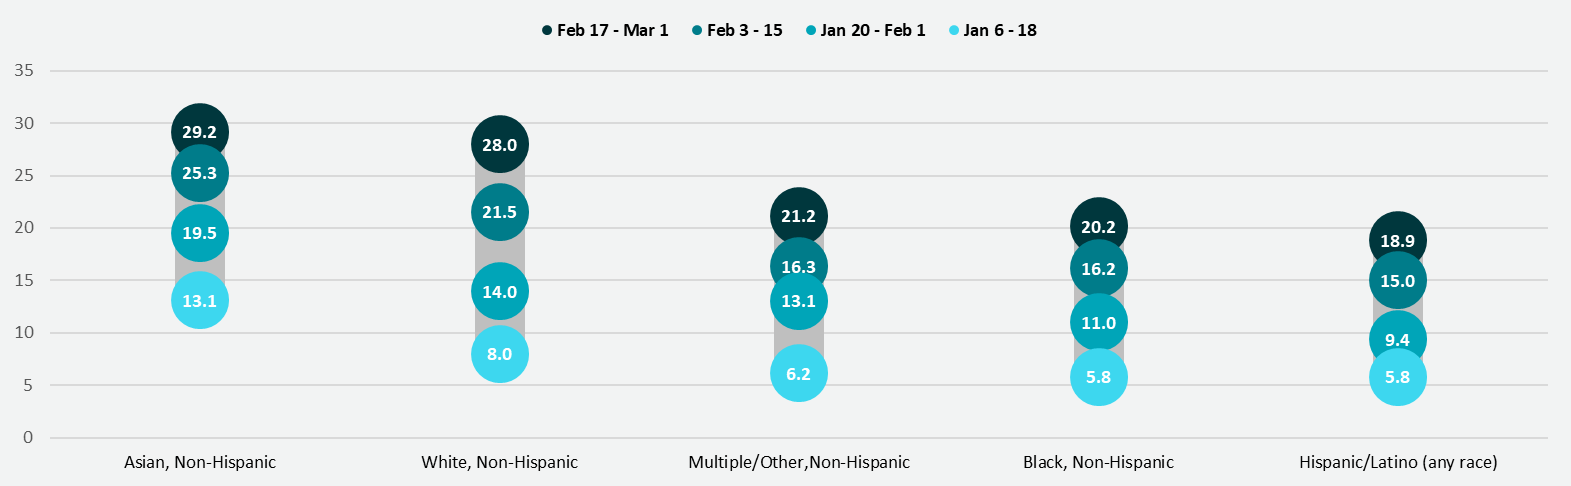
By race and ethnicity, non-Hispanic Asian and non-Hispanic White adults continued to have above-average vaccination rates at 29.2% and 28.0%, respectively. Rates among non-Hispanic adults identifying with “Multiple” races or “Some other” race (21.2%), non-Hispanic Black adults (20.2%), and Hispanic/Latino adults of any race (18.9%) remained below the national average.
Percent of Adults Who Had Received a COVID-19 Vaccine by Race/Ethnicity
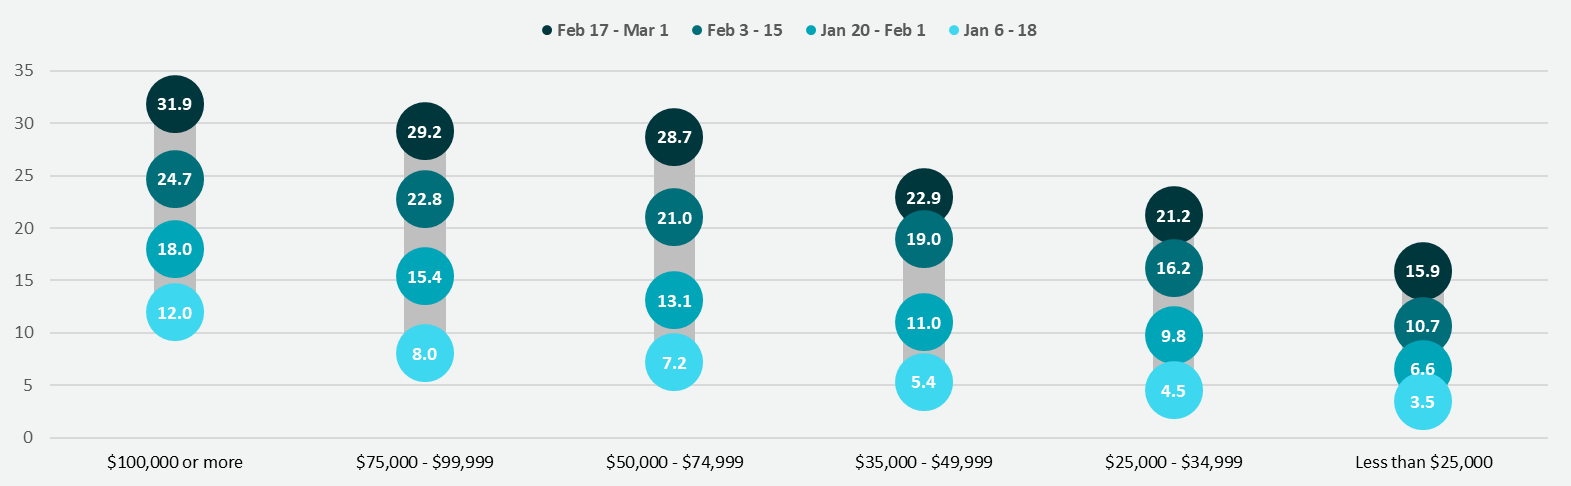
Disparities in vaccination rates by income, which had narrowed somewhat in previous weeks, were relatively unchanged from earlier in February. Adults with household incomes below $50,000 continued to have vaccination rates below the national average, whereas adults with household incomes above $50,000 had vaccination rates higher than the national average. These gaps failed to appreciably improve. The gap between the lowest income adults (household incomes of less than $25,000) and the national average was especially large, with low-income adults being 9.6 PP less likely to have received a vaccine than all adults (15.9% vs. 25.5%).
Percent of Adults Who Had Received a COVID-19 Vaccine by Income
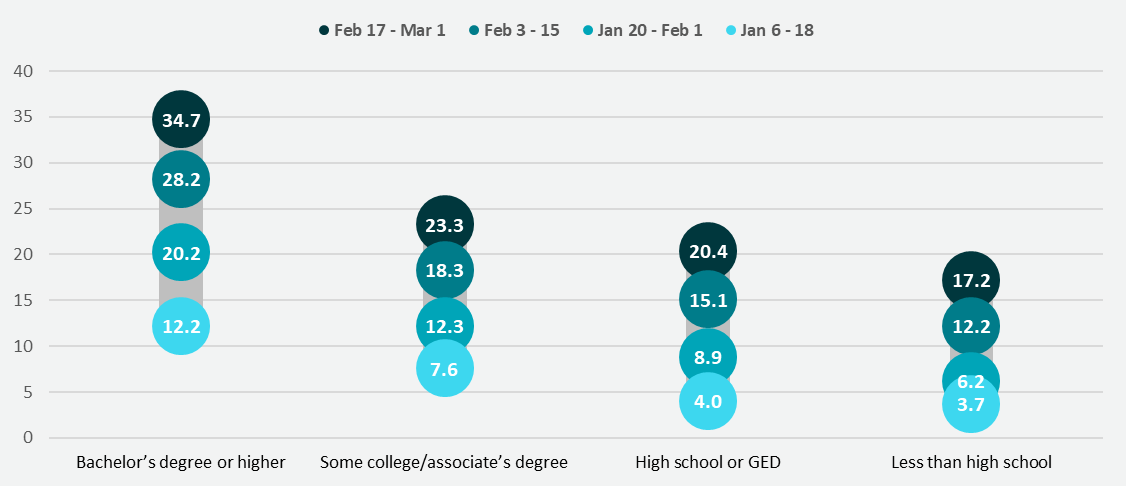
Disparities by level of education remained, with adults holding a bachelor’s degree or higher continuing to have the highest vaccination rate at 34.7%, and adults without a high school diploma having the lowest vaccination rates at 17.2%. However, disparities by education did narrow slightly, and vaccination rates among both adults with a high school diploma or equivalent and adults with less than a high school education increased somewhat faster than the overall adult rate.
Percent of Adults Who Had Received a COVID-19 Vaccine by Education
More than half of older adults received a COVID vaccine as the U.S., and many states, continued to make large progress in vaccinating older adults
Nationally, 54.6% of older adults (age 65 and older) had received at least one dose of the COVID-19 vaccine, which was 29.1 percentage points higher than the rate among all adults (25.5%). Vaccination rates for older adults ranged from 27.0% in Oregon to 73.3% in Louisiana. Older adult vaccination rates were below 40% in six states (Hawaii, New Jersey, Oregon, Pennsylvania, Vermont, and Virginia) and at or above 70% in four states (Alaska, California, Indiana, and Louisiana) as well as in the District of Columbia (D.C.)
Percent of Adults Age 65+ Who Had Received a COVID-19 Vaccine

As in the previous period, states continued to make good progress in rates of vaccination among older adults. Compared to the first half of February, 23 states increased their age 65+ vaccination rates by at least 0.5x, and two states (Rhode Island and Connecticut) more than doubled their 65+ vaccination rates. Only a handful of states failed to make substantial progress in increasing vaccination rates among older adults.
Notes about the Household Pulse Survey Data
The estimated rates presented in this post were calculated from the count estimates published by the Census Bureau. Though these counts are accompanied by standard errors, standard errors are not able to be accurately calculated for rate estimates. Therefore, we are not able to determine if the differences we found in our analysis are statistically significant or if the estimates themselves are statistically reliable. Estimates and differences for subpopulations at the state level should be assumed to have large confidence intervals around them and caution should be taken when drawing strong conclusions from this analysis. However, the fact that patterns of inequities in other vaccination rates are mirrored by these early indications of COVID-19 vaccination inequities demonstrates reason for concern.
Though produced by the U.S. Census Bureau, the HPS is considered an “experimental” survey and does not necessarily meet the Census’s high standards for data quality and statistical reliability. For example, the survey has relatively low response rates (7.3% for February 17 - March 1), and sampled individuals are contacted via email and text message, asking them to complete an internet-based survey. These issues in particular could be potential sources of bias, but come with the tradeoffs of increased speed and flexibility in data collection as well as lower costs. A future post will investigate differences between COVID vaccination rates estimated from survey data (such as the HPS) and administrative sources. The estimates presented this post are based on responses from 77,788 adults. More information about the data and methods for the Household Pulse Survey can be found in a previous SHADAC blog post.
Previous Blogs in the Series
COVID-19 Vaccination Rates: State-level and Subpopulation Evidence from the Household Pulse Survey (Update 2: Feb 3 to Feb 15)
COVID-19 Vaccination Rates: State-level and Subpopulation Evidence from the Household Pulse Survey (Update: Jan 20 to Feb 1)
COVID-19 Vaccination Rates: State-level and Subpopulation Evidence from the Household Pulse Survey (Jan 6 to Jan 18)
Related Reading
State-level Flu Vaccination Rates among Key Population Subgroups (50-state profiles) (SHADAC Infographics)
50-State Infographics: A State-level Look at Flu Vaccination Rates among Key Population Subgroups (SHADAC Blog)
Anticipating COVID-19 Vaccination Challenges through Flu Vaccination Patterns (SHADAC Brief)
New Brief Examines Flu Vaccine Patterns as a Proxy for COVID – Anticipating and Addressing Coronavirus Vaccination Campaign Challenges at the National and State Level (SHADAC Blog)
Ensuring Equity: State Strategies for Monitoring COVID-19 Vaccination Rates by Race and Other Priority Populations (Expert Perspective for State Health & Value Strategies)
SHADAC Webinar - Anticipating COVID-19 Vaccination Challenges through Flu Vaccination Patterns (February 4th) (SHADAC Webinar)
[1] The estimates presented here represent an average of this time period.
[2] It is important to mention that the HPS does not collect data for institutionalized adults, such as those living in nursing facilities, or in correctional facilities such as prisons or jails.
Blog & News
COVID-19 Vaccination Rates: State-level and Subpopulation Evidence from the Household Pulse Survey (Update 2: Feb 3 to Feb 15)
February 25, 2021:Newly available COVID-19 vaccines promise to help protect individual Americans against infection and eventually provide population-level herd immunity. The pace of the COVID-19 vaccination rollout in the United States has been somewhat erratic—with reports of slow early going before picking up somewhat in following weeks, only to be hampered by recent storms across the southern region. However, signs of vaccination progress are appearing on the horizon once again, with manufacturers ramping up production, shipping getting back on track after the recent roadblocks, and early positive news from the FDA regarding Johnson & Johnson’s single-shot vaccine. The initial groups prioritized for vaccination were health care workers on the front lines of the pandemic and nursing facility residents, many of whom are especially vulnerable to COVID-19 infection and severe outcomes.
While these groups continue to hold priority in vaccination slots, many states have expanded vaccine access to other (still high-priority) segments of the general population such as older adults, K-12 and child care workers, essential workers, and those with high-risk medical conditions. However, there are concerns that these prioritization decisions and the existing mechanisms of the vaccine rollout—in addition to evidence that lower-income individuals, people of color, and individuals without strong connections to the health care system are less likely to get vaccinated—are inadequate to narrow the clear disparities in the vaccine rollout so far and could worsen existing pandemic-related health inequities.
The available data have not assuaged these concerns, and show patterns of lower vaccination rates among people with lower incomes and levels of education, and marginalized racial and ethnic groups. The U.S. Census Bureau recently released updated data on take-up of COVID-19 vaccines from the most recent wave of its Household Pulse Survey (HPS), collected February 3-15, 2021.1 The HPS is an ongoing, weekly tracking survey designed to measure impacts of the COVID-19 pandemic. These data provide an updated snapshot of COVID-19 vaccination rates and are the only data source to do so at the state level by subpopulation. This blog post presents top-level findings from these new data, focusing on rates of vaccination (one or more doses) among U.S. adults (age 18 and older) living in households and comparing to results from the most recent wave of the HPS, collected January 20-February 1, 2021.2
Nearly one in five adults had received a vaccination, but this varied by state
According to the new HPS data, 19.9% of U.S. adults had received one or more COVID-19 vaccinations during this two-week period in the first half of February, though this varied by state from a low of 16.3% in the District of Columbia (D.C.) to a high of 31.9% in Alaska. More than one in four adults had received a vaccine in three states: Alaska, Hawaii, and New Mexico.
Vaccination rates increased substantially across nearly all states; states with lower rates catching up
Nationally, adult vaccination rates were up from the previous wave of the HPS, increasing from 13.2% during January 20-February 1, 2021, to 19.9% during February 3-15, 2021. Most states also experienced increases in their vaccination rates, though again the size of these increases varied across the states, from an increase of 1.5 percentage points (PP) in Vermont to an increase of 10.9 PP in Wisconsin.
Percent of Adults Who Had Received a COVID-19 Vaccine

States that had previously had below-average vaccination rates caught up somewhat to the higher-performing states. The states that were below the national average in late January, such as California and Wisconsin, saw larger increases in their vaccination rates compared with the states that were above the national average in late January, so that by the middle of February, vaccination rates were somewhat more even across the states, with most states hovering just above or below 20% of their adult populations vaccinated.
Disparities in vaccination rates remain largely unchanged
COVID vaccination rates continued to vary to a great degree by demographic and socioeconomic factors, though disparities narrowed slightly from previous weeks. This narrowing could be due to the expansion of priority groups to include a broader share of the population over this period; however, progress has remained limited in getting vaccines to certain groups such as low-income, Hispanic, and Black adults, for instance, and new vaccination strategies may be needed to reach the hardest-to-reach groups such as these.
By race and ethnicity, non-Hispanic Asian and non-Hispanic White adults continued to have above-average vaccination rates at 25.3% and 21.5%, respectively. Vaccination rates among non-Hispanic adults identifying with “Multiple” races or “Some other” race, which had previously increased relative to the average, fell behind pace and rose to just 16.3%, below the national average of 19.9%. Rates among non-Hispanic Black adults (16.2%) and Hispanic/Latino adults of any race (15.0%) remained below the national average.
Percent of Adults Who Had Received a COVID-19 Vaccine by Race/Ethnicity

Disparities in vaccination rates by income continued to narrow, though rates among those with the lowest incomes remained far below the average. Adults with household incomes of less than $25,000 were nearly half as likely to have received a vaccine compared with all adults (10.7% vs. 19.9%). This gap was largely unchanged from previous weeks, even as the gap between other lower-income groups and the average steadily narrowed from early January.
Percent of Adults Who Had Received a COVID-19 Vaccine by Income

Disparities by level of education remained, with adults holding a bachelor’s degree or higher continued to have the highest vaccination rate at 28.2%, and adults without a high school diploma having the lowest vaccination rates at 12.2%. However, disparities by education did narrow somewhat, and vaccination rates among both adults with a high school diploma or equivalent and adults with less than a high school education increased faster than the overall adult rate.
Percent of Adults Who Had Received a COVID-19 Vaccine by Education

Nearly 2 in 5 older adults received a COVID vaccine as the U.S., and many states, continued to make large progress in vaccinating older adults
Nationally, 38.5% of older adults (age 65 and older) had received at least one dose of the COVID-19 vaccine, which was 18.6 percentage points higher than the rate among all adults (19.9%). Vaccination rates for older adults ranged from 17.6% in Rhode Island to 60.5% in Alaska. Older adult vaccination rates were below 25% in four states (New Hampshire, Oregon, Rhode Island, and Vermont) and at or above 50% in five states (Alaska, Georgia, Indiana, Mississippi, and Oklahoma) and in D.C.
Percent of Adults Age 65+ Who Had Received a COVID-19 Vaccine

As in the previous period, states continued to make large progress in rates of vaccination among older adults. Compared to the end of January, 19 states more than doubled their 65+ vaccination rates, and three states (Minnesota, Wisconsin, and Nebraska) more than tripled their 65+ vaccination rates, with Minnesota nearly quadrupling its rate (from 8.5% to 33.7%). Only a handful of states failed to make substantial progress in increasing vaccination rates among older adults.
Notes about the Household Pulse Survey Data
The estimated rates presented in this post were calculated from the count estimates published by the Census Bureau. Though these counts are accompanied by standard errors, standard errors are not able to be accurately calculated for rate estimates. Therefore, we are not able to determine if the differences we found in our analysis are statistically significant or if the estimates themselves are statistically reliable. Estimates and differences for subpopulations at the state level should be assumed to have large confidence intervals around them and caution should be taken when drawing strong conclusions from this analysis. However, the fact that patterns of inequities in other vaccination rates are mirrored by these early indications of COVID-19 vaccination inequities demonstrates reason for concern.
Though produced by the U.S. Census Bureau, the HPS is considered an “experimental” survey and does not necessarily meet the Census’s high standards for data quality and statistical reliability. For example, the survey has relatively low response rates (7.3% for February 3-15), and sampled individuals are contacted via email and text message, asking them to complete an internet-based survey. These issues in particular could be potential sources of bias, but come with the tradeoffs of increased speed and flexibility in data collection as well as lower costs. A future post will investigate differences between COVID vaccination rates estimated from survey data (such as the HPS) and administrative sources. The estimates presented this post are based on responses from 77,122 adults. More information about the data and methods for the Household Pulse Survey can be found in a previous SHADAC blog post.
Previous Blogs in the Series
COVID-19 Vaccination Rates: New State-level and Subpopulation Evidence from the Household Pulse Survey (Update: Jan 10 to Feb 1)
COVID-19 Vaccination Rates: New State-level and Subpopulation Evidence from the Household Pulse Survey (Jan 6 to Jan 18)
Related Reading
State-level Flu Vaccination Rates among Key Population Subgroups (50-state profiles) (SHADAC Infographics)
50-State Infographics: A State-level Look at Flu Vaccination Rates among Key Population Subgroups (SHADAC Blog)
Anticipating COVID-19 Vaccination Challenges through Flu Vaccination Patterns (SHADAC Brief)
New Brief Examines Flu Vaccine Patterns as a Proxy for COVID – Anticipating and Addressing Coronavirus Vaccination Campaign Challenges at the National and State Level (SHADAC Blog)
Ensuring Equity: State Strategies for Monitoring COVID-19 Vaccination Rates by Race and Other Priority Populations (Expert Perspective for State Health & Value Strategies)
SHADAC Webinar - Anticipating COVID-19 Vaccination Challenges through Flu Vaccination Patterns (February 4th) (SHADAC Webinar)