VISIT STATE HEALTH COMPARE
Blog & News


COVID-19 Vaccination Rates: New State-level and Subpopulation Evidence from the Household Pulse Survey (Jan 6 to Jan 18)
January 29, 2021:Newly available COVID-19 vaccines promise to help protect individual Americans against infection and eventually provide population-level herd immunity. However, the rollout of the COVID-19 vaccines thus far—largely delegated to the states—has been slow and inconsistent. The initial groups prioritized for vaccination were health care workers on the front lines of the pandemic and nursing facility residents, many of whom are especially vulnerable to COVID-19 infection and severe outcomes. However, there are concerns that these prioritization decisions—in addition to evidence that lower-income individuals, people of color, and individuals without strong connections to the health care system are less likely to get vaccinated—could worsen existing pandemic-related health inequities.
Preliminary data have unfortunately reinforced these concerns, showing patterns of lower vaccination rates among people with lower incomes and levels of education, and marginalized racial and ethnic groups. The U.S. Census Bureau recently released new data on take-up of COVID-19 vaccines from the most recent wave of its Household Pulse Survey (HPS), collected January 6-18, 2021. The HPS is an ongoing, weekly tracking survey designed to measure impacts of the COVID-19 pandemic. These data are the first to provide estimates of COVID-19 vaccination rates at the state level and by subpopulation. This blog post presents top-level findings from these new data, focusing on rates of vaccination (one or more doses) among U.S. adults (age 18 and older) living in a household unit.1
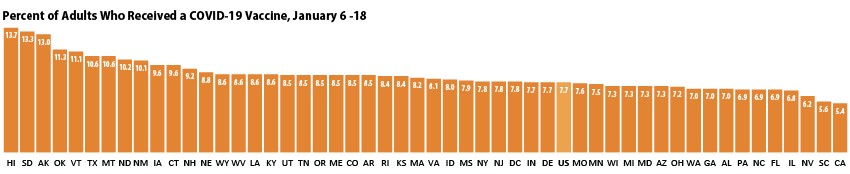
Roughly eight percent of adults had received a vaccination, but this varies by state
According to the new HPS data, 7.7% of U.S. adults had received one or more COVID-19 vaccinations during this two week period in January, though this varied by state from a low of 5.4% in California to a high of 13.7% in Hawaii. More than one in ten adults had received a vaccine in nine states: Alaska, Hawaii, Montana, New Mexico, North Dakota, Oklahoma, South Dakota, Texas, and Vermont.
Disparities in vaccination rates reflect concerns about harder-to-reach groups and groups prioritized for initial round of vaccinations
Vaccination rates also varied substantially by a number of demographic and socioeconomic factors. These could be partly a result of decisions to prioritize health care workers, who tend to be less racially and ethnically diverse than the overall population, and who often have higher incomes and levels of education.
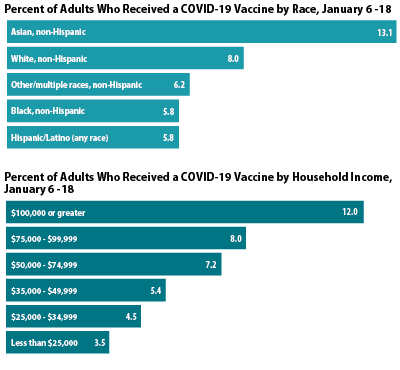 By race and ethnicity, non-Hispanic Asian adults had the highest vaccination rates at 13.1%, followed by non-Hispanic White adults at 8.0%. Hispanic/Latino adults (any race), non-Hispanic Black adults, and non-Hispanic adults identifying with multiple races or some other race had lower vaccination rates (5.8%, 5.8%, and 6.2%, respectively). A similar pattern was seen across many states, with Asian and White adults often more likely to have received a vaccine than Black and Hispanic adults.
Large disparities in vaccination rates by income were also apparent, with the highest income groups reporting higher rates of vaccination compared to those with lower incomes, and rates increasing steadily in correlation with income. Of adults with household incomes of $100,000 or higher, 12.0% had received a COVID-19 vaccine, which was nearly 2.5x higher than the rate among those with incomes below $25,000.
Nearly half of all adults who had received a COVID-19 vaccine have incomes of at least $100,000, despite making up only three in ten adults in the overall population.
Similar patterns by income were seen across the states. For example, in 17 states, adults in the highest income category were at least 5x more likely to have been vaccinated than those in the lowest income category.
Patterns of vaccination by education were similar to those by income, with adults with less education being less likely to have received a vaccine compared to adults with more education. Nationally, 12.2% of adults with a bachelor’s degree or higher have received a vaccine compared with 3.7% of adults with less than a high school education.
More progress is needed in vaccinating the older adult population most vulnerable to severe COVID-19 morbidity and mortality
Nationally, older adults (age 65 older) were no more likely to have received a COVID-19 vaccine than the overall adult population. During the period of January 6 through January 18, 7.1% of older adults had received a vaccine compared with 7.7% of all adults. This may be of concern because older adults are more likely to develop severe COVID-19 cases or die from the disease compared to the general population. Consequently, many states have given precedence to vaccinations for older adults, but these early data don’t show that prioritization is resulting in higher vaccination rates.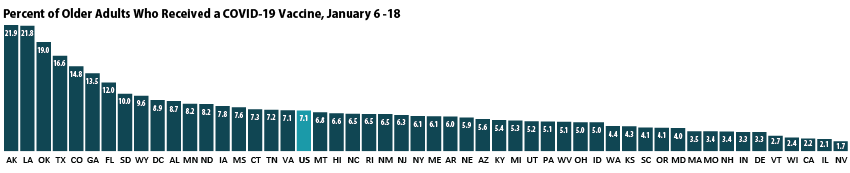
Vaccination rates for older adults ranged from 1.7% in Nevada to 21.9% in Alaska. Vaccination rates were below five percent in 15 states and were above ten percent in seven states. Older adults were more likely to have received a vaccine than the overall population in just 11 states
Notes about the Household Pulse Survey Data
Many of the estimates published by the Census Bureau and presented here were not accompanied by standard errors. Therefore, we are not able to determine if the differences we found in our analysis are statistically significant or if the estimates themselves are statistically reliable. Estimates and differences should be assumed to have large confidence intervals around them—especially for subpopulations at the state level—and caution should be taken when drawing strong conclusions from this analysis. However, the fact that patterns of inequities in other vaccination rates are mirrored by these early indications of COVID-19 vaccination inequities demonstrates reason for concern.
Though produced by the U.S. Census Bureau, the HPS is considered an “experimental” survey and does not necessarily meet the Census’s high standards for data quality and statistical reliability. For example, the survey has relatively low response rates (6.5% for January 6–18) and sampled individuals are contacted via email and text message, asking them to complete an internet-based survey. These issues in particular could be potential sources of bias, but come with the tradeoffs of increased speed and flexibility in data collection as well as lower costs. The estimates presented this post are based on responses from 68,348 adults. More information about the data and methods for the Household Pulse Survey can be found in a previous SHADAC blog post.
Related Reading
Anticipating COVID-19 Vaccination Challenges through Flu Vaccination Patterns (SHADAC Brief)
New Brief Examines Flu Vaccine Patterns as a Proxy for COVID – Anticipating and Addressing Coronavirus Vaccination Campaign Challenges at the National and State Level (SHADAC Blog)
Ensuring Equity: State Strategies for Monitoring COVID-19 Vaccination Rates by Race and Other Priority Populations (Expert Perspective for State Health & Value Strategies)
Upcoming SHADAC Webinar - Anticipating COVID-19 Vaccination Challenges through Flu Vaccination Patterns (February 4th) (SHADAC Webinar)
1 It is important to mention that the HPS does not collect data for institutionalized adults, such as those living in nursing facilities. These individuals were commonly prioritized for the first rounds of COVID-19 vaccines, so the estimates of vaccination rates presented here are likely an undercount of population-wide vaccination rates. This undercount could be more pronounced among the total 65-and-older population, as they are disproportionately likely to reside in institutions. Further, these data do not represent adults in correctional facilities such as prisons or jails—another group of adults who are also at increased risk of contracting COVID-19.
Blog & News
New Brief Examines Flu Vaccine Patterns as a Proxy for COVID – Anticipating and Addressing Coronavirus Vaccination Campaign Challenges at the National and State Level
January 6, 2021:
Within just a year, the U.S. saw both the devastating arrival of the novel coronavirus (COVID-19) as well as the rapid innovation by researchers and scientists that produced multiple vaccines in response to this disease. In the final month of 2020, the U.S. Food and Drug Administration’s (FDA) approval of two such vaccinations developed by Pfizer-BioNTech and Moderna marked a significant step in the battle toward preventing and controlling the spread of the pandemic.
Across the United States, the rollout of the vaccine to health care and essential workers is already underway; however, once this first tier of recipients has been vaccinated, states will need to begin subsequent phases of a massive vaccination campaign among their larger resident populations. The ultimate goal is to reach sufficient levels of COVID vaccination in order to achieve protective population immunity, or “herd immunity.”
But efforts toward that aim may be hampered by various hurdles, including vaccine skepticism and a U.S. health care system that typically leaves large segments of the population underserved.
While public health officials design and implement their vaccination plans, the nation’s experiences with other vaccine campaigns can provide insights as to the specific challenges faced by states in attaining their targets for coronavirus immunization. A new SHADAC report funded by the California Health Care Foundation (CHCF) and authored by SHADAC researchers Colin Planalp, MPA, and Robert Hest, MPP, uses data from the U.S. Centers for Disease Control and Prevention’s (CDC) Behavioral Risk Factor Surveillance System (BRFSS) survey to examine flu vaccination rates across multiple years for U.S. adults (age 18 and older) across the 50 states and the District of Columbia as a proxy to identify population subgroups that may be harder to reach with a COVID-19 vaccine. The brief also provides an analysis of several demographic categories, including indicators of health and health care access, for the U.S. and California, specifically.1
Key Findings – Vaccination Landscape
A number of experts have previously agreed that in the U.S., a minimum threshold of approximately 70% immunity among the national population must be reached in order to bring the COVID-19 epidemic under control.2 Even that target of 70% may be insufficient, and some experts such as National Institute of Allergies and Infectious Diseases (NIAID) Director Dr. Anthony Fauci and other prominent epidemiologists have more recently recommended shifting the goal to 80% or even higher. However, multiple surveys have found that while public willingness currently sits at its highest reported rate to date, it still often falls short of those rates.3 While it is unclear how survey results may translate into vaccine take-up, when looking at analog flu vaccine rate several barriers to achieving these ambitious immunity goals become apparent.

Key Findings – Vaccination Trends for U.S. and California
While it is important to consider national and state data, it is also vital to remember that looking only at estimates on these levels can mask significant differences and disparities across subpopulations that are likely to require targeted efforts in a vaccination campaign. Achieving population immunity against COVID-19 across both the broader population and particular communities is important for health equity. It also is important to protect against continued smaller-scale outbreaks of COVID-19 for years to come, such as the occurrences experienced by multiple states in recent years from measles—a disease that was once considered to be eliminated from the U.S.4 To that end, the issue brief looked across subgroups in the U.S. and California, to identify which groups and may be hardest to reach with a COVID-19 vaccine.

Looking Ahead
While not a perfect analog for COVID-19, the flu vaccination rates presented in this brief are probably the best available proxy to predict the challenges the U.S. and states face in implementing a widespread COVID-19 vaccination campaign following the recent approval of the first such vaccines in the nation, with others anticipated to follow.5

Understanding these challenges and subpopulation differences can help states, such as California, identify which groups may be hardest to reach with a COVID-19 vaccine as well as craft strategies and guide outreach efforts to ensure the greatest equity and effectiveness in vaccinating the populations of states and the U.S. against the coronavirus.
This work is supported by the California Health Care Foundation.
Notes.
1 To enhance the ability to reliably measure vaccination rates for relatively small subgroups, SHADAC authors combined three years of data from the 2017-2019 BRFSS surveys, and estimates in the report represent an average of this time period.
2 Mayo Clinic. (n.d.). Herd immunity and COVID-19 (coronavirus): What you need to know. https://www.mayoclinic.org/diseases-conditions/coronavirus/in-depth/herd-immunity-and-coronavirus/art-20486808
Kwok, K.O., Lai, F., Wei, W.I., Shan Wong, S.Y., & Tang, J.W.T. (2020). Herd immunity – estimating the level required to halt the COVID-19 epidemics in affected countries. Journal of Infection, 80(6), e32–e33. doi: 10.1016/j.jinf.2020.03.027
Moore, K.A., Lipsitch, M., Barry, J.M., & Osterholm, M.T. (2020, April 30). COVID-19: The CIDRAP Viewpoint. Center for Infectious Disease Research and Policy (CIDRAP); University of Minnesota. https://printabletemplates.com/cidrap-covid19-viewpoint/
3 MacNeil, Jr., D.G. (2020, December 24). How much herd immunity is enough? The New York Times. https://www.nytimes.com/2020/12/24/health/herd-immunity-covid-coronavirus.html
4 Centers for Disease Control and Prevention (CDC). (2020, December 2). Measles cases and outbreaks. https://www.cdc.gov/measles/cases-outbreaks.html
5 Centers for Disease Control and Prevention (CDC). (2020, December 28). Different COVID-19 vaccines. https://www.cdc.gov/coronavirus/2019-ncov/vaccines/different-vaccines.html
Publication
Anticipating COVID-19 Vaccination Challenges through Flu Vaccination Patterns
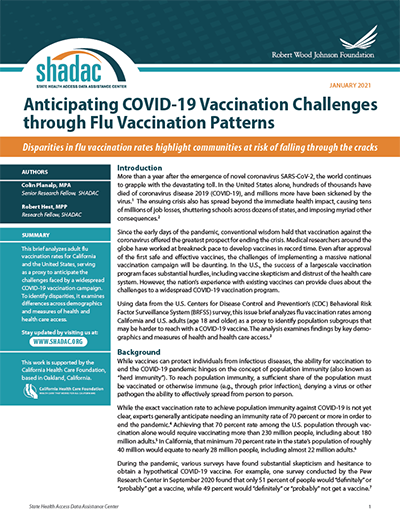 A new issue brief from SHADAC researchers, funded by the California Health Care Foundation (CHCF), examines flu vaccination rates as the closest possible analog to understanding how the implementation of a widespread coronavirus vaccination campaign will unfold.
Using data from the U.S. Centers for Disease Control and Prevention’s (CDC) Behavioral Risk Factor Surveillance System (BRFSS) survey, the brief analyzes flu vaccination rates among United States and California adults (age 18 and older). The analysis also includes a breakdown of findings across several demographic categories and by indicators of health and health care access for both California and the U.S. across multiple data years (2017-2019). Estimates for these three years were pooled in order to achieve greater accuracy in measuring data for smaller subgroups.
Key findings from the brief indicate that current flu vaccination rates fall short of the needed targets to reach COVID-19 herd immunity goals not only among the overall population, but also across all subgroups, even those with the highest reported vaccinations (adults age 65 and older), for both California and the U.S. However, understanding the wide variation in reported vaccine rates among subpopulations provides states (such as California) with the ability to identify which groups may be hardest to reach with a COVID-19 vaccine as well as craft strategies and guide outreach to ensure the greatest equity and effectiveness in vaccination efforts.
Click on the image to the right to download the brief, or head to the SHADAC blog to learn more about the key findings of this brief.
SHADAC researchers also developed a set of two-page infographics that explore state-level estimates on flu vaccination rates for adults (age 18+) using data for all 50 states and the District of Columbia (D.C.) from the Behavioral Risk Factor Surveillance System (BRFSS) survey.
This work is supported by the California Health Care Foundation.

Blog & News
Spotlight on Health Behaviors: Adult Who Forgo Needed Medical Care and Adults Who Have No Personal Doctor
December 21, 2020:Prior to the arrival of the novel coronavirus, much of American consumer health care concerns surrounded rising costs of care. With health care spending rising a reported 4.6 percent in 2018 and the Centers for Medicare and Medicaid Services (CMS) Office of the Actuary projecting an average annual increase of 5.4 percent for 2019 to hit a record $3.82 trillion or around $11,559 per person—this issue will remain at the forefront of concern for the foreseeable future.1
Compounding these trends in spending, the continued rise in the share of Americans without health insurance coverage has left more individuals without a means of protecting themselves or their families from the financial burden of illness or injury and without strong ties to health care providers and the health care system to access care.
The effects of rising health care spending and rising rates of uninsurance can be seen in direct measures of actual dollars, such as Medical Out-of-Pocket Spending and Percent of Individuals with High Medical Care Cost Burden, but also in more indirect avenues, such as changes in health behaviors and access to care.
Two measures of such behaviors, Adults Who Forgo Needed Medical Care and Adults with No Personal Doctor, are housed on SHADAC’s State Health Compare and have been recently updated with 2019 data from the Center for Disease Control's Behavioral Risk Factor Surveillance System (BRFSS). This blog provides an analysis of these indirect costs of rising health care spending and uninsurance in the year prior to the COVID-19 pandemic and examines overall national and state-level trends as well as comparisons across race/ethnicity and educational attainment.
Adults Who Forgo Needed Care
Across the nation, progress was made in reducing the percentage of adults who forgo needed medical care in the years following the passage of the Affordable Care Act (ACA). However, that progress began to flatten out by 2016 and has now begun to reverse course and display a trend of smaller but significant increases in recent years, such as the growth from 12.9% in 2018 to 13.4% in 2019 at the national level.
Trends by Education and Race/Ethnicity
Examining forgone care by individual breakdowns showed that disparities by education level and race/ethnicity, found in a previous SHADAC analysis, have persisted from the year before.
Across the U.S., adults with less than a high school degree saw their rates of forgone care hit 22.2% in 2019 from 21.1% in 2018;i a figure nearly triple the rate among adults with a bachelor’s degree, who saw their rate of forgone care rise to 7.9% in 2019 (up from 7.4% in 2018).
Nationally, Hispanic/Latino adults experienced the largest increase in rates of forgone care, rising to 21.4% in 2019 from 20.2% in 2018. African-American/Black and Hispanic/Latino adults were also significantly more likely to report going without needed medical care than White adults, with the former being 1.5 times more likely (15.7% vs. 10.9%) and the latter nearly twice as likely (21.4% vs. 10.9%).

State Trends
At the state level, the trends in forgone care are varied. Despite increasing national trends, some states, such as Florida and Michigan, have continued to make steady progress in reducing forgone care. Florida saw their overall rates drop by 5.9 percentage points,ii from 22.0% in 2011 to 16.0% in 2019, and Michigan saw a similarly steady drop in rates of forgone care from 16.5% in 2011 to 11.7% in 2019.
Unfortunately, progress in reducing the number of adults who report going without needed medical care has stalled in many states—California and Kentucky being two such examples. The former state has seen relatively unchanged rates of forgone care since 2016 (11.4%, 11.8% in 2017, and 11.9% in 2018 and 2019). The percentage of adults who have gone without needed medical care in Kentucky has likewise remained nearly unchanged from 2015 to 2019 (12.3% and 12.1%, respectively).
In other states, such as Kansas and Maine, rates of forgone care have followed the national trend and in 2015 begun reversing course on previous gains. The state of Kansas saw a 2.1 percentage-point increase from 2015 to 2019 (11.0% to 13.1%) and Maine saw a concerning increase of 2.9 percentage points during the same time period (9.4% in 2015 to 12.3% in 2019).
It is important to remember that these increases in forgone care occurred in the context of an economy that was growing steadily before the COVID recession. Though the release of 2020 data is at least another year away, early studies and surveys have given some indications as to the impact of the COVID-19 pandemic on health behaviors. SHADAC conducted a survey in April 2020 in which over half of U.S. adults (51.1 percent) said they had delayed or canceled health care appointments due to the pandemic.2
Adults With No Personal Doctor
 As with the measure of forgone medical care, more adults reported having a usual source of care after the passage of the ACA. However, once again this promising trend reversed itself in 2015, after which the percent of adults with no personal doctor or health care provider has increased each year, nearly reaching its pre-ACA peak in 2019 at 23.4% (23.8% in 2013). Both of these increasing trends have paralleled an increase in the rate of the uninsured across the nation, from 8.6% in 2016 to 9.2% in 2019.3
Trends by Education and Race/Ethnicity
Significant disparities by education level and race/ethnicity were again present for this measure in 2019.
 At the national level, adults with less than a high school education were more than twice as likely as adults with a bachelor’s degree to report not having a regular doctor (34.7% versus 16.0%). This pattern was consistent across more than half of states, as adults with less than a high school degree were more than twice as likely to report having no doctor as those with a bachelor’s degree in 26 states, and more than three times as likely in 5 states (Connecticut, Delaware, Maryland, Nebraska, and New Hampshire). There was no statistical difference between these educational groups in D.C. and 6 states (Kentucky, Mississippi, North Dakota, Tennessee, Vermont and West Virginia).
 Nationally, Hispanic/Latino and Black adults were both significantly more likely to report not having a regular doctor as compared to White adults. Hispanic/Latino adults were more than twice as likely as White adults to report not having a personal doctor (40.5% vs. 18.7%), and African-American/Black adults were more than 1.2 times as likely as White adults to report not having a personal doctor (22.7% vs. 18.7%). Again this pattern persisted among over half of the nation, as Hispanic/Latino adults were more than twice as likely to report not having a regular doctor as White adults in 28 states, and more than three times as likely to report the same in 3 states (Delaware, Maryland, and Nebraska). African-American/Black adults were at least 1.2 times as likely to report not having a regular doctor as White adults in 17 states, and this gap measured 1.5 times or larger in 6 states (Nebraska, Iowa, Kansas, Massachusetts, Michigan and Utah).
Related Reading
Affordability and Access to Care in 2018: Examining Racial and Educational Inequities across the United States (Infographic)
Most U.S. Adults Report Reduced Access to Health Care due to Coronavirus Pandemic
Eleven Updated Measures are Now Available on State Health Compare
1 Hartman, M., Martin, A.B., Benson, J., & Catlin, A. (2019, December 5). National Health Care Spending in 2018: Growth Driven by Accelerations in Medicare and Private Insurance Spending. HealthAffairs, 39(1). https://doi.org/10.1377/hlthaff.2019.01451
Keehan, S.P., Cuckler, G.A., Poisal, J.A., Sisko, A.M., Smith, S.D., Madison, A.J., Rennie, K.E., Fiore, J.A., & Hardesty, J.C. (2020, March 24). National Health Expenditure Projections, 2019–28: Expected Rebound in Prices Drives Rising Spending Growth. HealthAffairs, 39(4). https://doi.org/10.1377/hlthaff.2020.00094
California Health Care Foundation (CHCF). (2019). Health Care Costs 101: Spending Keeps Growing. California Health Care Almanac. https://www.chcf.org/wp-content/uploads/2019/05/HealthCareCostsAlmanac2019.pdf
2 Planalp, C., Alarcon, G., & Blewett, L.A. (2020). Coronavirus pandemic caused more than 10 million U.S. adults to lose health insurance. https://shadac.org/news/SHADAC_COVID19_AmeriSpeak-Survey
3 State Health Access Data Assistance Center (SHADAC). (2020). 2019 ACS: Rising National Uninsured Rate Echoed Across 19 States; Virginia Only State to See Decrease (Infographics). https://www.shadac.org/sites/default/files/ACS_Estimates-2019-Infographic.pdf
Blog & News
State Health Compare Users Can Now Explore Unemployment by Race/Ethnicity
November 18th, 2020:SHADAC has updated our State Health Compare online data tool to provide estimates of unemployment according to race and ethnicity. Previously, State Health Compare users could analyze unemployment nationwide and at the state level for years 2000 to 2019, but subgroup analyses were not possible. Now, users can explore State Health Compare’s unemployment estimates, which come from the federal Bureau of Labor Statistics, by four racial/ethnic breakdowns: Hispanic/Latino, African-American/Black, Asian and White.
Why This Change Matters
Racial/ethnic breakdowns provide an important lens for analyzing unemployment as a social determinant of health, with unemployment often varying widely across racial/ethnic categories in a way that can be masked by a consideration of population-wide unemployment numbers. We see this scenario at the national level, where the overall unemployment rate in 2019 was 3.7%, but an examination of unemployment for racial/ethnic subgroups reveals 2.7% unemployment among Asian Americans, 3.3% unemployment among Whites, 4.3% unemployment among Hispanics/Latinos, and 6.1% unemployment among African-Americans/Blacks.
Minnesota provides a state case that parallels the national picture on this point. If we look at statewide unemployment in 2019, we find that Minnesota’s unemployment rate was 3.2%, which is 0.5 percentage points below the national rate of 3.7%. However, if we look at the numbers sorted by race/ethnicity, a different picture emerges: The rate for Asians in Minnesota is 2.4%, Whites are at 3.0%, Hispanics/Latinos are at 5.0%, and African-Americans/Blacks are at 5.5%. Not only do Hispanics/Latinos and African-Americans/Blacks have higher unemployment rates than Whites and Hispanics/Latinos, but their rates are also above the broader Minnesota state average, as well as the national average. Thus, what looks at first glance like a state doing well on unemployment turns out to be a state with major disparities in unemployment for certain racial/ethnic subgroups.
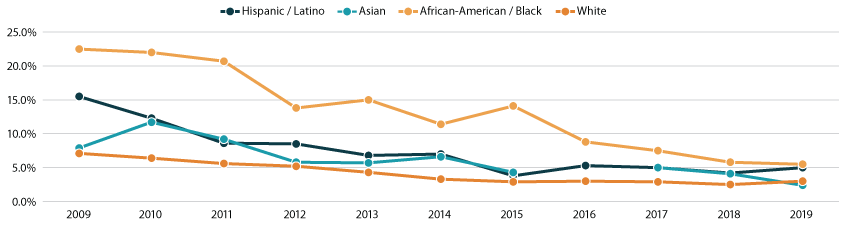
An examination of trends in unemployment over time confirms that the 2019 data for Minnesota are not an anomaly. Though unemployment numbers for Asians in Minnesota were less stable from year to year, White Minnesotans consistently had unemployment rates below those of Hispanic/Latino Minnesotans each year during the 10-year period from 2009 to 2019, and African-American and Black Minnesotans consistently had the highest unemployment rates of any analyzed racial/ethnic group during this time (Figure 1.)
Figure 1. Unemployment in Minnesota by Race/Ethnicity, 2009-2019
The Importance of Considering Individual States
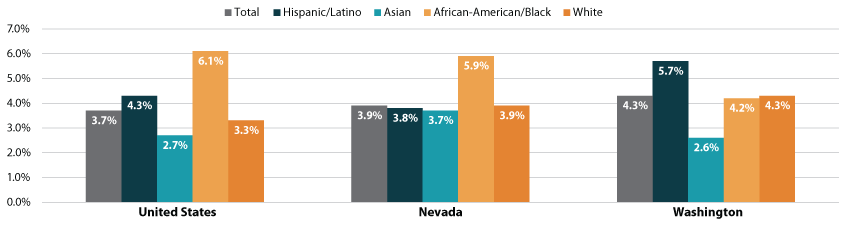
Additionally, it is worth exploring both overall and racial/ethnic subgroup numbers within each individual state, as there is considerable variation both across states and between states and the nation. Washington state, for example, saw an overall unemployment rate of 4.3%, or 0.6 percentage points above the national rate. And among racial/ethnic subgroups, Washington’s numbers followed a different pattern than that seen nationally, with African-Americans/Blacks having the second lowest unemployment rate (4.2%), Whites having the third lowest rate (4.3%), and Hispanics/Latinos having the highest rate (5.7%).
Nevada is another state that had 2019 unemployment numbers that differed from the national story when looking at racial/ethnic breakdowns. Like Washington, Nevada’s state’s overall unemployment rate of 3.9% was above the national rate. However, unemployment in Nevada was second lowest among Hispanics/Latinos (3.8%), third lowest among Whites (3.9%), and highest among African-Americans/Blacks (5.9%).
Figure 2. Unemployment in by Race/Ethnicity, 2019: United States, Nevada, Washington
Taking these state variations into consideration, it’s clear that efforts to analyze and/or address disparities in unemployment by race/ethnicity would potentially look different in Washington and Nevada, or even going to back our example in Minnesota, based on their respective divergences in overall and subgroup numbers.
Discussion: Unemployment as a Social Determinant of Health
Unemployment has important implications for health and health care, as employment affects access to stable housing, food, and health insurance coverage and care. At the same time, unemployment can also have a number of direct negative health consequences, including depression, anxiety, and stress-related illness such as high blood pressure, stroke, heart attack, heart disease, and arthritis.1-7
An examination of unemployment that takes into consideration important nuances in unemployment numbers among subgroups reveals the need for critical, targeted attention to unemployment, even in states where unemployment appears to be trending well overall. Consideration of interstate variation of unemployment by race/ethnicity reveals that policy levers to address unemployment that take race/ethnicity into consideration will require state-specific modifications as well.
Explore the Data
Visit State Health Compare to learn more about unemployment by race/ethnicity within and across the states.
About the Estimates
State Health Compare’s estimates of unemployment are produced using data from the federal Bureau of Labor Statistics and represent the percent of the civilian labor force (age 16 and older) that was unemployed. State refers to place of residence.
1 Avendano, M., Berkman, L. F. (2014). Labor markets, employment policies, and health. In L. F. Berkman, I. Kawachi, & M. Glymour (Eds.), Social Epidemiology (2nd ed., pp. 182-233). Open University Press.
2 Murray, L. R. (2003). Sick and tired of being sick and tired: scientific evidence, methods, and research implications for racial and ethnic disparities in occupational health. Am J Public Health, 93(2), 221-226.
3 Kasl, S. V., Cobb, S. (1970). Blood pressure changes in men undergoing job loss: a preliminary report. Psychosom Med, 32(1), 19-38.
4 Frumkin, H. E., Walker, D., Friedman-Jiménez, G. (1999). Minority workers and communities. Occup Med, 14(3), 495-517.
5 James, S. A., LaCroix, A. Z., Kleinbau, D. G., Strogatz, D. S. (1984). John Henryism and blood pressure differences among black men. II. The role of occupational stressors. J Behav Med, 7(3), 259-275.
6 Robert Wood Johnson Foundation. (2013). How does employment—or unemployment—affect health? Health policy snapshot. Available from http://www.rwjf.org/content/dam/farm/reports/issue_briefs/2013/rwjf403360
7 U.S. Department of Labor, Bureau of Labor Statistics. (2012). A profile of the working poor, 2010. News release. Available from https://www.bls.gov/opub/reports/working-poor/archive/workingpoor_2010.pdf