VISIT STATE HEALTH COMPARE
Blog & News


Monitoring Childhood Poverty during and after COVID-19
November 16, 2021:Childhood poverty has been brought to the forefront during the COVID-19 pandemic, with pandemic restrictions making it harder for families with low incomes to meet the needs of their children.1 As schools switched to distance learning, many children from low-income households faced new or heightened food insecurity without access to free and reduced-price lunches at school sites. Remote schooling worsened inequities as children from low-income households also disproportionately lacked sufficient access to technology and home learning environments that were safe and well-supervised.2,3,4 Moreover, recent studies point toward the number of children dealing with the challenges of poverty increasing as the pandemic progressed, with the number of children living in poverty growing by an estimated 2.5 million between May 2020 and September 2020.5
|
Defining Poverty |
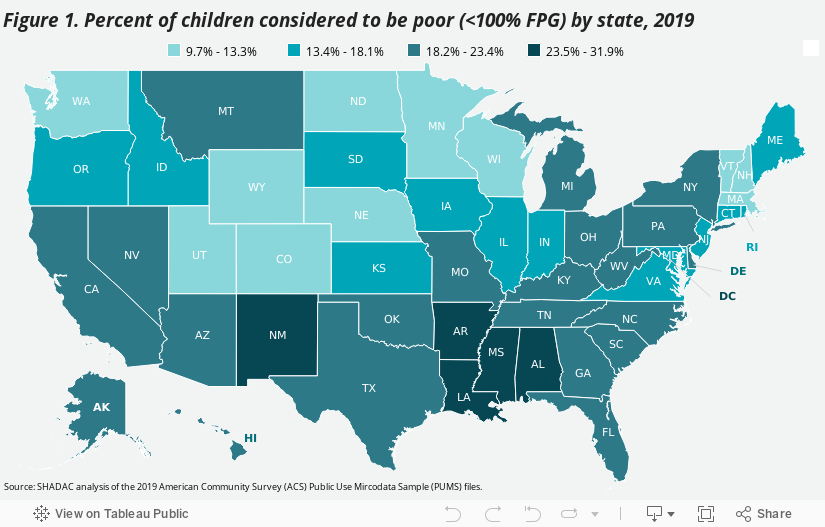
What the 2019 Data Tell Us
The most recent annual estimates of childhood poverty at the federal and state
levels come from the Census Bureau’s 2019 American Community Survey (ACS).
Consideration of 2019 childhood poverty rates across the country provides important pre-pandemic baseline context for future understanding of how the COVID-19 crisis
may have impacted children and families who are living in poverty. The 2019 ACS data show that:
| - Nearly one in every five children in the United States lived in poverty in 2019. | ||||
| - Mississippi had the highest child poverty rate with almost one in every three children (31.9 percent) living in poverty. | ||||
| - New Hampshire had the lowest child poverty rate with less than one in every ten children (9.7 percent) living in poverty. | ||||
| - Child poverty rates tended to be higher in states across the South. (Figure 1.) The five states with the highest rates were: | ||||
| Mississippi | Louisiana | Arkansas | New Mexico | District of Columbia |
| 31.9% | 29.6% | 25.4% | 25.6% | 25.1% |
| - States with lower childhood poverty rates were spread across the Northeast, Midwest, and West Census Regions. (Figure 1.) The five lowest rates were found in: |
||||
| New Hampshire | North Dakota | Minnesota | Wyoming | Nebraska |
| 9.7% | 9.8% | 10.9% | 12.0% | 12.1% |
What Happened in 2020?
Unfortunately, the data that SHADAC uses to measure Children in Poverty comes from the American Community Survey (ACS), for which the U.S. Census Bureau announced in July 2021 that it will not be releasing its standard 1-year estimates from 2020 due to impacts of the COVID pandemic. Instead, the Bureau plans to release 2020 ACS 1-year “experimental” estimates in November 2021, for which they have cautioned against use in analysis due to substantially lower response rates than usual and nonresponse bias.
However, the Census Bureau has released 2020 estimates from another major survey, the Current Population Survey (CPS), which SHADAC has also used to produce special, 1-year only, state-level estimates of health insurance coverage in lieu of data from the ACS.
Nationally, the CPS shows that the rate of childhood poverty was 16.1 percent in 2020, representing approximately 11.6 million children. While this rate represents a statistically significant increase from 14.4 percent in 2019, the Census Bureau has again cautioned that data from this year may also have been impacted by the pandemic. Comparing with the rate of 16.2 percent of children at 2018, then, shows a potentially more stable trend, as this rate does not statistically differ from 2020.6 The extent to which children in poverty have been affected by the COVID-19 pandemic therefore remains uncertain at this time, and researchers at SHADAC plan to continue monitoring a variety of data sources in order to determine which, if any, might be able to paint a clear picture of what happened to measures of poverty in the U.S. in 2020.
Conclusion
The country is opening back up as COVID-19 vaccination rates grow. However, families with lower incomes, in particular, are still recovering from over a year of shut-down activities and the challenges of poverty that have been potentially exacerbated by the COVID-19 public health crisis.7 Federal and state policymakers have targeted relief at these same families, recognizing the particular hardships they have faced during the pandemic. At the federal level, the American Rescue Plan Act of 2021 began distributing the Child Tax Credit - that includes extended SNAP benefits as well as direct payments - to qualifying families beginning in July 2021, which may also play a role in attempts to reduce childhood poverty in 2021.8 And some states have passed measures of their own to support families with lower incomes who have children. In Minnesota, for example, the state’s current budget includes provision for a one-time payment of up to $435 to support about 32,000 families, including 64,000 children. In Washington, legislators passed a tax exemption for working families with lower incomes that will provide up to $1,200 per year to residents of the state.9
Estimates of childhood poverty rates in 2020, if they are able to be made available at some point, may indicate the extent to which state-level efforts, in particular, have been applied in areas of the country where they were most needed and will also indicate where further efforts to remediate childhood poverty are still required. Further monitoring will be necessary in subsequent years to identify ongoing and new areas of need as well as areas where policies to remediate childhood poverty may have been beneficial.
About the Data
The estimates cited here can be accessed through SHADAC’s online data tool, State Health Compare. Estimates are available for 2008-2019 and are generated by SHADAC’s analysis of the American Community Survey (ACS) Public Use Microdata Sample (PUMS).
1 Children’s Defense Fund. (2021). The State of America’s Children® 2021: Child poverty. https://www.childrensdefense.org/state-of-americas-children/soac-2021-child-poverty/
2 Lakahni, R. (2020, November 4). Learning from a distance: How remote learning can set low-income students back further. RTI International: Insights. https://www.rti.org/insights/how-remote-learning-impacts-low-income-students-covid-19
3 Povich, E. (2020, July 29). Virtual learning means unequal learning. Pew: Stateline. Available at https://www.pewtrusts.org/en/research-and-analysis/blogs/stateline/2020/07/29/virtual-learning-means-unequal-learning
4 Collis, V., & Vegas, E. (2020, June 22). Unequally disconnected: Access to online Learning in the US. Brookings: Education Plus Development. https://www.brookings.edu/blog/education-plus-development/2020/06/22/unequally-disconnected-access-to-online-learning-in-the-us/
5 Rodriguez, L. (2020, October 16). 8 Million more people in the US are now living in poverty due to COVID-19. Global Citizen. https://www.globalcitizen.org/en/content/millions-more-people-in-poverty-during-covid-19/
6 Shrider, E.A., Kollar, M., Chen, F., & Semega, J. (2021, September 14). Income and Poverty in the United States: 2020 [P60-273]. U.S. Census Bureau. https://www.census.gov/library/publications/2021/demo/p60-273.html
Semega, J., Kollar, M., Shrider, E.A., & Creamer, J. (2020, September 15). Income and Poverty in the United States: 2020 [P60-270]. U.S. Census Bureau. https://www.census.gov/library/publications/2020/demo/p60-270.html
7 Center on Budget and Policy Priorities. (2021, October 13). Tracking the COVID-19 economy’s effects on food, housing, and employment hardships. COVID Hardship Watch. Washington, DC: Center on Budget and Policy Priorities. https://www.cbpp.org/research/poverty-and-inequality/tracking-the-covid-19-recessions-effects-on-food-housing-and
8 H.R. 1319 American Rescue Plan Act of 2021. 117th Congress (2021-2022). https://www.congress.gov/bill/117th-congress/house-bill/1319/text
9 Goldbert, M. (2021, April 23). Analysis: Working families’ tax exemption will provide up to $1,200 per year to low-income Washingtonians. Washington State Wire. https://washingtonstatewire.com/analysis-working-families-tax-exemption-will-provide-up-to-1200-per-year-to-low-income-washingtonians/
Blog & News

2021 NHIS Early Release: Stable uninsured rate paired with increase in public coverage and decrease in private coverage
October 14, 2021:The National Center for Health Statistics (NCHS) has released quarterly estimates of health insurance coverage from January 2020-March 2021 from the National Health Interview Survey (NHIS) as part of the NHIS Early Release Program. These are some of the first estimates of health insurance coverage during 2021 from a major, federal government survey. This post compares uninsurance, private coverage, and public coverage rates in the first quarter of 2021 (Q1 2021) to those rates in the first quarter of 2020 (Q1 2020) and focuses on coverage by age group and federal poverty level (FPL).
Uninsured rates were stable among all age groups; Public and private coverage saw significant changes among all age groups
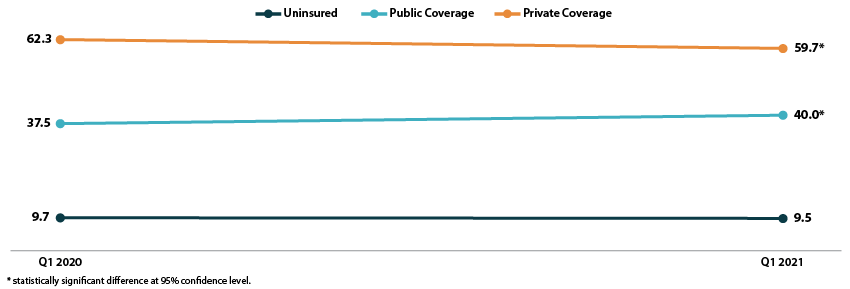
The uninsured rate remained stable in the first quarter of 2021, at an overall 9.5 percent for all ages, 11.3 percent for the non-elderly (age 0-64), 4.6 percent for children (age 0-17), and 13.8 percent for non-elderly adults (age 18-64).
All age groups except non-elderly adults saw increases in rates of public coverage. Public coverage increased 2.5 percentage points (PP) among all ages and for the non-elderly, increasing to 40.0 percent and 28.3 percent, respectively. Children saw an increase of 4.7 PP, rising to 45.6 percent with public coverage in Q1 2021.
Rates of private coverage fell 2.6 PP to 59.7 percent in Q1 2021 for those of all ages. Rates of private coverage were statistically unchanged for other specified age groups.
Figure 1. Health insurance coverage by type (all ages), Q1 2020 vs. Q1 2021
Coverage largely unchanged by poverty level
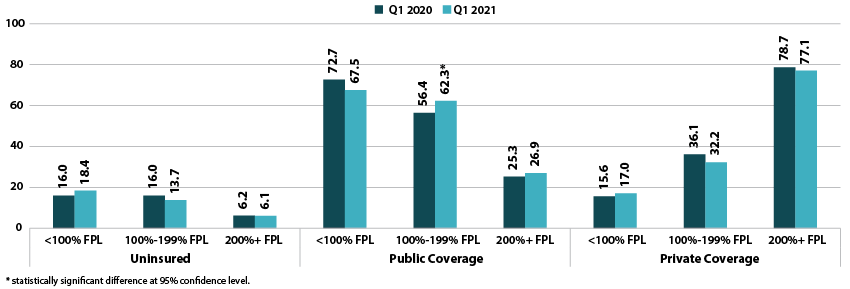
Rates of uninsurance were stable by poverty level in the first quarter of 2021. For those with incomes below 100% FPL, 18.4 percent were uninsured in Q1 2021. In other categories, 13.7 percent of those with incomes at 100%-199% FPL were uninsured, and 6.1 percent of those with incomes at or above 200% FPL were uninsured.
Rates of public coverage were statistically unchanged for those with incomes below 100% FPL (67.5 percent) and for those with incomes at or above 200% FPL (26.9 percent). Those with incomes 100%-199% FPL saw a 5.9 PP increase in rates of public coverage, rising to 62.3 percent in Q1 2021.
Rates of private coverage were stable by poverty level. Those with incomes below 100% FPL had a private coverage rate of 17.0 percent, those with incomes 100%-199% FPL had a private coverage rate of 32.2 percent, and those with incomes at or above 200% FPL had a private coverage rate of 77.1 percent.
Figure 2. Health insurance coverage by type by poverty level (all ages), Q1 2020 vs. Q1 2021
A note on changes to the NHIS data collection methodology
In response to the COVID-19 pandemic, the NHIS changed to a telephone-only and then telephone-first with in-person follow up data collection methodologies beginning on March 19, 2020. Though this did not affect the Q1 2020 estimates, NCHS’s analysis indicates that the change to telephone-only data collection led to an “over-representation of affluent households,” which may have affected the Q1 2021 estimates. More information on changes to federal survey methodology due to the COVID-19 pandemic is available in the SHADAC brief, Changes in Federal Surveys Due to and During COVID-19.
Blog & News

Now Available on State Health Compare: Special 2020-Only Health Insurance Coverage Measure and 2020 Updates to Several BRFSS Measures
October 6, 2021:
As has been previously noted, estimates for our Health Insurance Coverage Type measure will this year come from the U.S. Census Bureau’s Current Population Survey (CPS) Annual Social and Economic Supplement (ASEC), rather than the American Community Survey (ACS), due to a number of impacts on survey data and data collections efforts attributed to the COVID-19 pandemic.
In light of this, SHADAC has created a separate Health Insurance Coverage measure for 2020 data only on our State Health Compare site. Estimates for 2020 have been created specifically for that year, and should not be compared to other years of data, which come from the ACS. For more on the differences between the ACS and the CPS, see our recent blog that discusses key divergences and considerations for users of this data.
Health Insurance Coverage Type (2020)
Data for this measure show the percentage of the United States population that had a specific type of health insurance coverage (e.g., public, private, Medicaid, Medicare, etc.) at any point during the 2020 year. Estimates for uninsurance, however, represent the percent who were uninsured all year. Breakdowns for each type of coverage, as well as age and health status, are available for this measure.
State Health Compare also contains several other measures that come from the CPS ASEC, relating to cost of care.
Measures that have been updated from the CPS ASEC include:
People with High Medical Care Cost Burden^
This measure counts the portion of individuals who are part of families whose out-of-pocket spending on health care accounted for more than 10 percent of their annual income. Breakdowns for this measure are available for race/ethnicity, income levels, and also employer insurance coverage. Estimates are available for three clusters of years: 2010-2012, 2013-2017, and 2017-2020.
Medical Out-of-Pocket Spending
This measure provides an estimate of the average out-of-pocket costs of health care, or costs that are not covered by health insurance but paid for out of an individual’s own resources. These costs include premiums and medical expenses not covered by their medical plan, such as copays for doctor and dentist visits, diagnostic tests, prescription medicine, glasses and contacts, and medical supplies, among others. Data are available for years 2017-2020 and can be broken down by employer health insurance coverage.
Estimates for a majority of measures from several categories (Access to Care, Cost of Care, Health Behaviors, and Health Outcomes) have now been updated from the Behavior Risk Factor Surveillance System (BRFSS), which surveys adults 18+ regarding health-related risk behaviors, chronic health conditions, and use of preventive services, and is conducted by the Centers for Disease Control and Prevention.
Measures that have been updated from the BRFSS include:
Adults Who Forgo Needed Medical Care*
The measure indicates the percent of adults (18+) in each state who could not get needed medical care due to cost. Breakdowns by education level, race/ethnicity, and also now for chronic health status, are available for all states from 2005 through 2010 and 2011 through 2020.
Adults With No Personal Doctor*
This measure presents the percent of adults without a personal doctor and is now available for all states from 2005 through 2010 and 2011 through 2020. Breakdowns by education level and race/ethnicity are also available.
Chronic Disease Prevalence*
Data for this measure captures the percent of adults who reported having one or more common chronic conditions such as diabetes, cardiovascular disease, heart attack, stroke, and asthma, in each state. Estimates are now available for all states from 2005 through 2010 and 2011 through 2019.
Adult Cancer Screening*
Estimates for this measure, which are now available for all states from 2005 through 2010 and 2011 through 2020, show the percentage of adults who have received the recommended cancer screenings.
Adult Unhealthy Days
There are a multitude of options for this measure, which shows the average number of days when an adult's physical health or mental health was not good during the past 30 days. Users can view estimates solely by reported mentally unhealthy days, physically unhealthy days, or a combination of both (which is capped at a total of 30 days). Estimates for each version of this measure are available for 2011 to 2020 and possible breakdowns include age, insurance coverage type, household income categories, disability status, education levels, and race/ethnicity.
Activities Limited due to Health Difficulty*
This measure reports the average number of days (in the last 30 days) for which an adult indicated their activity were limited stemming from either mental or physical health difficulties. Data is available for all states from 2005 through 2010 and 2011 through 2020, and can now be broken down by education level and race/ethnicity.
Adult Binge Drinking*
This measure indicates the percent of adults who have consumed at least four drinks (women) or five (men) or more on one occasion during the past 30 days. Now available for all states from 2005 through 2010 and 2011 through 2020, the measure includes breakdowns by education level and race/ethnicity.
Adult Smoking*
This measure indicates the percent of adults over 18 years of age who have smoked 100 or more cigarettes in their lifetime as well those who currently smoke at least some days or every day. Estimates are available for all states from 2005 through 2010 and 2011 through 2020, with breakdowns offered by education level and race/ethnicity.
Notes: For the measure marked with a “^”: This indicates a break in series for the CPS ASEC due to a redesign of the survey (2013) as well as the redesign of their processing system (2017). All measures marked with an “*”: This indicates a break in series due to the BRFSS implementing cell phone sampling and an advanced weighting method in 2011.
Blog & News
Explore Physician Acceptance of New Medicaid Patients through Two New Measures on SHADAC’s State Health Compare and in a New MACPAC Factsheet
August 5, 2021:Authors: Robert Hest and Julia Ngep
In order for the more than 80 million Medicaid beneficiaries to access needed care in a timely manner, there must be a sufficient number of health care providers to serve these patients. There has long been concern that providers are less likely to accept Medicaid patients than patients with other types of health insurance coverage. Because Medicaid policies—and providers’ responses to those policies—differ substantially across states, state-level data is critical for monitoring the providers’ decisions to accept Medicaid patients and for understanding the factors that influence those decisions.
Using data from the 2011-2017 National Electronic Health Records Survey (NEHRS),1 SHADAC performed an analysis to examine and compare physician acceptance of new Medicaid patients at the state level and by physician and practice characteristics. This analysis was performed under contract with the Medicaid and CHIP Payment and Access Commission (MACPAC) and is presented in two new measures on SHADAC’s State Health Compare web tool as well as in a new MACPAC factsheet.
State Health Compare Measures
 Physicians who accept new patients
Physicians who accept new patients measures the percent of physicians who accept new patients by type of coverage: private, Medicare, and Medicaid. Data years were pooled where single-year estimates were not possible and are available for 2011-2013 and 2014-2017.
In 2014-2017, state-level physician acceptance of Medicaid patients ranged from 42.2 percent in New Jersey to 99.4 percent in North Dakota, acceptance of Medicare patients ranged from 77.1 percent in Georgia to 98.3 percent in North Dakota, and acceptance of private patients ranged from 80.3 percent in the District of Columbia (D.C.) to 100.0 percent in Nebraska.
Physicians who accept new Medicaid patients
Physicians who accept new Medicaid patients measures the percent of physicians who accept new Medicaid patients by the following physician/practice characteristics:
- Setting (private solo/group versus total) available for pooled data years 2011-2012 and 2014-2017;
- The share of Medicaid existing patients (above versus below national average) available for pooled data years 2011 & 2013 and 2014-2017;
- And the ratio of mid-level providers (above versus below national average) available for pooled data years 2014-2017.
At the national level in the most recent time period: physicians in private solo/group practices were less likely to accept new Medicaid patients compared to all physicians (70.4% versus 74.0%); physicians with an above-average share of existing Medicaid patients were more likely to accept new Medicaid patients compared to all physicians (87.4% versus 63.8%); and physicians with an above-average ratio of mid-level providers were more likely to accept new Medicaid patients compared with all physicians (80.5% versus 73.7%).
New MACPAC Factsheet
 Physician Acceptance of New Medicaid Patients: Findings from the National Electronic Health Records Survey
This new MACPAC factsheet analyzes physician acceptance of new Medicaid patients at the national and state levels. As Medicaid programs vary by each state and there is little information on physician participation in Medicaid at the state level, this analysis provides an important update of previous MACPAC work analyzing physician acceptance at the national level and prior literature analyzing state-level physician acceptance, last updated for data year 2013.
The analysis found significant differences in rates of physician acceptance of new patients by coverage type, with physicians being more likely to accept private and Medicare patients compared with Medicaid patients. Acceptance of Medicaid patients varied significantly by state and by various patient, physician, and practice characteristics. These include source of patient coverage (Medicaid, Medicare, and private), physician specialty, practice setting, existing Medicaid caseload, and presence of mid-level providers. The analysis found that nationally, rates of physician acceptance were stable over time and increased significantly in a handful of states, with no states experiencing significant decreases in rates of acceptance.
1 Data for 2016 was not released by National Center for Health Statistics (NCHS), which conducts the NEHRS. Data were unavailable by setting in data year 2013; data were unavailable by share of existing Medicaid patients for data year 2012; and data were unavailable by ratio of mid-level providers for data years 2011-2013.
Blog & News

Tracking Broadband Access to Monitor Access to Care
August 4, 2021:The dramatic growth of telehealth during the COVID-19 pandemic has highlighted the crucial role of broadband access in ensuring that people can obtain healthcare services. Broadband has allowed individuals to leverage telehealth technology to receive care from providers in ways that minimize the risk of COVID-19 transmission while eliminating certain access barriers regarding transportation and/or travel time. However, individuals who lack access to broadband services can face healthcare inequities as they are unable to utilize virtual services. Although COVID-19 vaccination rates are on the rise across the United States, the resurgence of cases due to the Delta variant of COVID-19 may lead to more required virtual visits. In addition, virtual access to care will remain important for individuals who live in rural areas, have transportation or mobility limitations, or otherwise would have difficulty visiting a care provider in person, even after the pandemic subsides.
Broadband Access Across the Country
Despite the important role of broadband access in obtaining virtual healthcare services, not everyone lives in a household that has broadband. Estimates from a SHADAC analysis of the American Community Survey (ACS) Public Use Microdata Sample (PUMS) files indicate that in 2019, 86.3 percent of families nationwide had access to broadband in their households.1 Among the states, household broadband access ranged from a high of 91.2 percent in Washington to a low of 76.9 percent in Mississippi.1 Higher rates of broadband access are clustered in states on the West Coast and the Northeast shore. States that have more rural populations tend to have lower access to broadband, with a concentration of limited access in the Southeast.1
Percent of households with a broadband internet subscription, 2019
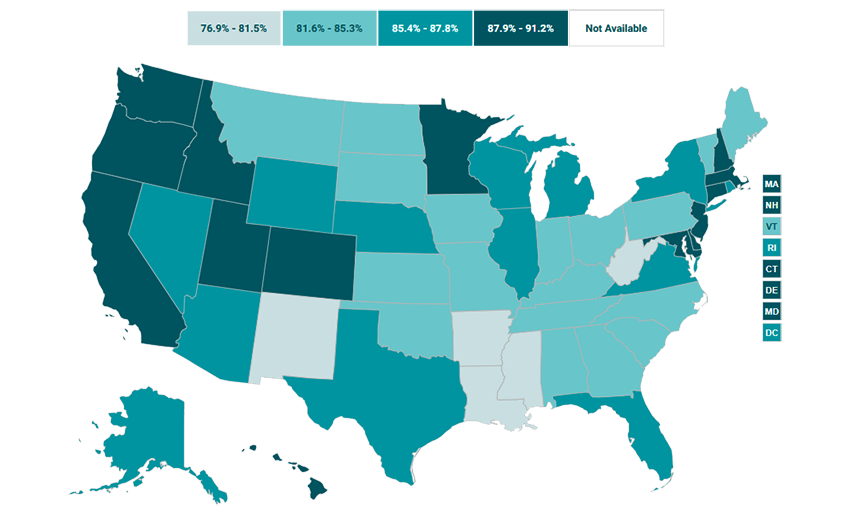
Source: SHADAC analysis of the 2019 American Community Survey (ACS) Public Use Microdata Sample (PUMS) files.
Broadband Access in Minnesota: Above Average, with Plans to Expand
In Minnesota, 87.9 percent of households had access to broadband in their homes in 2019, placing the state higher than the national average and with the 14th highest access to broadband across the states.1 However, the nearly 12 percent of Minnesota households that do not have broadband access also tend to face other factors that can reduce access to healthcare, like living in less dense counties, which tend to have fewer medical providers and require patients to travel farther to access medical facilities.2 In order to improve healthcare accessibility in these areas, Minnesota legislators have agreed to invest an additional $70 million in broadband coverage expansion through the Border-to-Border grant program.3 This program assists with infrastructure installation costs that broadband providers may experience when offering services to an area that has been historically unserved or underserved.3 While this grant program is not expected to expand broadband services to every household in Minnesota, it is one of the largest investments in broadband access in the state since 2014.3
Conclusion
Broadband internet has been vital for accessing healthcare during the COVID-19 pandemic. However, not every family in the U.S. has access to broadband, and this lack of access is distributed unevenly among the states. Less than 80 percent of households in Mississippi and New Mexico (76.9 percent and 78.9 percent, respectively) have broadband access while over 90% of households in Utah, Colorado, and Washington (90.5 percent, 91.1 percent, and 91.2 percent, respectively) have access to broadband internet.1 As telehealth continues to play a role in getting needed services to individuals who face barriers to obtaining care in person, it is important to monitor broadband access as an indicator of access to care.
About the Data
The data cited here can be accessed through SHADAC’s online data tool, State Health Compare, using the measure “Percent of households with a broadband internet subscription” for the years 2016-2019. The estimates come from SHADAC’s analysis of the American Community Survey (ACS) Public Use Microdata Sample (PUMS).
1 Percent of households with a broadband internet subscription. State Health Compare, SHADAC, University of Minnesota website. http://statehealthcompare.shadac.org/map/232/percent-of-households-with-a-broadband-internet-subscription-by-total#a/27/266. Accessed July 21, 2021.
2 Estimated availability of wireline broadband service by county in the state of Minnesota—Areas served by at least 25 Mbps download/3 Mbps upload. Connected Nation. https://mn.gov/deed/assets/county-bb-service-availability_tcm1045-255846.pdf. Published April 2021. Accessed July 21, 2021.
3 Orenstein W. Minnesota lawmakers agree to spend $70 million on improving broadband access across the state. MinnPost. June 1, 2021. https://www.minnpost.com/greater-minnesota/2021/06/minnesota-lawmakers-agree-to-spend-70-million-on-improving-broadband-access-across-the-state/. Accessed July 21, 2021.