The arrival of the novel coronavirus (COVID-19) has fundamentally changed the way we work, live, and seek health care. As more and more of the population across the United States is being asked to stay in their homes to assist the efforts toward containment and prevention of the virus, access to the internet has become a vital lifeline for families and individuals to keep in touch with their loved ones, participate in online school activities, and to work from home. Several sectors (business, government, health care, education, etc.) have embraced internet service-based solutions to keep connected. These activities have centered around:
These shifts not only test the capabilities of our current broadband internet systems, but also bring into sharp relief an issue commonly known as the “digital divide,” or the divide between individuals who have access to telecommunications and internet service (including the ability to connect to broadband in-home) and those who do not.2
SHADAC has added a new measure to our state data web tool, State Health Compare, to provide information about the digital divide at the state level and for key subpopulations: the percentage of households with access to broadband internet services. From an initial analysis of the newly available estimates, our findings show variation in access to broadband across states, and reveal disparities by income, rurality, coverage, and disability status.* We discuss these findings in more detail below.
State Variation in Internet Access
Rates of broadband internet access ranged substantially across states in 2018, from a high of 89.9 percent in Utah to a low of 76.4 percent in Mississippi. When compared to the national rate (85.0 percent)...
Access to Broadband Internet Service by…
Household Income
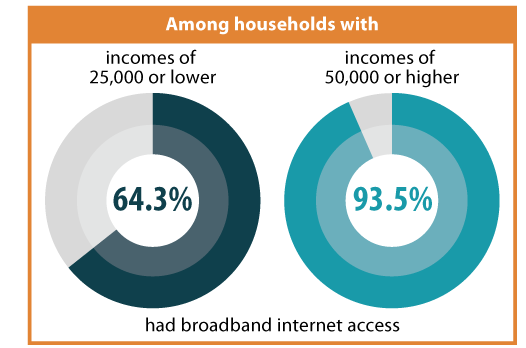
Nationally, households with incomes of $50,000 or higher were 45 percent more likely to have broadband internet access than households with incomes less than $25,000 (93.5 percent vs. 64.3 percent).
- In all 50 states and D.C., households with incomes $50,000 or higher were over 25 percent more likely to have broadband internet access than households with less than $25,000 in income.
- In 17 states, this disparity of access rose to 50 percent when comparing households with incomes $50,000 or higher to households with less than $25,000 in income.
Metropolitan Area
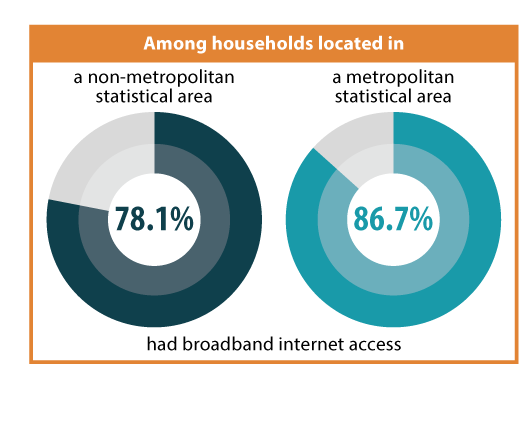
Nationally, households that were located in a metropolitan statistical area (MSA) were 11 percent more likely to have broadband internet access than households located in a non-metropolitan area (86.7 percent vs. 78.1 percent). Among the 44 states where estimates of broadband internet access by MSA/non-MSA were available:
- Households located in metropolitan areas had higher rates of broadband internet access than households in non-metropolitan areas in 39 states.
- In nine states (Alaska, Arizona, Arkansas, Florida, Georgia, Hawaii, Louisiana, Mississippi, Virginia), households located in metropolitan areas were over 20 percent more likely to have broadband internet access than their non-metropolitan counterparts.
- In Arizona, the disparity in access rose to over 60 percent when comparing metropolitan to non-metropolitan households.
Medicaid Coverage
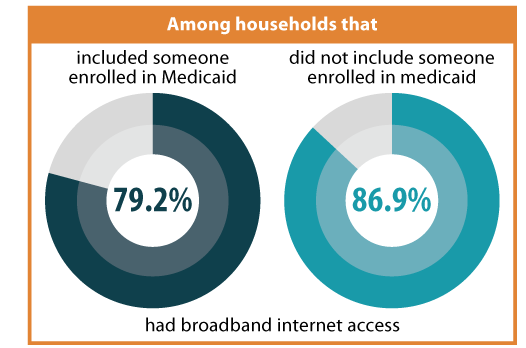
Nationally, households that included someone enrolled in Medicaid were approximately 9 percent less likely to have broadband internet access than households that did not include an individual with Medicaid coverage (79.2 percent vs. 86.9 percent).
- In 19 states (including DC), households that included someone with Medicaid coverage were over 10 percent less likely to have internet access than households that did not include a Medicaid enrollee.
- This gap in access more than doubled in D.C., where households that included someone with Medicaid coverage were over 20 percent less likely (21.4 percent) to have internet access than households not including a Medicaid enrollee.
Disability Status
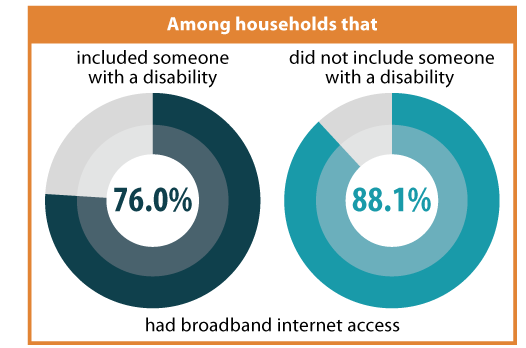
Nationally, households that included someone with a disability were approximately 14 percent less likely to have broadband internet access than households that did not include anyone with a disability (76.0 percent vs. 88.1 percent).
- In 23 states (including D.C.), households that included someone with a disability were over 15 percent less likely to have internet access than households that did include someone with a disability.
- In four states (Alabama, Maine, Minnesota, and Mississippi) and D.C., households that included someone with a disability were over 17 percent less likely to have internet access than households that did not.
Discussion
The lack of equitable access to broadband internet services across all households has been an issue of concern among health care experts even prior to the coronavirus pandemic. Initially, the problem of digital divide was studied in terms of barriers to health plan application and enrollment during the rollout of the newly developed online health insurance marketplace.3
Now, in light of recent events, lack of access to broadband internet services has also emerged as a potential challenge to efforts to respond to the coronavirus; not only in preventing individuals from accessing the real-time information they need surrounding COVID-19, but also in lost chances for utilization of telemedicine services, ability to work remotely, keeping pace with an e-learning curriculum, or to help mitigate the dangers of social isolation while practicing social distancing.4
Notes and Definitions
* All differences described in this blog are statistically significant at the 95% confidence level unless otherwise specified.
In the definition of the new State Health Compare measure, a broadband subscription includes a cellular data plan, cable, fiber optic, or DSL or satellite internet service. Households with a broadband subscription only include those who pay a cell phone or internet provider for the service. The percent of households that have access to broadband without paying for it is relatively small (approximately 3% in 2018).
Households' metropolitan status is determined at the public use microdata area (PUMA) level. Households are classified as “metropolitan” if their PUMA lies entirely inside a metropolitan statistical area (MSA) and are classified as “non-metropolitan” if their PUMA lies entirely outside an MSA.
“Medicaid enrollment” is defined as at least one person in the household having Medicaid coverage and “disability” is defined as at least one person of the household having a functional disability.
Related Resources
General Provider Telehealth and Telemedicine Tool Kit
The Coronavirus Outbreak Could Finally Make Telemedicine Mainstream in the U.S.
Opportunities to Expand Telehealth Use amid the Coronavirus Pandemic
Connectivity Considerations for Telehealth Programs
Telemedicine during COVID-19: Benefits, limitations, burdens, adaptation
Growth of Telemedicine Slowed by Internet Access Challenges
References
1 One of the most publicized and recognizable notices recently came from the Centers for Medicare & Medicaid Services, which expanded Medicare telehealth services. Centers for Medicare & Medicaid Services (CMS). (2020, March 17). Medicare telemedicine health care provider fact sheet. https://www.cms.gov/newsroom/fact-sheets/medicare-telemedicine-health-care-provider-fact-sheet
2 Congressional Research Service. (2020, March 13). COVID-19 and broadband: Potential implications for the digital divide. https://crsreports.congress.gov/product/pdf/IN/IN11239
3 Boudreaux, M.H., Gonzales, G., & Blewett, L.A. (2016). Residential high-speed internet among those likely to benefit from an online health insurance marketplace. INQUIRY, 53, 1-7. https://doi.org/10.1177/0046958015625231
4 Henning-Smith, C. (2020, March 18). COVID-19 poses an unequal risk of isolation and loneliness. The Hill. https://thehill.com/opinion/healthcare/488215-covid-19-poses-an-unequal-risk-of-isolation-and-loneliness


