Publication
Suicide Rates on the Rise: Examining Continuing Trends and Variation across the Nation and in the States from 2000 to 2018
Among the numerous impacts resulting from the arrival of the coronavirus pandemic, early evidence from several recent national polls suggests that the COVID-19 crisis is taking a significant toll on mental health in the United States.1 While we will not be able to fully comprehend the extent of this toll until data on one important indicator of mental health, rates of suicide deaths, is released for the current period, examining estimates from 2018 (the most recent data year available) provides an important baseline from which to begin understanding potential shifts in the landscape of mental health and “deaths of despair” such as suicide as a result of COVID-19.
Death rates from suicide in the United States have been increasing at an alarming pace, rising from 10.4 to 14.2 per 100,000 people from 2000 to 2018 (an increase of 37 percent). This increase represents about 110,000 additional lives lost than if the U.S. suicide rate had remained steady. Suicide has killed over 700,000 people since 2000—more than the number killed by another, more well-known national epidemic, opioids, during the same time period
Suicide deaths have not only increased significantly over the past nearly two decades, but their growth is continuing a pattern of acceleration in more recent years: From 2000 to 2009 the suicide death rate grew by 13 percent, but from 2009 to 2018 the rate grew by 21 percent.
As part of an analysis aiming to shed more light on this growing public health concern, SHADAC researchers have produced two issue briefs that provide high-level information regarding trends in suicide deaths from 2000 to 2018. Each brief presents historical context for the troubling recent acceleration in the rise of suicide rates and mortality in the United States, and examines trends in suicide-related mortality across the nation and states, and among specific population subgroups. Click on the briefs below to download.
Sources
Data on Suicide Deaths are available from SHADAC’s State Health Compare tool and were recently updated to include estimates from 2018, the latest data year available. This measure can be viewed by demographics including age, gender, race/ethnicity, metropolitan status, and cause of death. Estimates on State Health Compare come from the Centers for Disease Control and Prevention (CDC), National Center for Health Statistics via the CDC WONDER Database.
National Suicide Prevention Lifeline: 1-800-273-8255
If you’re thinking about suicide, are worried about a friend or loved one, or would like emotional support, the Lifeline network is available 24/7 across the United States. For more suicide prevention resources, visit https://suicidepreventionlifeline.org/
1 Kirzinger, A., Hamel, L., Muñana C., Kearney, A., & Brodie, M. (2020, April 24). KFF Health Tracking Poll – Late April 2020: Coronavirus, Social Distancing, and Contact Tracing. Retrieved from https://www.kff.org/report-section/kff-health-tracking-poll-late-april-2020-economic-and-mental-health-impacts-of-coronavirus/
Planalp, C., Alarcon, G., & Blewett, L. (2020, May 26). 90 percent of U.S. adults report increased stress due to pandemic. Retrieved from https://shadac.org/SHADAC_COVID19_Stress_AmeriSpeak-Survey
Publication
SHADAC COVID-19 Survey Results
The SHADAC COVID-19 Survey on the impacts of the coronavirus pandemic on health care access and insurance coverage was conducted as part of the AmeriSpeak omnibus survey conducted by NORC at the University of Chicago. The survey was conducted using a mix of phone and online modes from April 24 and 26, 2020, among a nationally representative sample of 1,007 respondents age 18 and older.
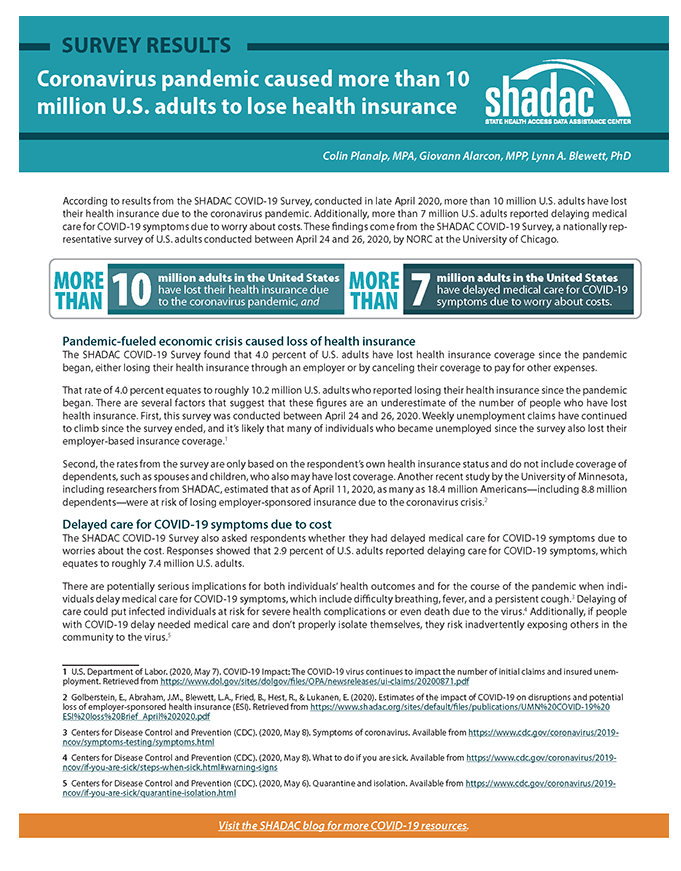
These briefs highlight key results from the survey, relating to loss of health insurance coverage, delayed medical care due to cost, and increased stress due to the coronavirus pandemic, for a nationally representative sample of U.S. adults (age 18 and older).
Blog & News
90 percent of U.S. adults report increased stress due to pandemic
May 26, 2020:Colin Planalp, MPA, Giovann Alarcon, MPP, Lynn A. Blewett, PhD,
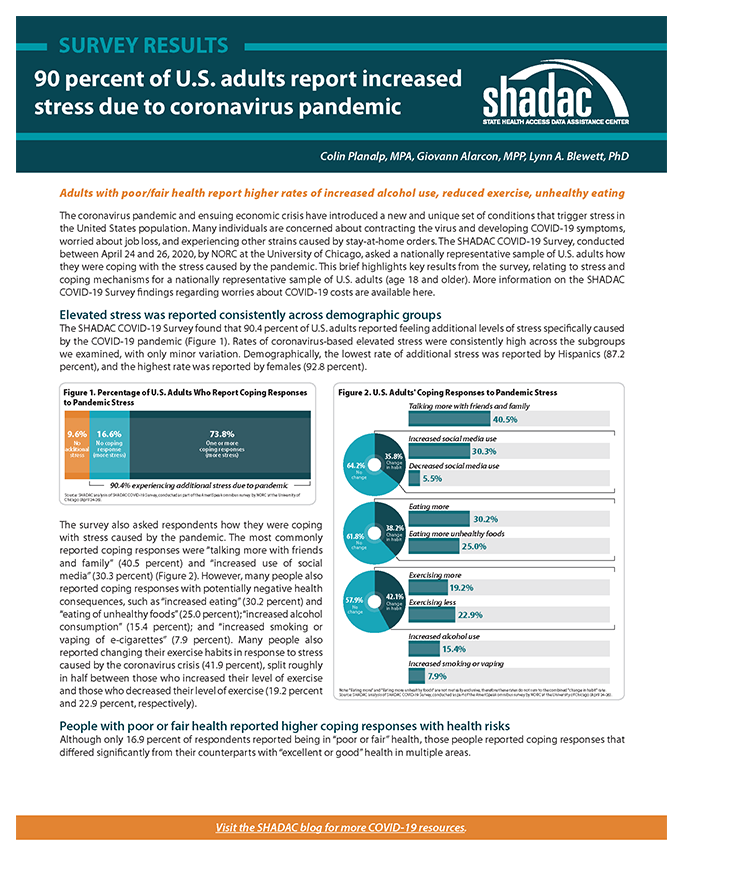
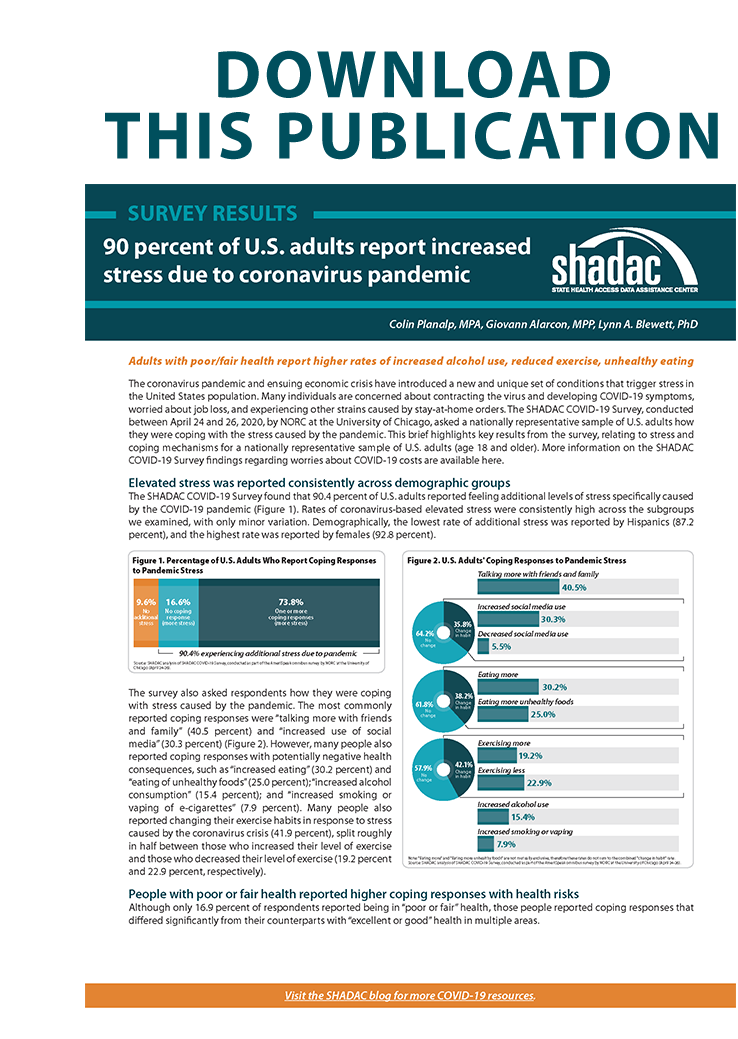
The coronavirus pandemic and ensuing economic crisis have introduced a new and unique set of conditions that trigger stress in the United States population. Many individuals are concerned about contracting the virus and developing COVID-19 symptoms, worried about job loss, and experiencing other strains caused by stay-at-home orders. The SHADAC COVID-19 Survey, conducted between April 24 and 26, 2020, by NORC at the University of Chicago, asked a nationally representative sample of U.S. adults how they were coping with the stress caused by the pandemic. This brief highlights key results from the survey, relating to stress and coping mechanisms for a nationally representative sample of U.S. adults (age 18 and older). More information on the SHADAC COVID-19 Survey findings regarding worries about COVID-19 costs are available here.
Elevated stress was reported consistently across demographic groups
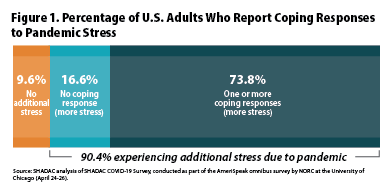
The SHADAC COVID-19 Survey found that 90.4 percent of U.S. adults reported feeling additional levels of stress specifically caused by the COVID-19 pandemic (Figure 1). Rates of coronavirus-based elevated stress were consistently high across the subgroups we examined, with only minor variation. Demographically, the lowest rate of additional stress was reported by Hispanics (87.2 percent), and the highest rate was reported by females (92.8 percent).
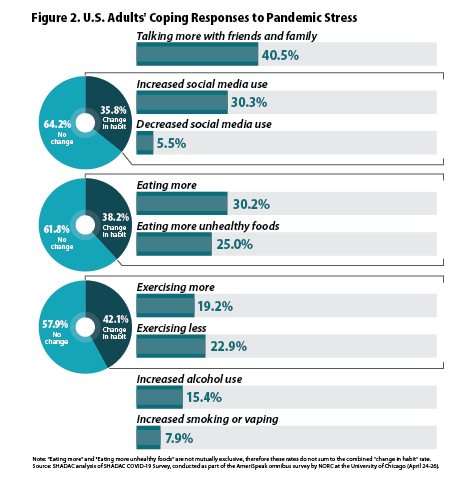
 The survey also asked respondents how they were coping with stress caused by the pandemic. The most commonly reported coping responses were “talking more with friends and family” (40.5 percent) and “increased use of social media” (30.3 percent) (Figure 2). However, many people also reported coping responses with potentially negative health consequences, such as “increased eating” (30.2 percent) and “eating of unhealthy foods” (25.0 percent); “increased alcohol consumption” (15.4 percent); and “increased smoking or vaping of e-cigarettes” (7.9 percent). Many people also reported changing their exercise habits in response to stress caused by the coronavirus crisis (41.9 percent), split roughly in half between those who increased their level of exercise and those who decreased their level of exercise (19.2 percent and 22.9 percent, respectively).
People with poor or fair health reported higher coping responses with health risks
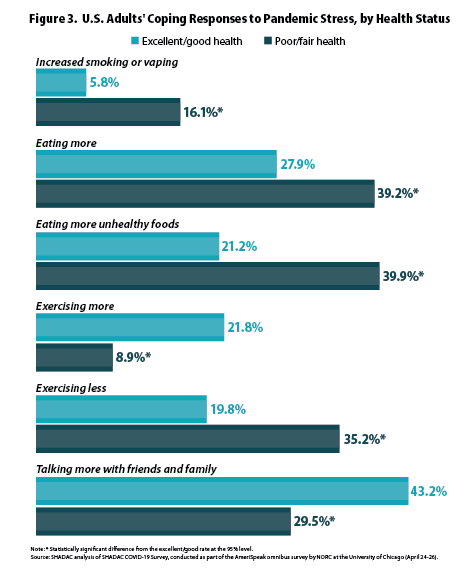
Although only 16.9 percent of respondents reported being in “poor or fair” health, those people reported coping responses that differed significantly from their counterparts with “excellent or good” health in multiple areas.
Increased smoking or vaping
People with poor/fair health reported increased smoking or vaping at rates almost triple those of people with excellent/good health (16.1 percent vs. 5.8 percent), which was a statistically significant difference (Figure 3).
Eating more and eating unhealthy foods
People with poor/fair health reported increased consumption of unhealthy foods at almost double the rate of people with excellent/good health (39.9 percent vs. 21.2 percent), while also reporting higher rates of increased eating (39.2 percent vs. 27.9 percent)—both of which were statistically significant differences.
Less exercise
People with poor/fair health also were more likely to report reduced exercise in response to pandemic stress than people with excellent/good health (35.2 percent vs. 19.8 percent), and they were correspondingly less likely to report exercising more in response to pandemic stress (8.9 percent vs. 21.8 percent). Both of these differences in rates of exercise were statistically significant.
Social connections
As with the other indicators listed in the SHADAC COVID-19 Survey, people with poor/fair health were significantly less likely to report talking more with friends and family to cope with stress than their counterparts with excellent/good health (29.5 percent vs. 43.2 percent).
Coping responses with health risks also found among other subpopulations
The SHADAC COVID-19 Survey also found that certain coping responses with greater potential health risks were more prevalent within other subpopulations:
Higher alcohol consumption by younger adults
Younger adults (age 18-29) were significantly more likely to report increased alcohol consumption than elderly adults (age 65 and older), who had the lowest rate (23.5 percent vs. 4.0 percent), as well as unhealthy changes in eating (eating more, eating more unhealthy foods) as compared with elderly adults, who again reported the lowest rate (48.2 percent vs. 27.1 percent). Younger adults were also significantly more likely to report increased social media use than elderly adults (41.2 percent vs. 23.8 percent).
Females reported higher unhealthy eating habits
Females were more likely to report changes in unhealthy eating (eating more, eating more unhealthy foods) than males (43.2 percent vs. 32.9 percent). Females also were significantly more likely than males to report talking more with friends or family (46.9 percent vs. 33.6 percent), and more likely to report increased social media use (36.5 percent vs. 23.8 percent).
Higher smoking and vaping by people with high school or less education
People with a high school education or less were significantly more likely to report increased smoking or vaping than people with a bachelor’s degree or more (11.9 percent vs. 5.3 percent). They also were less likely to report exercising more (12.5 percent vs. 27.6 percent).
People with higher incomes were more likely to report increased exercise
People with incomes of $100,000 or more were significantly more likely to report increased levels of exercising than those with incomes of less than $30,000 (30.1 percent vs. 11.9 percent). Conversely, people with incomes below $30,000 were significantly more likely to report greater unhealthy eating habits (eating more, eating more unhealthy foods) (44.2 percent vs. 31.6 percent).
Conclusion
Coping strategies are a natural response to increased stress levels due to concerns about the coronavirus pandemic. From the results of the SHADAC COVID-19 Survey, we found variation in coping responses by age, sex, education and income. However, some of the most distinctive differences in stress-coping responses were among people reporting poor or fair health, who reported higher rates of responses with potentially negative health impacts, such as increased alcohol consumption, reduced exercise and unhealthy eating habits. People with poor or fair health also reported lower rates of talking more with friends and family, raising concerns about greater social isolation for these people at a time when stay-at-home-orders have been official policies in many states.
It is critical that individuals are aware of their stress levels and the methods by which they are using to cope, and make sure that they take care of themselves and others. It is also critical to reach out to people with poorer health, who may need increased social supports during times of an economic and public health crisis. The U.S. Centers for Disease Control and Prevention (CDC) recommends the following activities as ways to deal with stress 1:
- Take breaks from the news.
- Take care of your body, including eating well-balanced healthy meals, exercise, get enough sleep, and avoid alcohol and drugs.
- Schedule time to unwind and do activities that you enjoy.
- Connect with others, including people you trust, family, and friends.
Moderating stress levels with healthy behaviors can contribute to an overall feeling of health and wellbeing that is important to cultivate during this time of an unprecedented pandemic.
1 Centers for Disease Control and Prevention (CDC). (2020, April 30). Stress and coping. Retrieved from https://www.cdc.gov/mentalhealth/cope-with-stress/index.html
Blog & News
An Updated Brief Examines State Health Compare Estimates on State Funding for Public Health
May 13, 2020: As states have urgently strategized responses to the sudden arrival of the initial wave of the coronavirus pandemic and begun to prepare for the possibility of a second wave in the fall, states’ per-capita public health funding is a metric that has garnered new attention. Estimates for this measure not only reveal a state’s prioritization of investment in public health infrastructure, but also levels of preparedness for health emergencies such as COVID-19. With this understanding, a number of media outlets have used the public health spending rankings chart provided by SHADAC’s State Health Compare to publish articles which highlight the challenges that states on the lower end of the public health spending spectrum now face in attempting to respond to the COVID-19 crisis.
In light of this information, and with the release of the latest estimates for public health spending for 2019, SHADAC has just recently updated our brief on estimates of state-provided funding for the State Health Compare measure, “Public Health Funding.” Though this updated brief highlights state public health funding data from 2015–2019, data is available on the State Health Compare website for every year, starting in 2005 (with the exception of data year 2006 for which no estimates are available).
The Big Picture: Wide Variation between States
There is a wide gap between state public health funding among states, with 2019 state-provided funding ranging from $7 per capita in Missouri to $363 per capita in the District of Columbia (D.C.). In 2019, the median state, Kentucky spent $35 per capita in public health funding.
Per Person Public Health Funding, 2019

Top States for State Public Health Funding
Eight states occupied the top five funding spots over the course of five years, from 2015 through 2019 (the most recent five years for which data are available): Alaska, D.C., Hawaii, Idaho, New Mexico, New York, North Dakota, and West Virginia. Alaska, D.C., and Hawaii were among the top five states for each of the five years. In 2019, the top five states for per-capita state public health funding were Alaska, D.C., Hawaii, Idaho, and New Mexico.
Bottom States for Public Health Funding
Eight states also occupied the bottom five funding spots at various times over the five-year period (2015 through 2019). Arizona, Indiana, Kansas, Mississippi, Missouri, Nevada, North Carolina, and Ohio moved among the bottom five positions for state-provided public health funding during this time period. Both Missouri and Nevada consistently ranked among the bottom five states for each year of this period. In 2019, the bottom five states with regard to public health spending were: Kansas, Missouri, Nevada, North Carolina, and Ohio.
About the Estimates
Estimates of state funding for public health come from data collected by Trust for America's Health (TFAH), which obtains its calculations using budget documents that are publicly available through state government websites. Depending on which information is available, TFAH uses executive budget documents listing actual expenditures, estimated expenditures, or final appropriates; appropriations bills enacted by the state's legislature; and documents from legislative analysis offices to calculate public health spending. TFAH defines "public health" broadly to include most state-level health funding with the exception of Medicaid, CHIP, or comparable health coverage programs. SHADAC standardizes these estimates of state public health funding to the estimated population of each state to create per-capita estimates.
Why the Variation among States on this Measure?
According to Trust for America's Health, comparisons of public health funding levels across states are difficult because every state allocates and reports its budget in different ways, and states vary widely in the budget details they provide. Non-methodological sources of inter-state variation in state public health funding may also include the relative performance of individual state economies (since state public health funding is often cut during economic downturns) as well as the relative tax bases of individual states along with state population counts.
Explore Additional Public Health Data at State Health Compare
Visit State Health Compare to explore national and state-level estimates for the following public health indicators:
- Weight Assessment in Schools
- School Nutrition Standards Stronger than USDA
- School Required to Provide Physical Activity
- Smoke Free Campuses
- Cigarette Tax Rates
State Health Compare also features a number of other indicator categories, including: health insurance coverage, cost of care, access to and utilization of care, care quality, health behaviors, health outcomes, and social determinants of health.
Blog & News
Studying the Impact of COVID-19: State-Level Data Resources on State Health Compare
April 20, 2020:Though the spread of disease caused by the novel coronavirus (COVID-19) has impacted the lives of individuals across the United States, the magnitude of the virus' effects has varied greatly across different states. Access to current, accurate state-level data is important in order to inform state researchers, analysts, and policymakers’ efforts to understand and respond to the disparate impacts of COVID-19 on their resident populations.
To that end, this blog provides a high-level overview of a range of data measures currently housed in our online data tool, State Health Compare, as well as a number of related resources that provide more in-depth analysis for certain measures. Notably, estimates for each of the measures listed are available for subpopulations that often highlight persistent disparities in health—a feature that may prove especially useful as calls to further break down data related to COVID-19 into subcategories (e.g., gender, age, race/ethnicity, etc.) to track the impact of the disease on specific populations have recently increased.
Risk Factors
Chronic Disease Prevalence
This measure captures the percent of adults who reported having one or more common chronic conditions such as diabetes, cardiovascular disease, heart attack, stroke, or asthma. It includes breakdowns by race/ethnicity and educational attainment. (2005-2010, 2011-2019)*
Adult Smoking
This measure shows the percent of adults who reported smoking, defined as adults who have smoked 100 or more cigarettes in their lifetime and who currently smoke some days or every day. The measure is broken down by race/ethnicity and educational attainment. (2005-2010, 2011-2019)*
Related Resource: SHADAC researchers used data from the Behavioral Risk Factor Surveillance System (BRFSS) to produce analyses focused on several different health behaviors, including Adult Smoking and E-cigarette Use in the United States. This blog, part of a spotlight series including binge drinking and obesity, looks at national and state-level rates at which adults with different racial/ethnic backgrounds smoke and vape in 2018 and 2017.
State Health Funding
Medicaid Expenses as Percent of State Budget
This measure captures state and federal spending on Medicaid as a share of each state’s budget. (2000-2018)
Public Health Funding
This measure shows state public health funding per capita by fiscal year. (2005-2019; no data available for 2006)
Related Resource: SHADAC researchers produce an annual brief, Exploring Public Health Indicators with State Health Compare: State Public Health Funding, exploring the wide variation in per capita public health funding by state, and why public health funding data, in conjunction with state performance on other public health indicators, might signal which states are best suited to absorb a potential decrease in funding and which states might be hit hardest.
Access to Health Care
Had Usual Source of Medical Care
This measure counts the percent of people who had a usual source of medical care other than the emergency department (i.e., doctor’s office, clinic, health center, etc.) in the past year. Breakdowns by age and coverage type are also available. (2011-2017)
Adults with No Personal Doctor
This measure denotes the percent of adults without a personal doctor and offers breakdowns by education level and race/ethnicity. (2005-2010, 2011-2019)*
Related Resource: SHADAC recently produced a blog and infographic - Affordability and Access to Care in 2018: Examining Racial and Educational Inequities across the United States (Infographic) - focusing on racial/education inequities in access and ability to afford medical care, using this measure along with estimates for Adults Who Forgo Needed Medical Care.
Broadband Internet Access
This measure shows the percent of households that have a broadband internet subscription (i.e., that pay a cell phone or internet services provider for the service), which includes a cellular data plan, cable, fiber optic, DSL, or satellite internet service. (2016-2018)
Related Resource: A new SHADAC blog explores the way that Internet Access Measures the Impact of the Digital Divide and COVID-19. An initial analysis of the estimates shows variation in access to broadband across states, and reveals disparities by income, rurality, coverage, and disability status.
Insurance Coverage
Coverage Type
This measure shows the rates of different types of health insurance coverage, including Medicare, employer-sponsored insurance (ESI), Medicaid, and individual coverage, as well as no insurance coverage. Users can view this measure by a variety of breakdowns, including: age, citizenship, disability status, education, family income, health status, limited English proficiency, marital status, poverty level, race/ethnicity, sex, and work status. (2008-2018)
Health Care Costs and Affordability
People with High Medical Care Cost Burden
This measure highlights the percent of individuals in families where out-of-pocket health care spending, including premiums, has exceeded 10 percent of annual income. Breakdowns by employer coverage, income, and race/ethnicity are available for each state. (2010-2012, 2013-2017, 2017-2018)*
Medical Out-of-Pocket Spending
This measure estimates the annual median family “out-of-pocket” spending, including premiums, on health care costs that are typically not covered by health insurance but paid for out of an individual’s own resources. These costs can include copays for doctor and dentist visits, diagnostic tests, prescription medicine, glasses and contacts, and medical supplies. (2017-2018)
Related Resource: SHADAC used this measure to produce a brief entitled State-level Estimates of Medical Out-of-Pocket Spending for Individuals with Employer-sponsored Insurance Coverage, which shows state variation in medical out-of-pocket spending (with a brief section that also looks at high medical cost burden) for people with employer-sponsored insurance.
High-Deductible Health Plans
This measure reports the percent of private-sector employees enrolled in high-deductible health insurance plans. High-deductible health plans are defined as plans that meet the minimum deductible amount required for Health Savings Account (HSA) eligibility (e.g., $1,350 for an individual and $2,700 for a family in 2018); breakdowns by firm size are offered. (2012-2019)
Average Annual ESI Deductible and Average Annual ESI Premium
This first measure reports the average annual deductible for private-sector workers who receive a health insurance plan through their employer that has a deductible. The second measure reports the average annual premium for private-sector workers who get health insurance through their employer. Both measures can be broken down by plan type (family or single). (2003-2019; partial data for 2002)
Related Resources: SHADAC produces an annual report, the latest being State-level Trends in Employer-sponsored Insurance (ESI), 2014-2018, focused on the more than 62 million private-sector employees enrolled in Employer-Sponsored Insurance (ESI) coverage and their growing out-of-pocket costs. The report includes a narrative summary, interactive map, two-page state profiles, and data tables.
From the data used to produce our annual ESI report, SHADAC researchers also created A Deeper Dive on Employer-sponsored Health Insurance: Costs in Five States in Comparison with the United States; a focused, five state analysis of ESI trends in order to better understand which states are most affected by increasing premiums and deductibles or might have a population with high enrollment in high-deductible health plans (HDHPs), leaving them financially vulnerable in case of an unexpected health crisis that leads to large medical bills.
Adults Who Forgo Needed Medical Care
The measure indicates the percent of adults in each state who could not get needed medical care due to cost. Breakdowns by education level and race/ethnicity are available for all states. (2005-2010, 2011-2019)
Related Resource: SHADAC recently produced a blog and infographic - Affordability and Access to Care in 2018: Examining Racial and Educational Inequities across the United States (Infographic) - focusing on racial/education inequities in access and ability to afford medical care, using this measure along with estimates for Adults with No Personal Doctor.
Trouble Paying Medical Bills
This measure tracks the rates of individuals who had difficulty paying off medical bills during the past twelve months or that were paying off medical bills over time. The measure can be broken down by age and insurance coverage type. (2011-2017)
Related Resource: In light of rising health care cost burdens, SHADAC produced a blog, Measuring Health Care Affordability with State Health Compare: Trouble Paying Medical Bills, assessing changes and patterns in health care affordability across the United States by tracking the percent of individuals that had difficulty paying off medical bills currently or over time.
Explore these measures on State Health Compare!
Notes
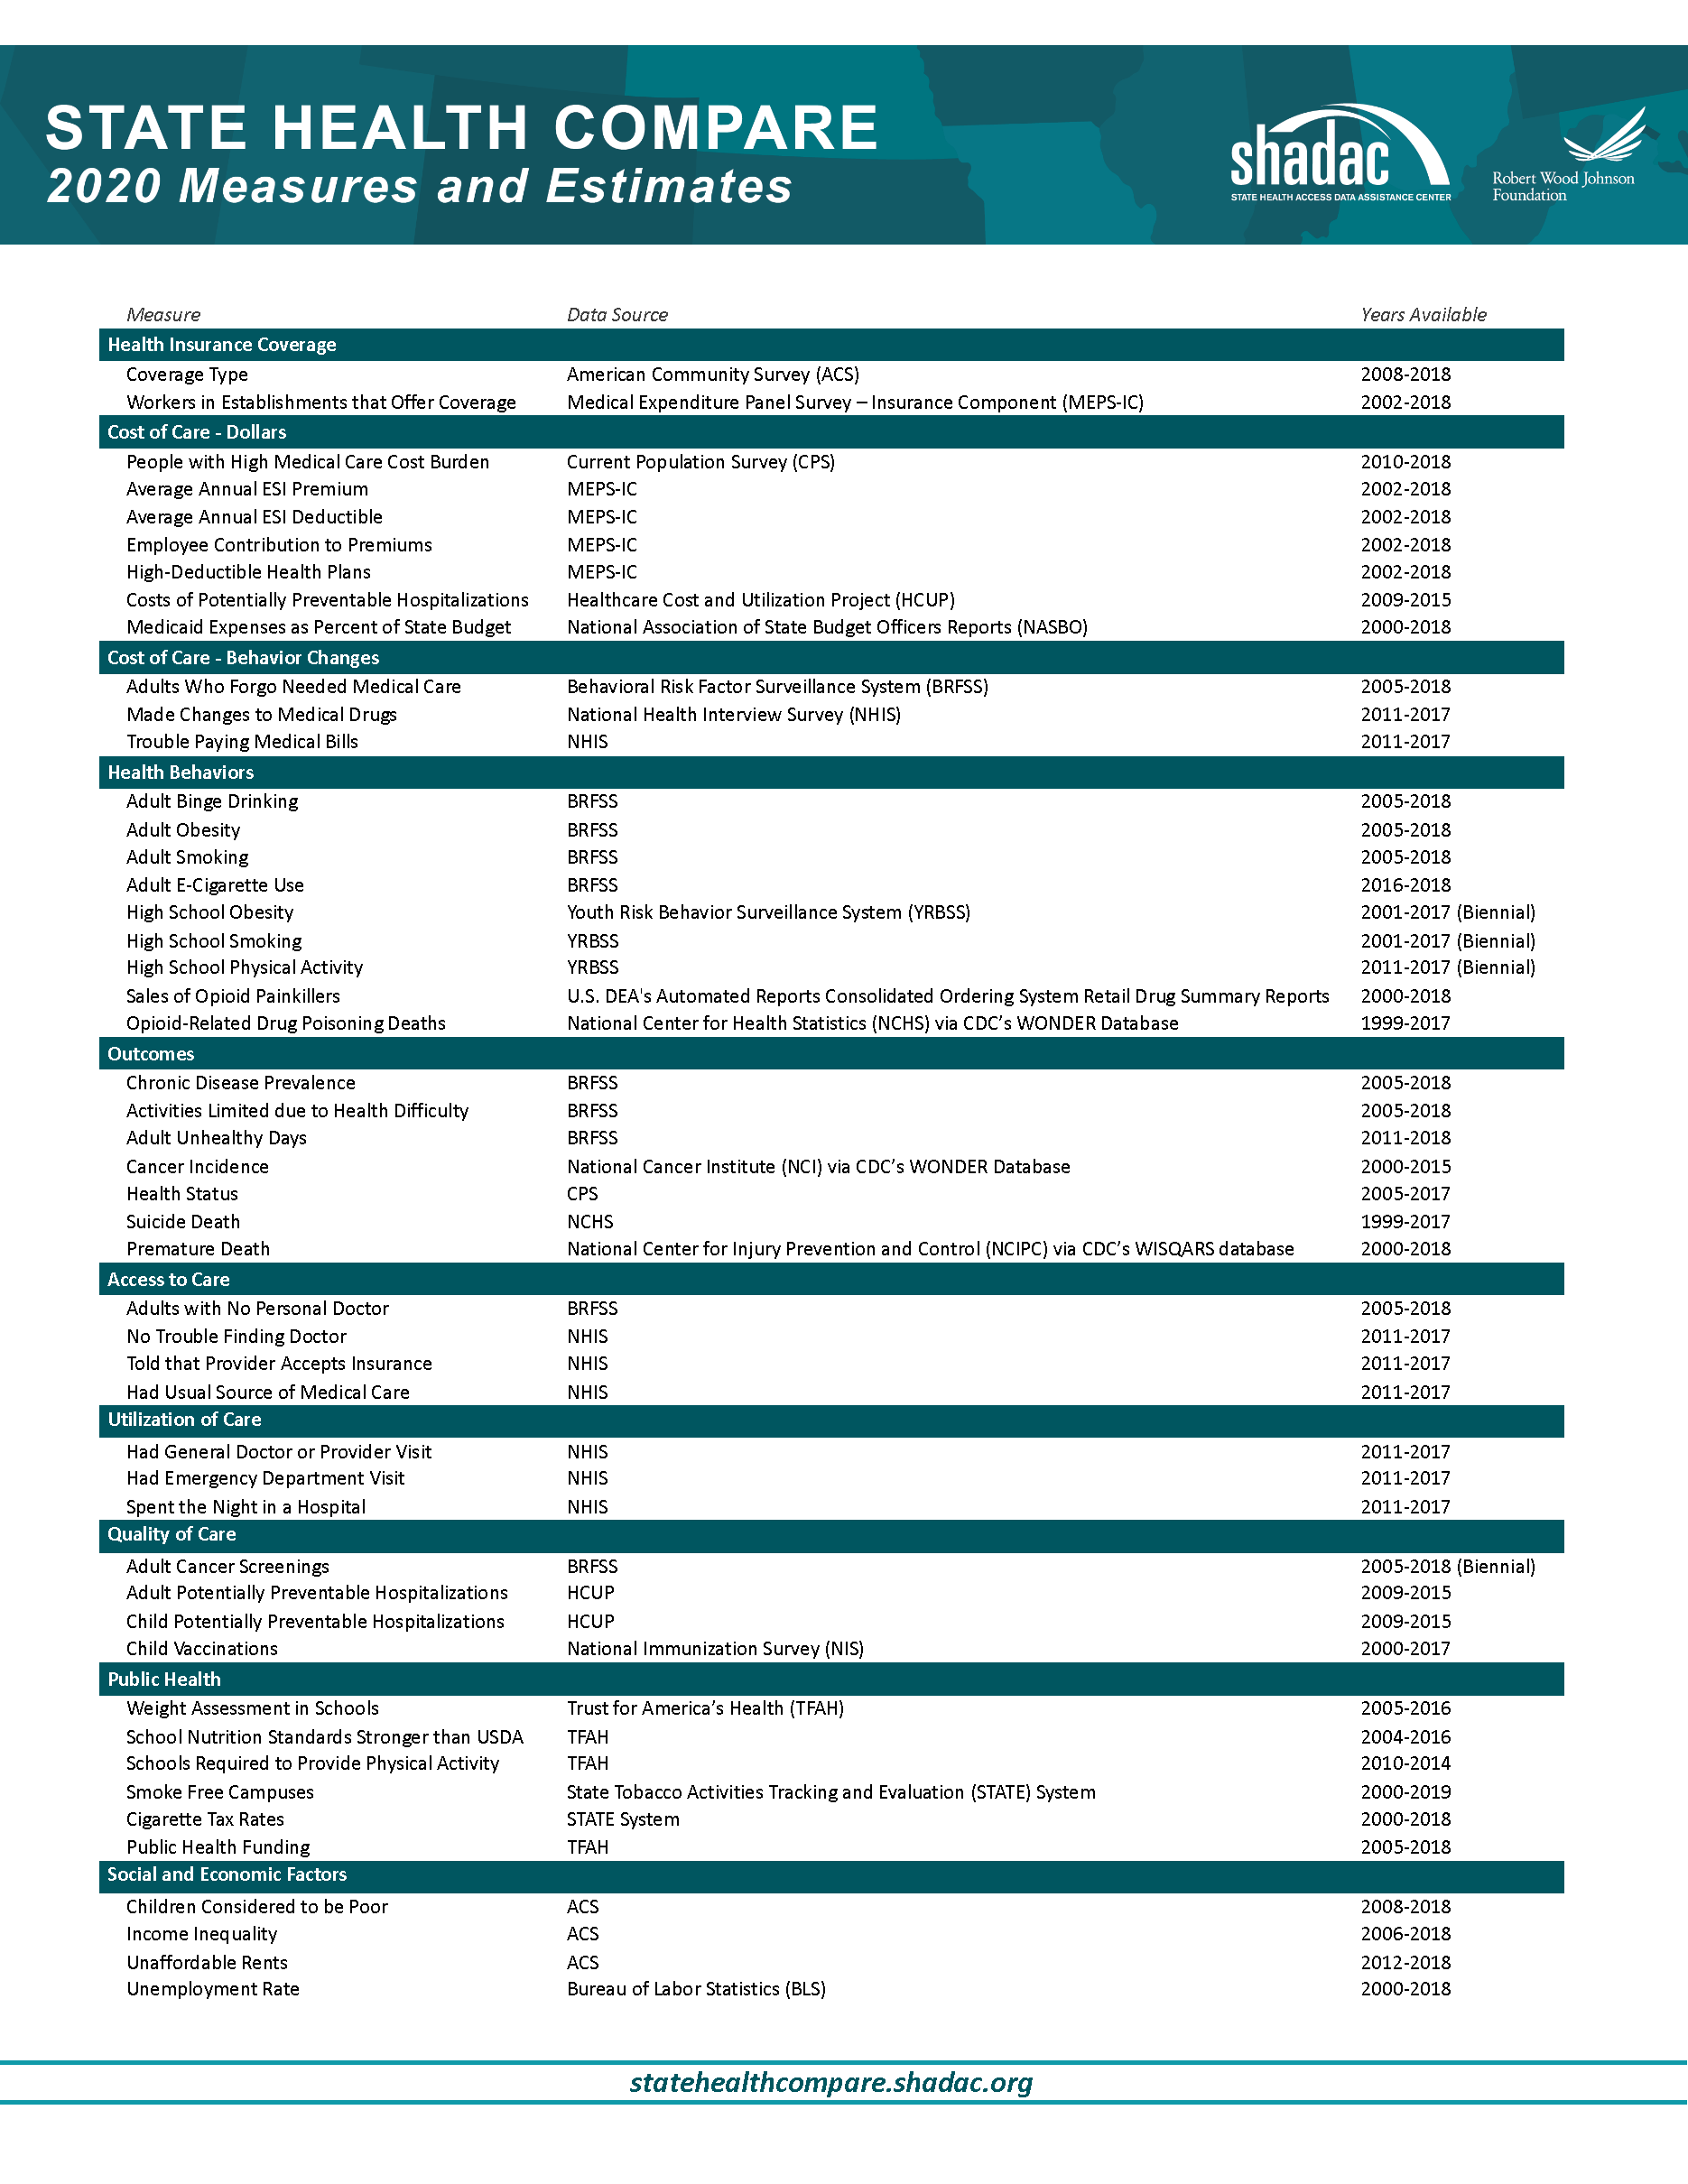
For a full overview of all available state-level measures, please visit the “Explore Data” page on State Health Compare, or take a look at our one-page guide to State Health Compare measures and their data sources.
All measures marked with an “*”: This indicates a break in series due to survey changes in either data processing or implementation methodology.


