Blog & News
U.S. Census Bureau Analytic Report Shows Significant Non-Response Bias in the 2020 American Community Survey
November 11, 2021:The U.S. Census Bureau recently released an analytical report that details and evaluates the impact of the COVID-19 pandemic on data collection and data quality in the 2020 American Community Survey (ACS) and provides evidence supporting its decision to release the 2020 ACS 1-Year estimates and public use microdata on an “experimental,” rather than official basis. This blog post highlights evidence from the report that the pandemic-related disruptions to data collection resulted in measurable non-response bias in the 2020 ACS, causing the survey to over-represent economically advantaged populations.
The analytical report examines trends in a number of measures that are thought to be reasonably stable from year to year or which can be validated against external data sources. The measures evaluated include:
- Building structure type,
- Medicaid coverage,
- educational attainment,
- non-citizen population, and
- median household income.
This post will highlight trends from a selection of these measures: Medicaid coverage, non-citizen population, and educational attainment.
Medicaid Coverage
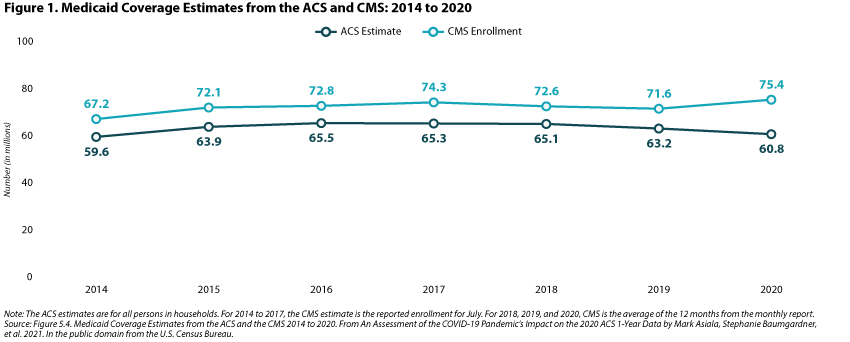
Figure 1 below compares Medicaid coverage (millions of persons covered) information from the ACS to enrollment data from the Centers for Medicare and Medicaid Services (CMS). Though ACS data have consistently under-estimated the number of individuals covered by Medicaid relative to administrative data, the figure shows how trends in enrollment have been parallel in the past. However, in 2020, these trends diverged, with CMS enrollment data showing an increase in Medicaid coverage (consistent with previous experience that Medicaid coverage increases during economic downturns) and ACS data showing a decrease in Medicaid coverage. This divergence is evidence that households that responded to the ACS were more socioeconomically advantaged than in previous years, and therefore were less likely to report having Medicaid coverage.
Non-Citizen Population
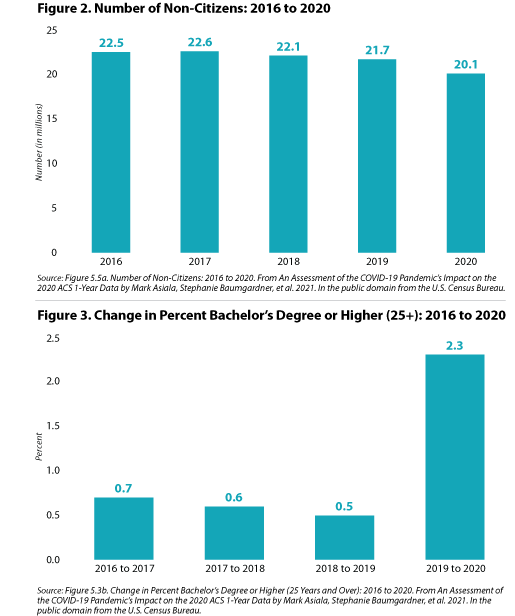
Results in figure 2 show that the number of non-citizens has been largely stable year to year from 2016 through 2019, but the number of non-citizens decreased substantially in 2020, falling by 1.6 million persons. The report’s authors propose that this decrease, though potentially due in part to changes in international migration, is likely due to non-response bias since “foreign born—and non-citizens in particular—disproportionately respond to the ACS via in-person response follow-up methods,” which were substantially cut back in 2020 due to the COVID pandemic.
Educational Attainment
The share of the population age 25 years and over with a bachelor’s degree or higher was relatively stable year-over-year from 2016 through 2019, changing by less than one percentage point. However, from 2019 to 2020, the percent of the population with a bachelor’s degree increased by 2.3 percentage points, which, if accurate, would translate to an increase of about 6 million people with a bachelor’s degree or higher between 2019 and 2020. In previous years, the ACS has shown a year-over-year increase of approximately 2 million in the number of bachelor’s degrees (figure 3).
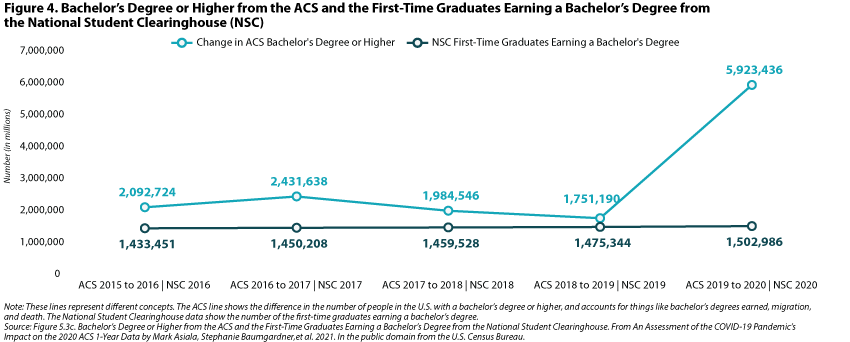
Below, figure 4 compares the year-over-year change in the number of bachelor’s degrees in the ACS to administrative data from the National Student Clearinghouse (NSC), an organization that provides enrollment and degree verification. Contrary to the ACS estimates, the NSC data do not show a large increase in the number of bachelor’s degrees in 2020. This is another piece of evidence demonstrating that the 2020 ACS data had measurable non-response bias that also over-represented a more highly educated population.
Conclusion
The measures presented here and in the Census Bureau’s analytic report on the 2020 ACS provide fairly clear evidence that the data collected in the 2020 ACS over-represent a more socioeconomically and educationally advantaged population, an issue that is the product of pandemic-related disruptions to data collection as well as resulting non-response bias. Because of these demonstrable data quality issues, the Census Bureau has chosen to release a limited set of 2020 ACS 1-Year estimates and the public-use microdata sample (PUMS) as “experimental” data products, which will be available later this month.
We commend Census for its transparency in providing this level of detailed evidence of the complications with the 2020 ACS and for making the 2020 ACS data available in an experimental format at least, rather than withholding them entirely from public release. Though the lack of reliable 2020 ACS data creates a critical information gap for a range of data users, given this evidence and the "gold standard" nature of ACS data, it is clear that the Census Bureau acted prudently in not releasing the 2020 ACS as usual.
Related Resources
Census Bureau Announces Major Changes to 2020 American Community Survey (ACS) Data Release (SHADAC Blog)
Changes in Federal Surveys Due to and During COVID-19 (SHADAC Brief)
Current Population Survey (CPS) will Serve as Primary Source of 2020 State-level Data on Health Insurance (SHADAC Blog)
Blog & News
Current Population Survey (CPS) will Serve as Primary Source of 2020 State-level Data on Health Insurance
September 22, 2021:On September 14, the U.S. Census Bureau released 2020 health insurance estimates from the Current Population Survey (CPS). These data will serve as one of the only sources of 2020 state-level health insurance as the Census Bureau will not be releasing its typical 1-year estimates from the 2020 American Community Survey (ACS) due to impacts of the COVID pandemic that resulted in substantially lower response rates and nonresponse bias.
SHADAC typically relies on the ACS to study state and sub-state (e.g., state coverage by race) health insurance trends and posts detailed state estimates on State Health Compare. However, because the ACS data are not being released this year, we recommend that analysts instead use the CPS and have posted 2020 estimates from the CPS on State Health Compare for analysts and policymakers that need 2020 state-level information on coverage. This blog provides an overview of important differences between the two surveys for those using CPS estimates in place of the ACS this year.
Key differences between CPS and ACS
There are some critical differences between the CPS and ACS, and it is important to understand these differences when interpreting results.
Sample size
Perhaps one of the most critical differences between the ACS and the CPS for analysts and policymakers interested in estimates at the state, and more granular levels of geography or subpopulations, is sample size. The ACS has significantly more sample than the CPS; over 2 million households in 2019 compared to just over 94,000 in the CPS. Sample size is the primary reason that SHADAC typically uses the ACS to produce estimates of coverage for State Health Compare. As we note in our blog outlining results from the CPS, relying on the CPS means that we are unable to produce as many subpopulation estimates within states as we do with the ACS. In addition to limiting the estimates that can be produced, the smaller sample size of the CPS also results in less precision, even for estimates that the sample size does support.
Conceptual differences in the definition of the uninsured
The CPS estimates presented above and on State Health Compare reflect insurance status of respondents for the entire calendar year of 2020. In contrast, the ACS collects information at a “point in time” when the survey was conducted. As a result, estimates of uninsurance in the CPS are lower than the ACS, because people who had coverage at some point in the prior calendar year are not considered uninsured. The ACS, on the other hand, captures a cross-section of people who are uninsured at the time the survey was conducted, some of whom were not uninsured for the entire year. These differences are important, but it is also helpful to note that the surveys have historically demonstrated similar national trends over time, and the patterns across states are consistent in that states with low uninsurance levels have low levels in both surveys, and states with high levels have high levels in both surveys, and so on. For more detailed comparisons across surveys in prior years, see SHADAC’s “Comparing Federal Government Surveys That Count the Uninsured” brief.
Reference period
As discussed above, the CPS asks about coverage for the entire previous calendar year. The survey is fielded in February through April of each year, with respondents being asked to report their coverage for a time period as long as 16 months prior to the interview. The ACS collects information about current coverage only. Differences in the length of time for which respondents are being asked to recall their insurance coverage status can result in differences in measurement error across the surveys.
Breadth of Related Measures
Another important difference between the two surveys is the breadth of related content. The ACS’ main focus is broad demographic information, with just one question on health insurance. While the rich demographic information supports examination of the uninsured and the exploration of coverage by individual characteristics (e.g., social determinants of health) it has limited health policy applications. The CPS, on the other hand, contains a range of measures that are broadly relevant to health policy, such as medical out of pocket spending, health status, and eligibility for employer coverage. This means that the survey can be used to answer more complex research questions about the interactions between coverage and these related outcomes than could be supported through analysis of the ACS. The CPS also collects much more detailed information on income and employment than the CPS.
Looking Ahead
The CPS provides a good alternative for those that usually rely on state-level estimates of coverage from the ACS for analysis and planning. However, the data source does have some limitations, particularly for those seeking more granular estimates by geography and subpopulations within states. SHADAC is available to provide technical assistance to states that are seeking additional guidance on potential data sources to leverage for answering these questions in 2020. We will also be tracking the Census Bureau’s release of the 2020 1-year experimental ACS data, which are expected by November 30 of this year.
References
U.S. Census Bureau. (2016, May 16). Fact sheet: differences between the American Community Survey (ACS) and the Annual Social and Economic Supplement to the Current Population Survey (CPS ASEC). https://www.census.gov/topics/income-poverty/guidance/data-sources/acs-vs-cps.html
State Health Access Data Assistance Center (SHADAC). (October 2020). Comparing federal government surveys that count the uninsured: 2020. https://www.shadac.org/publications/comparing-federal-government-surveys-count-uninsured-2020
Stewart, A. (2021, July 30). Census Bureau announces major changes to 2020 American Community Survey (ACS) data release. State Health Access Data Assistance Center (SHADAC). https://www.shadac.org/news/changes-to-2020-acs-data-release-US-Census
Stewart, A. (2021, August 27). New SHADAC brief looks at changes in federal surveys during COVID pandemic. State Health Access Data Assistance Center (SHADAC). https://www.shadac.org/news/new-shadac-brief-looks-changes-federal-surveys-during-covid-pandemic
Blog & News
(Webinar) U.S. Health On the Rocks: The Quiet Threat of Growing Alcohol Deaths
August 01, 2024:Date: Tuesday, September 21st
Time: 3:00 PM Central / 4:00 PM Eastern
While much public attention has been given to the opioid epidemic, the United States has been quietly experiencing another growing public health crisis that surpasses opioid overdoses as a cause of substance abuse-related deaths in nearly half of all states: alcohol-involved deaths.
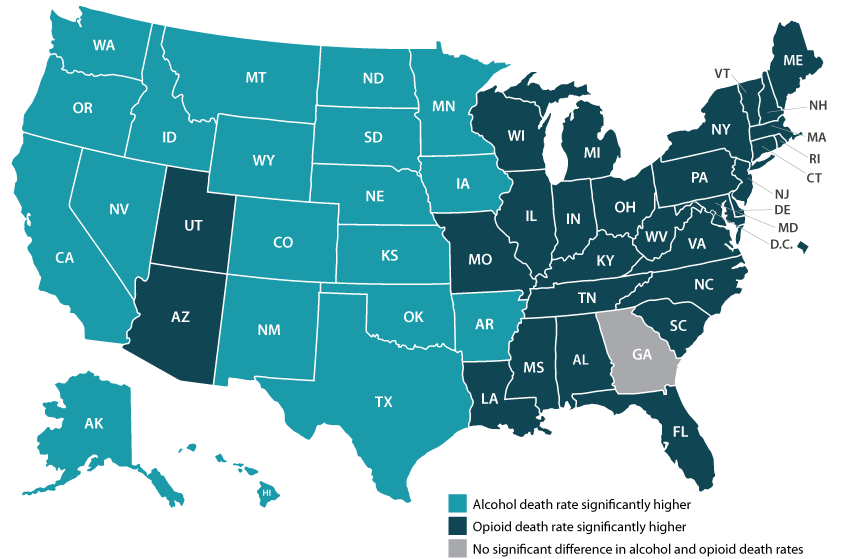
Using data from a recent analysis of alcohol-involved deaths from 2006 to 2019, SHADAC will host a webinar on Tuesday, September 21st detailing the trends in rising alcohol-involved deaths across the U.S., among the states, and for certain demographic groups.
Speakers
Carrie Au-Yeung, MPH, SHADAC – Ms. Au-Yeung will speak about variation in alcohol-related death rates across the states, as well as provide comparisons to opioid-related death rates in order to better understand the scale and context of substance use issues among the states.
Colin Planalp, MPA, SHADAC – Mr. Planalp will talk about national-level increases in alcohol death rates as well as rising rates for demographic groups by race and ethnicity, age, gender and urbanization.
Tyler Winkelman, MD, MSc, Hennepin Healthcare – Dr. Winkelman will discuss how the data serve can help us understand the impacts of the pandemic on alcohol-involved disease and deaths as well as the case for expanding our response to substance use issues beyond opioids.
A question and answer session will be open for all attendees following the webinar presentation. Attendees are encouraged to submit questions for any or all of the speakers prior to the webinar, and can do so here.
Slides from the webinar are available for download.
Resources
Escalating Alcohol-Involved Death Rates: Trends and Variation across the Nation and in the States from 2006 to 2019 (Infographics)
U.S. Alcohol-Related Deaths Grew Nearly 50% in Two Decades: SHADAC Briefs Examine the Numbers among Subgroups and States (Blog)
Pandemic drinking may exacerbate upward-trending alcohol deaths (Blog)
BRFSS Spotlight Series: Adult Binge Drinking Rates in the United States (Infographic)
Blog & News
New York State of Health Pilot Yields Increased Race and Ethnicity Question Response Rates
September 9, 2021:The following content is cross-posted from State Health and Value Strategies. It was first published on September 9, 2021.
Author: Colin Planalp, SHADAC
Race response rate grew 20 percentage points, ethnicity grew 8 percentage points
Summary
- New York set out to improve race and ethnicity response rates by piloting changes to the question on the Marketplace application.
- The state enhanced its explanation on the importance of the question for applicants and assistors, and it provided new training for assistors and navigators.
- Applicants did not have to share their race or ethnicity, but they could not leave the question blank; instead, they could respond with “don’t know” or “choose not to answer”.
- Among participants in the test, race response rates increased 20 percentage points and ethnicity response rates increased 8 percentage points, while response rates for a comparison group saw minimal change.
- Based on the pilot findings, New York is expanding changes to the race and ethnicity questions system-wide for the next open enrollment period, and the state is considering additional revisions in hopes of further enhancing the quality and completeness of its data.
Introduction
Even during the COVID-19 pandemic, states are striving to enhance health equity. In addition to racial justice movements that arose during 2020, the disproportionate impact of the pandemic itself on people of color highlighted existing health inequities in the United States. These factors have influenced many states to redouble their focus on closing health gaps. However, in order to identify priorities and evaluate improvement efforts, states need high quality and more complete data—a challenge when state health agencies’ data on race and ethnicity commonly contains large gaps. For instance, a recent report by the Centers for Medicare and Medicaid Services (CMS) found that 19 states’ race and ethnicity data was more than 20 percent incomplete, with some more than 50 percent incomplete.
Many states are looking to fill those gaps in race and ethnicity data for Medicaid and related agencies. This expert perspective highlights an effort by New York’s official state-based marketplace, NY State of Health, to improve the completeness of race and ethnicity data that applicants share when applying for Medicaid; Child Health Plus, the state’s Children’s Health Insurance Program (CHIP); the Essential Plan, New York’s Basic Health Program (BHP); or Qualified Health Plan (QHP) coverage through its Marketplace.
Setting Out to Improve Race and Ethnicity Response Rates
In the fall of 2020, staff in NY State of Health began a project to improve response rates in the collection of race and ethnicity data that people are asked to share during the application process. Historically, the agency had seen substantial gaps in those data, with roughly 40 percent of respondents skipping the question on race and 15 percent skipping the question on ethnicity. Because the NY State of Health serves as a single application point for all of the health insurance programs administered by the state, any issues with missing data affect all of those programs.
The state started with a pilot project to test strategies for improving race and ethnicity question response rates. By employing a smaller-scale pilot, the approach would allow them to test a “proof of concept” to determine whether their changes resulted in the intended improvements in question response rates before embarking on a larger effort that would apply to all new and existing program applicants. Demonstrating proof of concept would also provide the state with results to bolster stakeholder engagement, which was particularly important in the New York context because the state has many health plans and assister organizations, which provide assistance to 80 percent of NY State of Health enrollees.
Test Strategies to Improve Question Response Rates
Working with the State Health and Value Strategies (SHVS) technical assistance team, New York tested multiple strategies aimed at encouraging applicants to answer the optional race and ethnicity questions.
Making the case to applicants
Under the Affordable Care Act (ACA), states are prohibited from requiring applicants to share information that is not necessary for determining eligibility for coverage, including race and ethnicity. However, best practices demonstrate that people may be more willing to voluntarily share that information if told how the data are intended to be used (e.g., responses to these questions will be used to inform health equity efforts by identifying health care gaps and enhancing outreach efforts), and how they will not be used (e.g., responses to these questions will not affect program eligibility, plan choices, or access to programs).i Based on that understanding, New York deployed a revised script for the assistors and navigators participating in the pilot:
“Here at [agency name], we are testing a new approach for the next two questions which are on race and ethnicity. Obtaining this information can help us reach and possibly bridge healthcare gaps in traditionally underserved communities.
Please answer the following questions on race and ethnicity. We use this data to improve services to the community and to enhance outreach efforts. You do not have to answer these questions and giving us this information will not affect your eligibility, plan choices, or access to programs.”
While the message remained similar, and crucially still notified applicants that providing race and ethnicity information was optional, the revised introductory language made two key changes. First, it provided additional detail on how the information may be used, “to improve services to the community and to enhance outreach efforts,” rather than the original version that more generically states that “answering them can help us serve your community better.”
Second, the revised language flipped the order of the paragraph, starting with the request to share the information and a brief explanation of how the information may be used, followed by an acknowledgment that providing the information is optional. Conversely, the original introductory paragraph began by stating that “you do not have to answer any questions about race or ethnicity,” which could have discouraged applicants before they even learned why they might consider it.
Requiring a response
Although states are prohibited from requiring applicants from sharing race and ethnicity information, New York wanted to discourage people from rolling past the question with a quick skip. To achieve that, the state asked the organizations participating in the pilot to treat the question as if it required a response. However, applicants were given the option to respond with choices of “Don’t Know” and “Choose Not to Answer” to ensure they had the ability to opt-out of sharing the information (Figure 1). That way, applicants could still decline to share the requested information, but the structure of requiring a response made answering the question just as easy as declining to answer it.
Figure 1. New York’s race and ethnicity pilot question
Training for assistors and navigators
In addition to piloting changes to its race and ethnicity question, New York also emphasized the importance of the data to the health plan and assistor organization that participated in the test pilot. The state provided training for those entities and their navigators and assistors. That training—including a computer-based presentation and written materials—described in detail how assistors and navigators should ask the race and ethnicity questions, including presenting a standardized script, and it explained the importance and purpose of those data: allowing the state to better understand who they are reaching with coverage and who is still being missed.
The state felt that approach was important because most people who obtain health insurance through NY State of Health do so with the help of an assistor (80 percent in 2020), rather than filling out the application entirely on their own. For that reason, navigators and assisters can serve as champions to help collect those data—or alternatively, they could discourage applicants from sharing that data if they do not understand the potential value it carries.
Evaluating the pilot
In addition to testing changes to how the state collects race and ethnicity data, New York also wanted to evaluate whether the pilot appeared to improve response rates. While it is difficult to definitively attribute any changes to the pilot—especially because it coincided with complicating factors related to the pandemic—the state found encouraging results.
In the health plan and assister organization that participated in the pilot, the response rates for race increased 20 percentage points, to 64.0 percent in the test period during 2021, compared to 44.0 percent during a similar period in 2020 (see Figure 2). The comparison group of other assistor organizations in the state, meanwhile, saw an increase of only 0.9 percentage points. The same health plan and assister group also saw the response rate for ethnicity increase 8.0 percentage points (from 80.3 percent to 88.3 percent), compared to a decline of 1.4 percentage points in the comparison group.
Figure 2. Race and ethnicity response rates, pilot test and comparison groups
| Race Question | Ethnicity Question | ||||||
| 2020 | 2021 | Change | 2020 | 2021 | Change | ||
| Comparison group | 48.8% | 49.7% | +0.9 pp | 83.0% | 81.6% | -1.4 pp | |
| Test group | 44.0% | 64.0% | +20.0 pp | 80.3% | 88.3% | +8.0 pp | |
Future Considerations
Based on the successful results of its test, New York plans to implement the piloted changes on its application used by all people to enroll in and renew their coverage. Additionally, the state has continued to consider other revisions to the way in which it collects race and ethnicity data from applicants. The state has not yet implemented changes related to the following strategies, but it is considering making them in time for the next Marketplace open enrollment period.
Single race and ethnicity question
Research from the U.S. Census Bureau has found that a single, combined race and ethnicity question yields a greater response rate and improved accuracy as compared to two separate questions for race (e.g., American Indian/Alaska Native, Asian, White, Black/African American, etc.) and ethnicity (i.e., Hispanic/Latino) (see Figure 3). Historically, New York has combined the two questions into a single page of its enrollment system, but it is considering combining them into a single question that lists all response options (race and ethnicity) together with instructions to select all that apply.
Figure 3. U.S. Census Bureau-tested combined race and ethnicity question
Tailoring race and ethnicity response options
New York also is considering making revisions to the race and ethnicity options it lists as part of the state’s question, with two potential benefits. First, offering options that reflect how individuals identify may make them more likely to respond. Second, offering more granular and intuitive response options could allow the state to analyze the data with more specificity than the typical response categories allow. For instance, the state has a relatively large Middle Eastern and North African population, which typically is considered part of the White response category. However, that may not be intuitive to applicants and limits the state’s ability to analyze the data with concern to health inequities for that population. To facilitate its consideration of that option, the state worked with SHVS technical assistance providers to pull Census Bureau data on the size of various racial and ethnic populations within the state.
Conclusion
With a growing focus on health equity, high quality and complete data on beneficiaries’ race and ethnicity can help Medicaid and other state health programs to identify and mitigate gaps. This example from New York shows how states can test and evaluate strategies to improve the collection of race and ethnicity data to determine and build on approaches that work. And the state’s consideration of new strategies illustrates how improving these data is likely to require persistent and iterative efforts over time rather than any single, easy fix.
i Baker, D.W., et al. (2005). Patients’ attitudes toward health care providers collecting information about their race and ethnicity. J Gen Intern Med, 20(10), 895-900.
Publication
Collection and Availability of Data on Race, Ethnicity, and Immigrant Groups in Federal Surveys that Measure Health Insurance Coverage and Access to Care
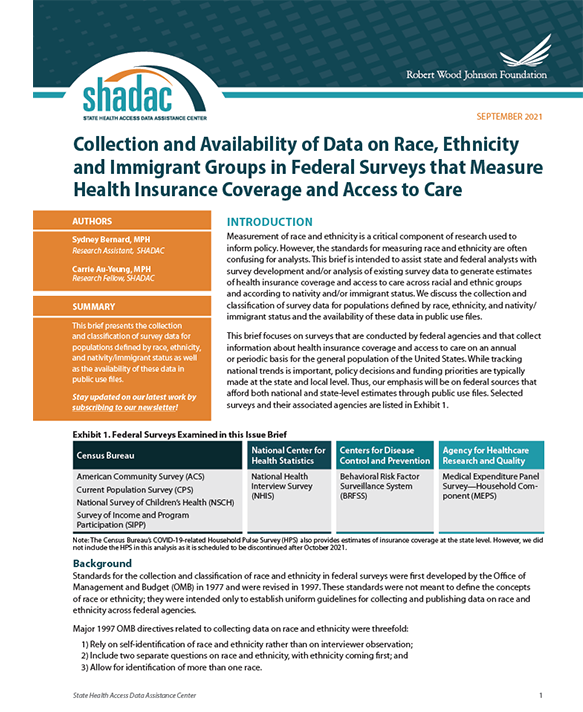 This brief aims to assist state and federal analysts with survey development and/or analysis of existing survey data to generate estimates of health insurance coverage and access to care across racial and ethnic groups and according to nativity and/or immigrant status. The brief presents the collection and classification of survey data for populations defined by race, ethnicity, and nativity/immigrant (REI) status as well as the availability of these data in public use files. We focus in particular on surveys that are conducted by federal agencies and that collect information about health insurance coverage and access to care on an annual or periodic basis for the general population of the United States. Because policy decisions and funding priorities are typically made at the state and local level, the brief emphasizes federal sources that afford state-level estimates as well.


