VISIT STATE HEALTH COMPARE
Blog & News


Minnesota’s uninsured rate hit historic low in 2021 but racial disparities increased (Minnesota Department of Health Cross Post)
July 14, 2022:Today, the Health Economics Program (HEP) of the Minnesota Department of Health (MDH) and the University of Minnesota School of Public Health, State Health Access Data Assistance Center (SHADAC) released results from the 2021 Minnesota Health Access Survey (MNHA) - a biennial state-based population survey that collects information on how many people in Minnesota have health insurance and how easy it is for them to get health care. The survey is conducted as a partnership between MDH and SHADAC.
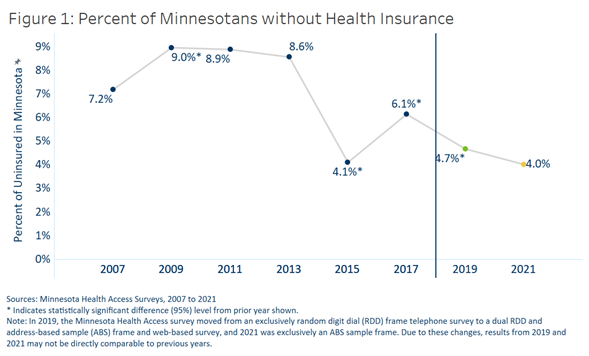
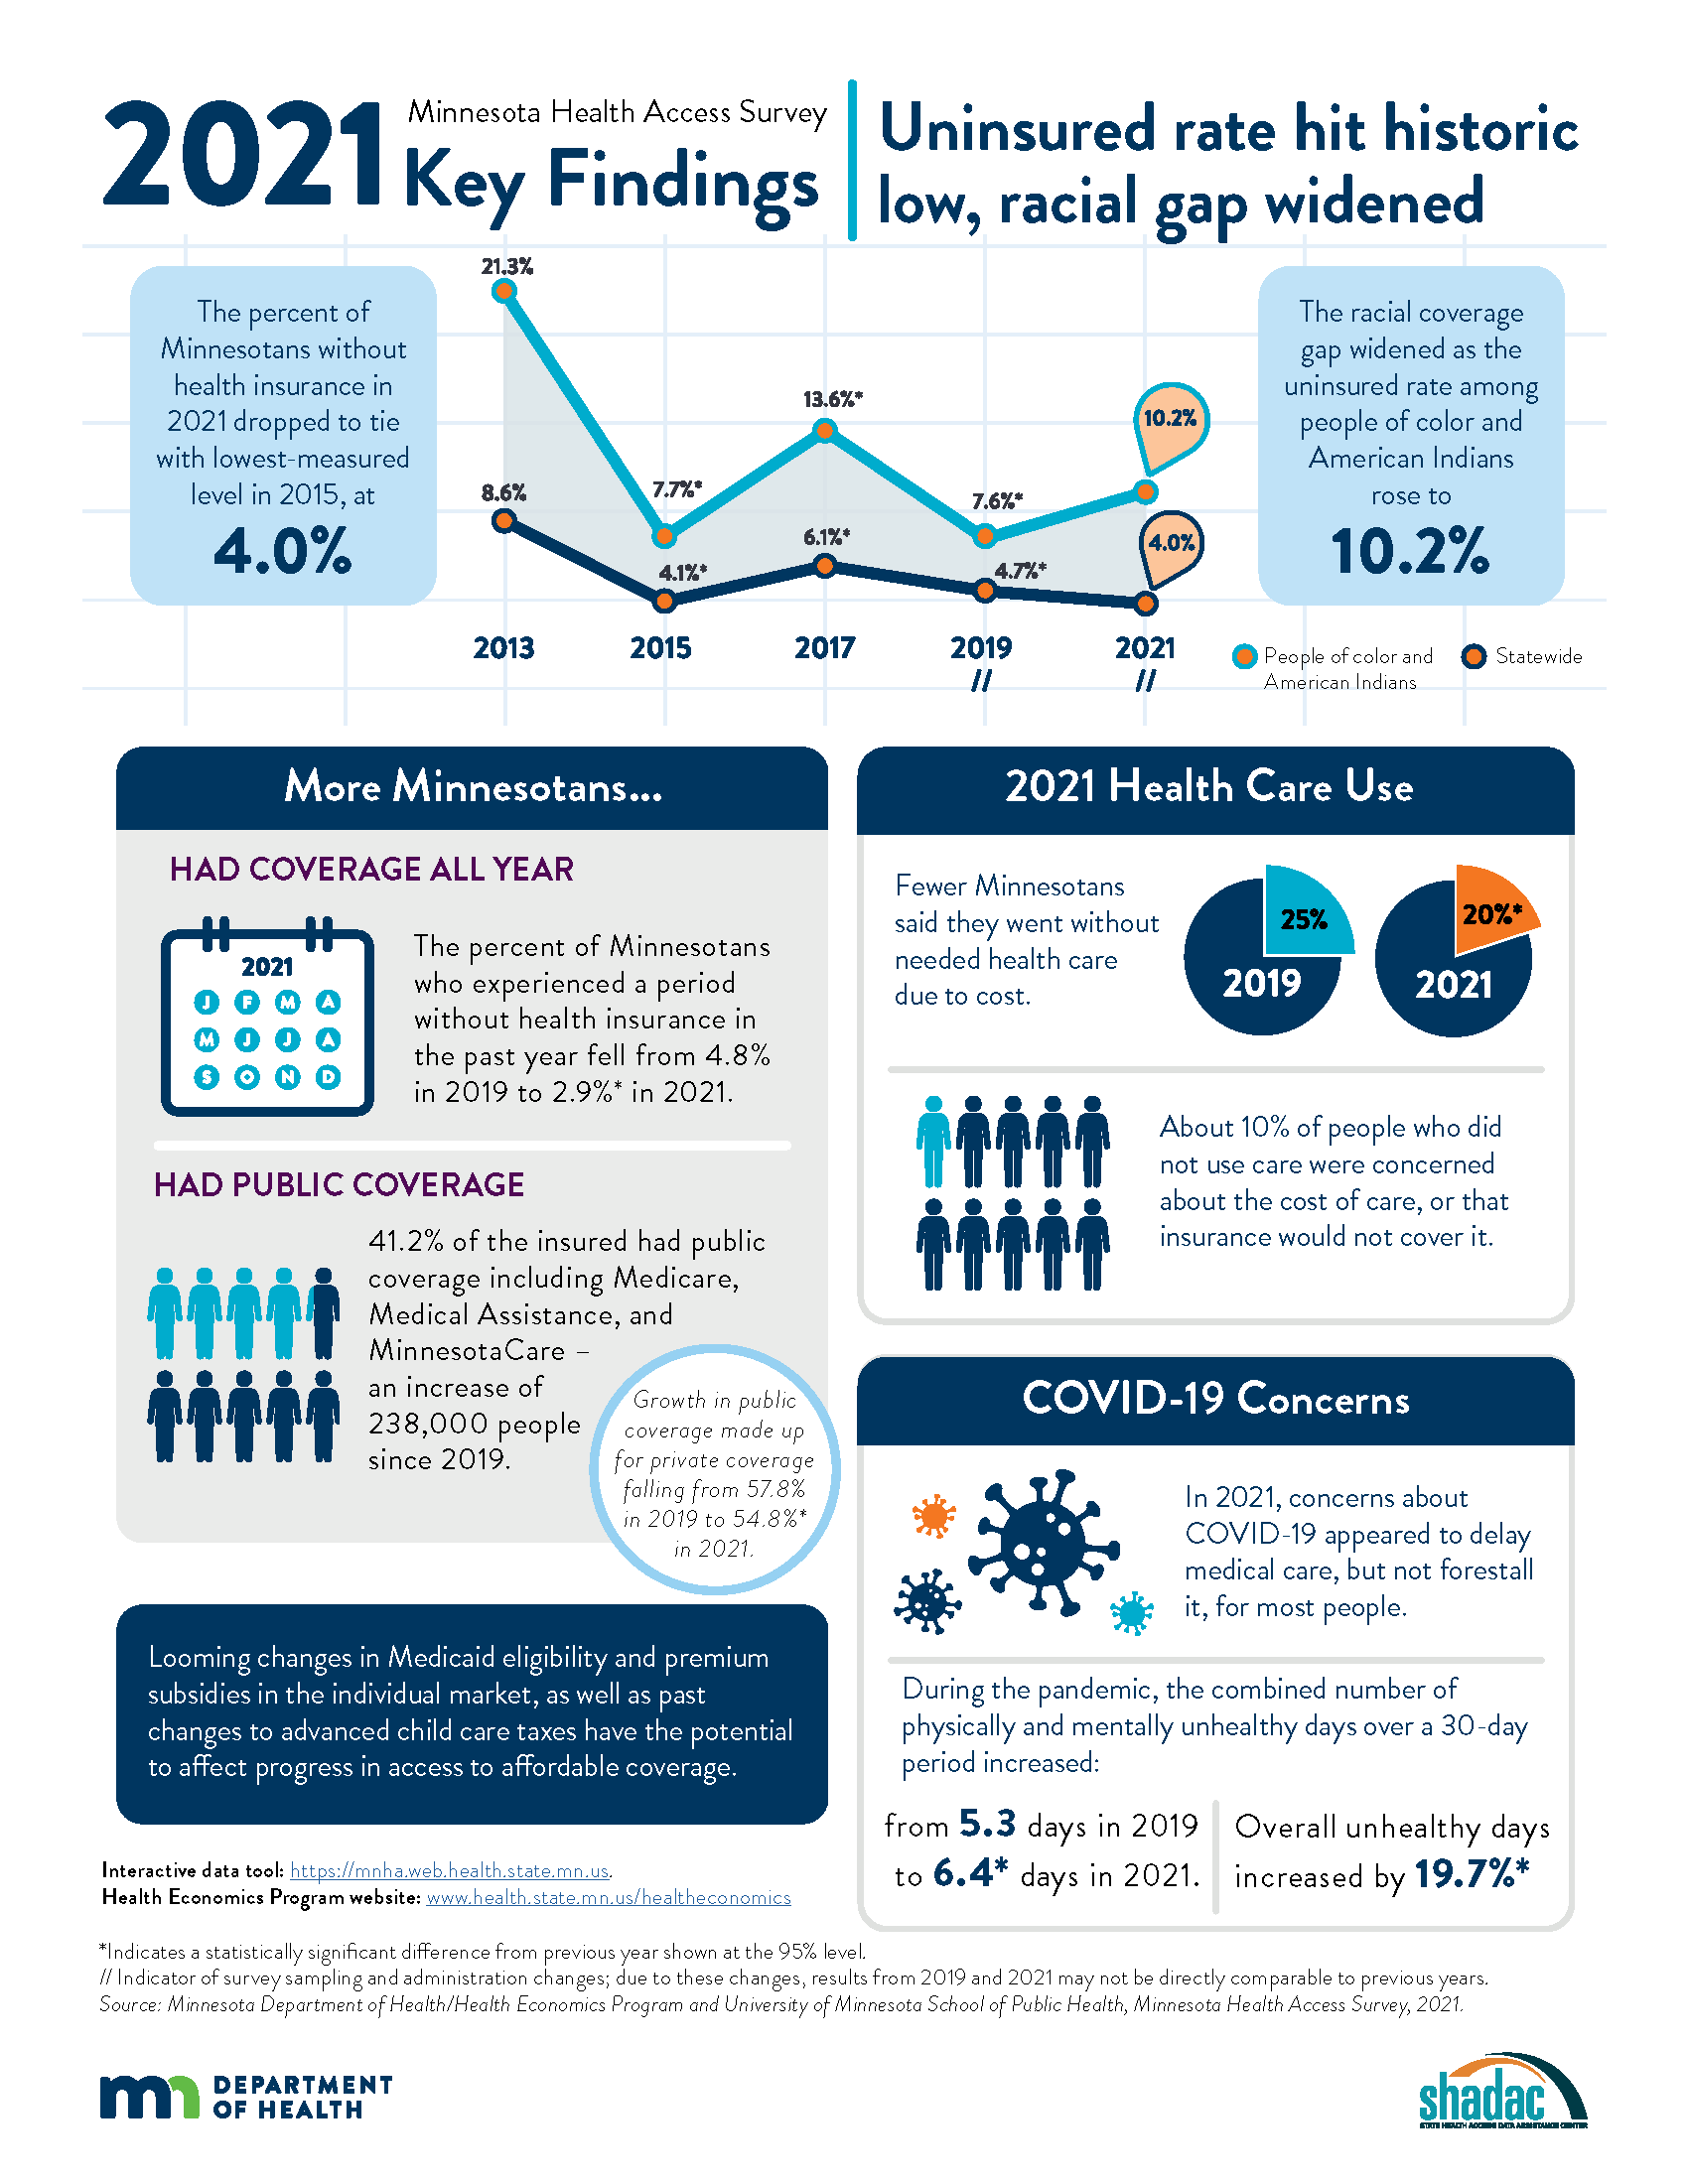
Key findings from the survey showed mixed results, with the statewide uninsured rate dropping to its lowest-ever rate (4.0%) and periodic uninsurance dropping significantly (2.9% from 4.8%). However, the survey also found that disparities in coverage increased when examined by race and ethnicity, with uninsured rates among American Indians and people of color rising to 10.2%.
The following content from the full press release is cross-posted from the Minnesota Department of Health published on April 21, 2022.
Authors: Alisha Simon, MDH; Stefan Gildemeister, MDH; Kathleen Call, SHADAC
The Minnesota Department of Health (MDH) released new data showing mixed news regarding health insurance coverage in Minnesota during 2021. While actions taken by state officials helped drop the state’s uninsured rate to the lowest level ever measured, racial disparities in coverage worsened.
Federal and state policies and funding during 2021 shielded Minnesota’s health insurance coverage against the pandemic’s economic shock. With the help of these efforts, the state’s uninsured rate fell to 4.0%, the lowest-ever measured level, essentially tying the 2015 rate.
Economic downturns often result in higher rates of uninsurance in the U.S. due to the link between employment and health insurance coverage. With the help of state and federal funding, Minnesota took steps to prevent insurance loss in 2020 and 2021, including government efforts to maintain coverage for low-income Minnesotans and premium subsidies in the individual market. Data from the Minnesota Health Access Survey found that 34,000 fewer Minnesotans went without health insurance in 2021 compared to 2019. Fewer Minnesotans also said they went without some type of needed health care due to cost in 2021 (20%) compared to 2019 (25%).
However, not all Minnesotans were equally able to access or retain coverage. Racial disparities worsened as the uninsured rate among Minnesotans of color and American Indians rose from 7.6% in 2019 to 10.2% in 2021. In contrast, the uninsured rate dropped among non-Hispanic Whites from 3.7% in 2019 to 2.4% in 2021.
“The investments we made before and during the pandemic to ensure Minnesotans had access to affordable health coverage helped more people stay insured, even in the midst of job losses and economic instability,” said Minnesota Commissioner of Health Jan Malcolm. “Sadly, we saw that people of color and American Indians did not benefit as much from these efforts. We must learn about what worked and what didn’t so we can adapt our approach to reach the goal of ongoing and equitable access to affordable health care for all Minnesotans.”
The number of Minnesotans with public insurance increased by 238,000 so that 41.2% of those insured had coverage through public sources in 2021, including Medicare, Medical Assistance and MinnesotaCare. This growth in public coverage made up for a decrease in private coverage – down from 57.8% in 2019 to 54.8% in 2021.
While most Minnesotans weathered the first two years of the pandemic with health insurance, there are concerns about maintaining coverage moving forward. Many government programs that added financial supports to families, increased subsidies for private health insurance plans sold through MNsure to make insurance more affordable or allowed people to stay on Medicaid longer ended or are set to expire this year.
“Historically, Minnesota has enjoyed a strong labor market and a strong employer-sponsored insurance market,” said Kathleen Call, a professor with the University of Minnesota School of Public Health and an investigator at the State Health Access Data Assistance Center. “However, alongside the crisis of the pandemic, the long-term erosion of private coverage over the past two decades, combined with the fact that not all employees are offered insurance and not all Minnesotans can afford it, reminds us that continued commitments are needed to support and promote Medical Assistance, MinnesotaCare and premium subsidies in the individual market available through MNsure.”
The survey suggests that COVID-19 had an impact in delaying care in 2021 but didn't keep most people from getting that care eventually. In the second year of the pandemic, COVID-19 concerns affected only 8% of people not receiving health care. The primary reasons for not using health care were cost or not needing it.
Both physical and mental health declined during the pandemic, according to the survey. The number of unhealthy days reported for a 30-day period climbed to an average 3.3 days for physical health and 4.3 days for mental health, compared to 2.8 for physical health and 3.7 for mental health in 2019.
“The reports of Minnesotans having fewer healthy days in 2021 are concerning, particularly in light of the continued strain on the state’s health care workforce and our structural weaknesses in mental health care,” said Stefan Gildemeister, MDH state health economist. “We will continue to monitor how effective our investments in community connections and resources during the pandemic are in reversing lingering harms to physical and mental health as the state moves into the next stage of the pandemic and as the economy recovers.”
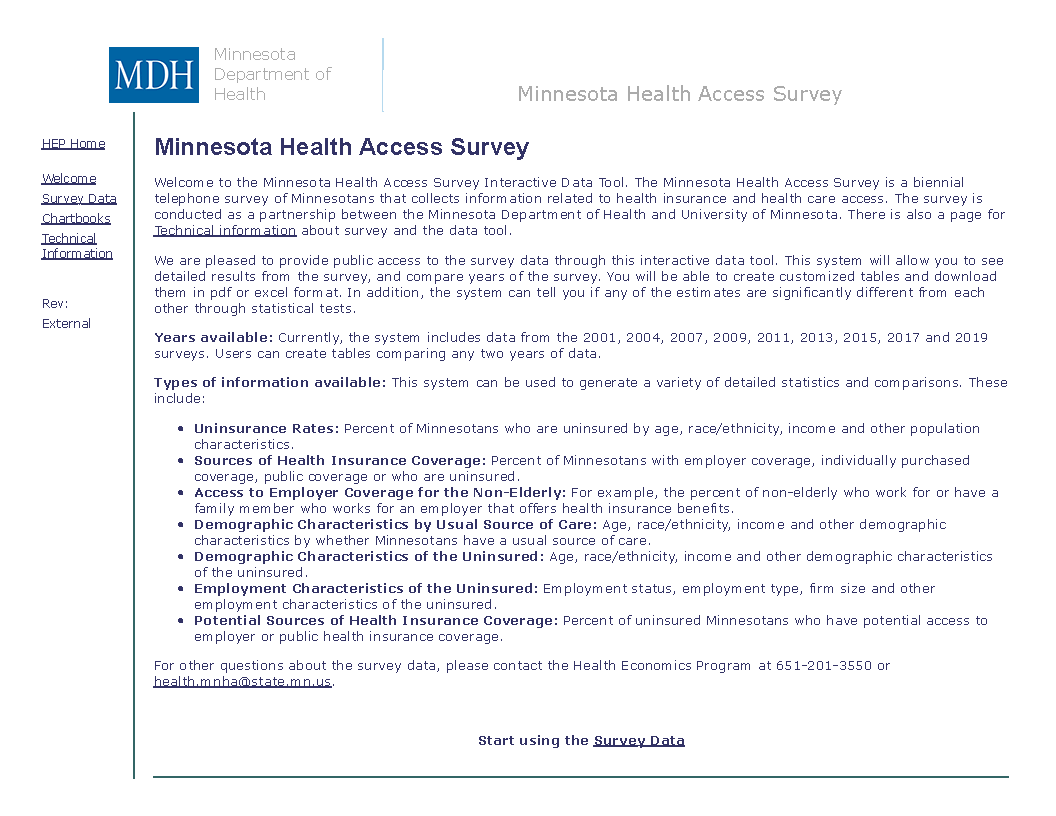
The Minnesota Health Access Survey is a biennial state-based population survey that collects information on how many people in Minnesota have health insurance and how easy it is for them to get health care. The survey is conducted as a partnership between MDH and the University of Minnesota School of Public Health, State Health Access Data Assistance Center. The survey had responses from more the 18,000 Minnesotans across the state and was conducted between October 2021 and January 2022. More findings from the survey are available on the MDH Health Economics Program website.
Additional Resources
MDH Uninsurance Chartbook MNHA 2021 Survey Infographic MNHA Survey Tool
Blog & News

Covid-19 Vaccine Hesitancy in the U.S. has Reached a Plateau: Evidence from the Household Pulse Survey
April 1, 2022:Previous analysis produced by SHADAC using data from the Household Pulse Survey (HPS) showed promising evidence of a reduction in COVID-19 vaccine hesitancy during the first three months of 2021. However, though this report highlighted an overall decline in hesitancy, it also showed disparities in the level of hesitancy between demographic and socioeconomic groups. In an effort to continually illuminate barriers to vaccine receipt, this blog provides an updated look at vaccine hesitancy among U.S. adults (age 18 and older) using HPS data from January through October 2021.
|
The Household Pulse Survey is an ongoing weekly tracking survey designed to measure the impact of the COVID-19 pandemic. These data provide multiple snapshots of COVID-19 vaccine hesitancy and are the only data source to do so at the state level over time. Click on any graphic throughout this blog to view it in full-screen mode. |
The HPS allows respondents to identify multiple reasons for not receiving all vaccine doses.
For the survey period of January 6-July 5 the reasons listed on the survey form included:
| 1) Concerned about possible side effects 2) Plan to wait and see if it is safe and may get it later 3) Think other people need it more than I do right now 4) Don't know if a vaccine will work |
5) Don't trust the vaccine
6) Don't trust the government
7) Don't believe I need a vaccine
8) Don't like vaccines
|
9) Concerned about the cost of a COVID-19 vaccine 10) My doctor has not recommended it 11) Other reason |
For the survey period of July -October 11 the reasons listed on the survey form changed to include:
| 1) Concerned about possible side effects 2) Plan to wait and see if it is safe and may get it later 3) Don't know if a vaccine will protect me 4) Don't trust the vaccine |
5) Don't trust the government
6) Don't believe I need a vaccine
7) Don't think COVID-19 is that big of a threat
8) My doctor has not recommended it
|
9) Concerned about the cost of a COVID-19 vaccine 10) Hard for me to get a vaccine 11) Experienced side effects from 1st dose of vaccine 12) Believe one dose is enough to protect me |
Because the reasons for not receiving a vaccine changed between these two periods, they will be reported separately in our analysis.i
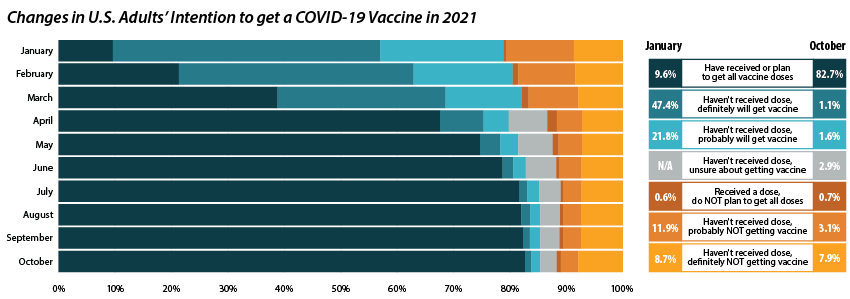
Share of adults who received or plan to receive all COVID-19 vaccine doses plateaued at the end of 2021.
From July through October 2021, the percent of people who have received or plan to receive all COVID-19 doses plateaued at around 80.0 percent.ii,iii This was after an initial jump from 9.6 percent in January to 67.6 percent in April. The initial increase drew mainly from the “Definitely planning to receive a vaccine” and “Probably going to receive a vaccine” groups. The percent of people who “Received a dose, but do not plan to receive all doses,” “Haven’t received a dose and are unsure about getting a vaccine,” “Haven’t received a dose and are probably not getting a vaccine,” and “Haven’t received a dose and definitely are not getting a vaccine” has also remained stable over the same period. Collectively, these four groups, which we define as being “hesitant,” dropped from a rate of 21.1 percent in January to 14.8 percent in July, where it’s remained since.
Vaccine Hesitancy varied by state, but nearly all states saw a reduction.
Nationally, 14.6 percent of adults reported being hesitant about the COVID-19 vaccine in October 2021. This varied across states, from a high of 28.9 percent in Wyoming to a low of 5.4 percent in the District of Columbia (D.C.).
The national rate of adult vaccine hesitancy decreased from 14.8 percent in July to 14.6 percent in October—a 0.2 percentage-point (PP) decrease. This overall decrease, though not significantly large, was reflected in 26 states plus D.C., which also saw promising reductions in vaccine hesitancy. Twenty-four states did not show reductions in hesitancy over that time period.
Concerns over possible side effects remains the top reason reported for vaccine hesitancy.
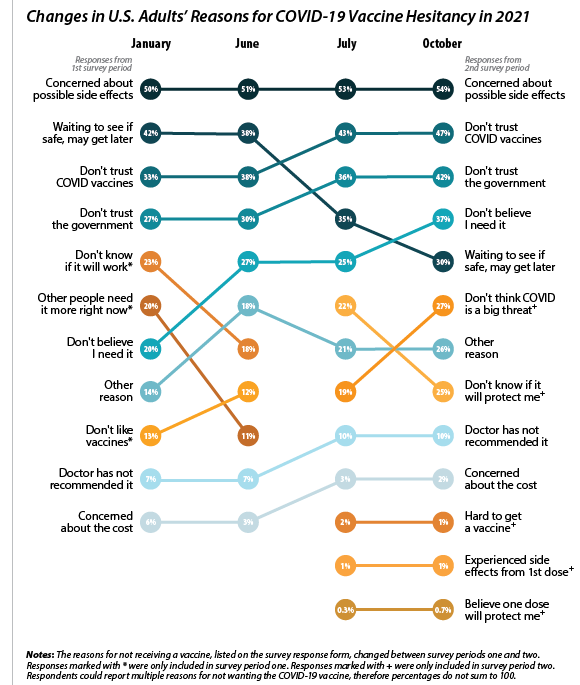 Of the 21.1 percent of people who reported hesitancy in January, nearly half (48.3 percent) cited “Concerns over possible side effects” as a reason.iv This continued to be the most reported reason for hesitancy, with 53.8 percent who were hesitant in October citing it as a reason. The percent of people reporting “Plan to wait and see if it is safe” declined over the 10-month period, from 42.1 percent in January to 30.4 percent in October, and dropped from the second to the fourth most reported reason behind “Don’t trust COVID-19 vaccine” and “Don’t trust the government.” This shift in reasoning behind vaccine hesitancy highlights a major barrier to vaccination goals, as establishing trust is a potentially more difficult and imprecise process than quelling fears of side effects.
When examining survey responses from January and October 2021, our analysis found that both the number of reasons for hesitancy (2.5 per person and 2.9 per person, respectively) and the most common reason for hesitancy (“concerns over possible side effects”) remained statistically unchanged between the two survey periods. Our analysis also found that the rankings of the reasons for hesitancy held within subpopulations by region, race/ethnicity, and income, as highlighted in the following sections.
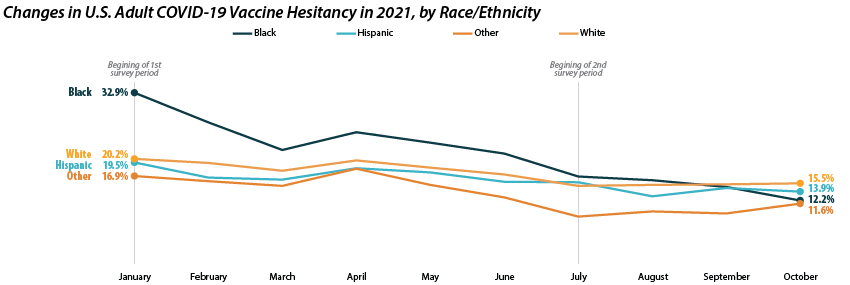
Disparities in vaccine hesitancy improved over time, though many remain.
As with our previous analysis of the HPS, both overall hesitancy and disparities in vaccine hesitancy between demographic and socioeconomic groups has improved, though unevenly. The most notable reduction comes among Black adults, who registered a high of 32.9 percent in January and dropped down to 12.2 percent in October. This decline in vaccine hesitancy essentially closed the gap between Black adults and other racial/ethnical groups. Unfortunately, the rate of decline seems to have reached a plateau among certain demographics. For example, among White adults the hesitancy rate stabilized at around 15.0 percent between July and October.
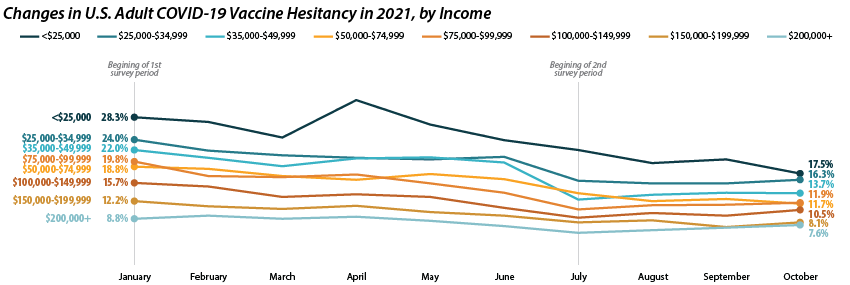
Similar patterns appear when looking within and across income level. Those making less than $25,000 reported the highest level of hesitancy in January at 28.3 percent, but have shown a marked reduction down to 17.5 percent in October. This has significantly closed the gap in hesitancy between this group and those at higher income levels. However, once again, changes within subgroups appear to have reached a stable level of hesitancy. Among those making $50,000-$74,999 this appears to be around 12.0 percent, while for those making $150,000 or more, this appears to be around 7.0 percent.
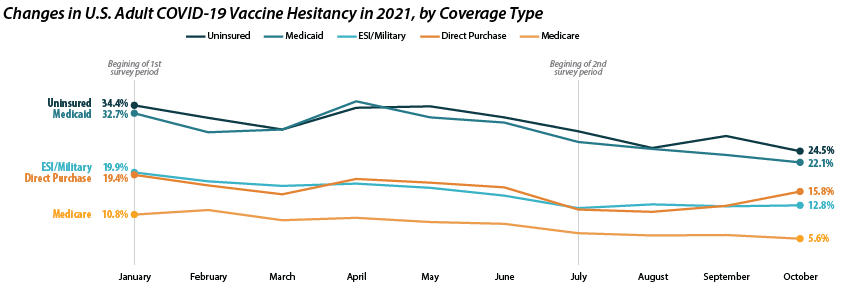
Patterns of reduced vaccine hesitancy followed by rate leveling continued to be true among groups with fewer connections to the health care system, as proxied by insurance status. Hesitancy rates have fallen generally across all insurance statuses; however, the uninsured and those with Medicaid coverage continue to have the highest rates of hesitancy, at 24.5 percent and 22.1 percent in October as compared to those with ESI/Military, Direct Purchase, or Medicare coverage.
Note: All changes and differences in this post are statistically significant at the 95% confidence level unless otherwise noted.
Related Reading
SHADAC Blog: Vaccine Hesitancy Decreased During the First Three Months of the Year: New Evidence from the Household Pulse Survey
SHADAC Blog Series: Measuring Coronavirus Impacts with the Census Bureau's New Household Pulse Survey: Utilizing the Data and Understanding the Methodology
i U.S. Census Bureau. (2021, November 3). 2021 Household Pulse Survey User Notes [Phase 3.2]. https://www2.census.gov/programs-surveys/demo/technical-documentation/hhp/Phase3-2_2021_Household_Pulse_Survey_User_Notes_11032021.pdf
ii This only includes primary series doses and excludes booster doses.
iii This percentage is higher than administratively reported COVID-19 vaccine receipt. The differences are due to both the inclusion of those who “Plan to receive all vaccine doses” and the known discrepancies between administrative and survey data.
iv The HPS allows those who are “Probably going to receive a vaccine” to report reasons for hesitancy; however, this group is not included in our definition of “hesitant.”
Blog & News

Six Measures on SHADAC’s State Health Compare Now Updated to Include Pandemic-era Data for Health Behaviors and Outcomes
March 18, 2022:As part of our commitment to releasing relevant and timely state-level data, estimates for six measures on SHADAC’s State Health Compare web tool have recently been updated with data from the first years of the COVID-19 pandemic, 2020 and 2021. Data for each of these measures is drawn from a variety of different data sources, which are detailed in the notes below.
Measures that have been updated include:
- Alcohol-Involved Deaths (2020)
Alcohol-Involved Deaths is a newer measure that was added to State Health Compare last year. Estimates for this measure provide state-level rates of deaths that were determined to be “alcohol-induced,” as defined by the Centers for Disease Control (CDC), including deaths from conditions such as alcohol poisoning and alcoholic liver disease that CDC considers to be entirely alcohol-attributable (a full listing of which is available on the data measure homepage). Data are available for years 1999 through 2020.
 Opioid-Related Deaths (2020)
Opioid-related Drug Poisoning Deaths is a measure that encompasses all age-adjusted rates of deaths caused by drug poisoning (i.e., overdose) per 100,000 people. Users can select national and state-level estimates for this measure for comparison by individual drug types, including legal (natural and semi-synthetic opioids; synthetic opioids [non-methadone]) and illegal (heroin) opioids, cocaine, and psychostimulants, as well as high-level “all opioids” and “all drugs” categories. Estimates are available from 1999 through 2020.
- Suicide Deaths (2020)
Suicide Deaths provides a measure of age-adjusted deaths from suicide per 100,000 people. Estimates can be viewed across categories that include age, sex, race/ethnicity, firearm or non-firearm method, and metropolitan status. Data are available for years 1999 through 2020.
- Premature Death (2020)
Premature Death measures the average number of years of potential life lost prior to age 75 per 100,000 persons. In addition to viewing this measure for the entire state population, data users can compare rates of premature death by race and ethnicity. Data are available for this measure for years 2000 through 2020.
- Adverse Childhood Experiences (2019-2020)
Adverse Childhood Experiences measures the percent of children (age 0–17) residing in households who had experienced no, one, or two or more adverse childhood experiences (ACEs) out of a possible nine ACEs ([1] hard to cover basics on family's income; [2] parent or guardian divorced or separated; [3] parent or guardian died; [4] parent or guardian served time in jail; [5] saw or heard parents or adults slap, hit, kick, punch one another in the home; [6] was a victim of violence or witnessed violence in neighborhood; [7] lived with anyone who was mentally ill, suicidal, or severely depressed; [8] lived with anyone who had a problem with alcohol or drugs; and [9] treated or judged unfairly due to race/ethnicity). Data users can make national and state-level comparisons of ACEs rates of by age, health insurance coverage type, parental education, poverty level, and race/ethnicity. Data are available for the two-year pooled periods 2016–2017, 2017–2018, 2018–2019, and 2019-2020.
- Unemployment Rate (2021)
Unemployment Rate measures the average annual percent of the civilian labor force (age 16 and older) that was unemployed. Individuals are defined as unemployed if they do not have a job, have actively looked for work in the prior four weeks, and are currently available for work. Users are able to compare data estimates for years 2000 through 2020 for national and state total population; however, only 2000-2020 data is available for viewing by race/ethnicity categories, as 2021 data is still forthcoming.
Notes
Data for Alcohol-involved Deaths, Opioid-related Deaths, and Suicide Deaths come from the CDC WONDER system. Data for Premature Death come from the CDC WISQARS system. Estimates for Adverse Childhood Experiences are produced using microdata from the National Survey of Children’s Health. Data for Unemployment Rate come from the U.S. Bureau of Labor Statistics’ Local Area Unemployment Statistics program.
Publication
New SHADAC Brief Summarizes Study of Effects of Medicaid Expansion on Physician Participation
With the Affordable Care Act's (ACA) expansion of Medicaid, approximately 15 million people were able to enroll in the program - many of whom were previously uninsured. However, researchers have long worried that an expansion of insurance coverage would not translate to an equal expansion in access to care. A particular point of concern is the worry that these newly eligible and enrolled individuals would not be able to find enough physicians who participate in Medicaid to treat them.

Existing research has traditionally relied on physician survey data to study trends in physician acceptance of Medicaid and the factors associated with participation in the Medicaid program. For example, under contract with the Medicaid and CHIP Payment and Access Commission (MACPAC), SHADAC researchers used data from the National Electronic Health Records Survey (NEHRS) to create state-level estimates of physician participation in Medicaid before and after expansion and to study the physician- and practice-level characteristics associated with participation.
However, a new study led by Dr. Hannah Neprash is the first to provide direct answers about how clinicians responded to the Medicaid expansion. In their paper, "The effect of Medicaid expansion on Medicaid participation, payer mix, and labor supply in primary care” published in the December 2021 issue of the Journal of Health Economics, Dr. Neprash and her co-authors use all-payer claims and practice management data from 2012 through 2017 to examine how clinicians changed their labor supply and payer mix in response to Medicaid expansion.
This brief summarizes key findings from this study, including the effect of expansion on the number of Medicaid appointments and number of Medicaid patients seen by primary care clinicians (i.e., Medicaid participation), the total number of appointments provided (i.e., their labor supply) and the share of those appointments paid for by Medicaid versus private coverage or other payers (i.e., payer mix). The study also compares the relative change in participation in states subject to the Medicaid expansion compared to the change in states not subject to the expansion, estimating a causal effect of expansion on clinician participation in Medicaid.
Click on the image to the upper right to access and download a PDF of the full brief.
Related Resources
Physician Acceptance of New Medicaid Patients: Findings from the National Electronic Health Records Survey (MACPAC Fact Sheet)
Explore Physician Acceptance of New Medicaid Patients through Two New Measures on SHADAC’s State Health Compare and in a New MACPAC Factsheet (SHADAC Blog)
Physicians who accept new Medicaid patients (State Health Compare Data Measure)
Blog & News
(Webinar) An Annual Conversation with the U.S. Census Bureau: Addressing Data Quality Challenges in the 2020 American Community Survey
January 5, 2022:
Impacts of the COVID-19 pandemic have been demonstrably far reaching and, by now, fairly well documented. One facet of this COVID-related disruption that has recently come to light is the interruption to data collection processes and response patterns for yearly federal surveys, such as the U.S. Census Bureau's American Community Survey (ACS), that provide estimates of health insurance coverage for the United States population.
On Wednesday, January 19th, SHADAC researchers Kathleen Call and Robert Hest welcomed U.S. Census Bureau expert Mark Klee for a discussion regarding the unique challenges the Census Bureau faced in both data collection and production efforts for the 2020 ACS, resulting in a more limited set of "experimental" estimates being released this year.
Attendees had the opportunity to:
- Learn about impacts of the COVID-19 pandemic on 2020 estimates and data collection efforts in the ACS
- Learn about the methodology behind the production of the 2020 ACS experimental estimates
- Learn about 2020 ACS-related products from both the Census Bureau and SHADAC
Experts Sharon Stern, Laryssa Mykyta, and Nicole Scaniello from the Census Bureau also be joined the webinar for an open forum question and answer session after the presentation.
Resources
Slides from both SHADAC and the U.S. Census Bureau are available to download.
SHADAC
- Comparing Federal Surveys Annual Brief (2021)
- U.S. Census Bureau Analytic Report Shows Significant Non-Response Bias in the 2020 American Community Survey (Blog)
- Current Population Survey (CPS) will Serve as Primary Source of 2020 State-level Data on Health Insurance (Blog)
- Current Population Survey Shows 2020 National Uninsured Rate Stable, Rising in Three States (Blog)
- 2021 CPS ASEC: Fewer Americans Had Health Insurance Coverage in 2020 — Private Coverage Fell while Public Coverage Rose (Blog)
Census Bureau
- An Assessment of the COVID-19 Pandemic’s Impact on the 2020 ACS 1-Year Data (Working Paper)
- Addressing Nonresponse Bias in the American Community Survey during the Pandemic Using Administrative Data (Working Paper)
- How Does the Pandemic Affect Survey Response: Using Administrative Data to Evaluate Nonresponse in the Current Population Survey Annual Social and Economic Supplement (Blog)
- The Influence of COVID-19-Related Data Collection Changes on Measuring Health Insurance Coverage in the 2020 CPS ASEC (Working Paper)
- How Did the Pandemic Affect Survey Response: Using Administrative Data Evaluate Nonresponse in the 2021 Current Population Survey Annual Social and Economic Supplement (Blog)