VISIT STATE HEALTH COMPARE
Publication


Four Methods for Calculating Income as a Percent of the Federal Poverty Guidelines (FPG) in the Behavioral Risk Factor Surveillance System (BRFSS)
 This updated SHADAC brief delves into four common methods for calculating income as a percent of the Federal Poverty Guidelines (FPG) using 2021 estimates from the U.S. Centers for Disease Control and Prevention's Behavioral Risk Factor Surveillance System (BRFSS).
The BRFSS survey collects valuable health-related information from adults, but its income categories don't precisely align with FPG thresholds, which are pivotal in determining eligibility for programs like Medicaid expansion or Affordable Care Act subsidies. To bridge this gap, researchers have utilized various methods to translate categorical income data into more accurate continuous values. The brief discusses how four methods—lower bound, upper bound, midpoint, and uniform distribution—impact income distribution overall and by state, and use 2022 Current Population Survey (CPS) data to compare these methods against actual continuous income data.
The appendix supplies code snippets that showcase the technical process of assigning continuous income using the different techniques, and explains how household size and state of residence influence FPG calculations.
The previous version of this brief published May 2019 can be accessed here.

SHADAC Expertise
Federal Survey Data Release Schedule
American Community Survey (ACS)
An ongoing general household survey conducted by the U.S. Census Bureau provides annual estimates of health insurance coverage at the national, state, and sub-state geographies.
Upcoming Releases
September 12, 2024
• 2023 ACS 1-year Data
October 17, 2024
• 2023 ACS 1-Year Public Use Microdata Sample (PUMS) Files
December 12, 2024
• 2019-2023 5-Year Data
January 23, 2025
• 2019-2023 5-Year Public Use Microdata Sample (PUMS) Files
Previous Year Releases
September 2023
• 2022 ACS 1-year Data
October 2023
• 2022 ACS 1-Year Public Use Microdata Sample (PUMS) Files
November 2023
• 2018-2022 5-Year Public Use Data
January 2024
• 2018-2022 5-Year Public Use Microdata Sample (PUMS) Files
Other Resources
• An Assessment of the COVID-19 Pandemic’s Impact on the 2020 ACS 1-Year Data Analytic Paper
• Introduction to the American Community Survey Public Use Microdata Sample (PUMS) file
Current Population Survey (CPS)
A monthly household survey conducted by the U.S. Census Bureau for the Bureau of Labor Statistics. Data on income and health insurance coverage is collected in its Annual Social and Economic Supplement administered in February through April. Annual health insurance estimates are provided for the nation and states.
Upcoming Release
September 12, 2024
• 2023 Income, Poverty and Health Insurance statistics from the Current Population Survey Annual Social and Economic Supplement (CPS ASEC)
Previous Year Release
September 12, 2023
• 2022 Income, Poverty and Health Insurance Statistics from the Current Population Survey Annual Social and Economic Supplement (CPS ASEC)
Medical Expenditure Panel Survey (MEPS)
MEPS is a two-component survey sponsored by the U.S. Department of Health and Human Services' Agency for Healthcare Research and Quality. The MEPS-Insurance Component (IC) is a survey of employers that provide data on employer-based health insurance. The MEPS-Household Component (HC) is a panel household survey that is supplemented with data from the respondents' medical providers.
Upcoming Releases
July 2024
• 2023 MEPS-IC Private Sector Tables - National Estimates
• 2023 MEPS-IC Private Sector Tables - State Estimates
• 2023 MEPS-IC Private Sector Tables -Metro Estimates
October 2024
• 2023 MEPS-IC Chartbook 2023
November 2024
• 2019-2022 MEPS Panel 24 (COVID Panel) Longitudinal Data File
Previous Year Releases
July 2023
• 2022 MEPS-IC Private Sector Tables - National Estimates
• 2022 MEPS-IC Private Sector Tables - State Estimates
• 2022 MEPS-IC Private Sector Tables - Metro Estimates
National Health Interview Survey (NHIS)
A continuous cross-sectional household interview survey conducted by the National Center for Health Statistics (NCHS) which is part of the Centers for Disease Control and Prevention (CDC). It provides information on the health of the U.S. population and includes questions about health insurance coverage, health care utilization and access, and health conditions and behaviors, in addition to demographic and socioeconomic characteristics.
Estimates for sub-annual time periods are released through the NHIS Early Release Program in September, November/December, and February/March each year.
Current Release
Previous Releases
June 2023
• 2022 NHIS Public Use Files
Behavioral Risk Factor Surveillance System (BRFSS)
A state-based survey sponsored by the Centers for Disease Control and Prevention that focuses on population health, risk factors, and health behaviors for the adult population.
Upcoming Release
August 2024
• 2023 Annual Survey Data
Previous Year Release
August 2023
• 2022 Annual Survey Data
Household Pulse Survey
A near-real-time experimental survey from the U.S. Census Bureau. Typically released on a monthly basis.
Upcoming Release
June 13, 2024
• Phase 4.1 Survey Data
Page last updated July 2024
Blog & News

Considerations from SHADAC: Proposed Revisions to Federal Standards for Collecting Race/Ethnicity Data
March 23, 2023:
|
On January 26, 2023, the Interagency Technical Working Group on Race and Ethnicity Standards released an initial set of recommended revisions to the Office of Management and Budget’s (OMB) Statistical Policy Directive No. 15: Standards for Maintaining, Collecting, and Presenting Federal Data on Race and Ethnicity (SPD 15). SHADAC summarized the proposed revisions to the OMB standards in a recent State Health & Value Strategies Expert Perspective. The public was invited to provide comment on the proposed revisions, and below, we provide text from the feedback that SHADAC submitted to Dr. Karin Orvis, Chief Statistician of the United States, in response to these revisions. We encourage other interested parties to also submit their comments, especially those who can provide state-level perspectives such as state data analysts and policymakers. |
Response from SHADAC
The State Health Access Data Assistance Center (SHADAC) is a health policy research center within the University of Minnesota School of Public Health. We provide technical assistance (TA) to states in the areas of data use and analysis to support policy. The below comments are based on SHADAC’s specific experience supporting states as they address challenges related to the collection of data on race, ethnicity, language, disability, sexual orientation, and gender identity via the Medicaid application.
SHADAC was thrilled to see the revised OMB standards related to the collection of race and ethnicity. The proposed revisions align with available evidence, are consistent with the changes made by leading states, and most importantly, explicitly state that these standards should serve as a minimum baseline with a call to collect and provide more granular data. However, while these standards are specifically named as minimum reporting categories for data collection throughout the Federal Government, if adopted, they are likely to shape data collection and reporting across all sectors, including the states with whom we work that collect race/ethnicity data through the Medicaid application process.
State Medicaid programs have the flexibility to develop their own applications and race and ethnicity questions as long as they meet CMS-established reporting requirements (which follow current OMB guidance). Although many states follow the application model that CMS developed in 2013, our research has found 65 different variations in how these data are collected across all states and modes (e.g., paper, online). Once collected, this information is used in a wide variety of ways: to support state analysis and operation; in reporting to CMS; and to feed into the T-MSIS, which in turn is released as the research-ready T-MSIS data files used by researchers studying Medicaid program health outcomes, health equity, and administrative accountability.
Given the role OMB standards play in shaping state data collection approaches and the obvious impact and reach of these data, we respectfully submit our comments aimed at supporting the adoption of a revised set of standards.
Cross Program and Agency Alignment
Guidance needs to include detail on how any revisions will filter through data collection and reporting across all sectors that impact states/federal interactions. Will all federal agencies adopt the proposed new standards on the same timeline?
For example, all Food and Nutrition Services (FNS) state agencies are currently required to collect race and ethnicity according to prescribed specifications: race and ethnicity must be collected using a two-question format (ethnicity must be collected before race), and the minimum categories must align with OMB standards. Therefore, states with a combined Medicaid/SNAP application currently cannot offer a combined race/ethnicity question even though the most current evidence shows that is the preferred approach. States will want to know whether the adoption of the new proposed OMB standard allowing for a combined race/ethnicity question will supersede the existing FNS guidance on how to collect this information. Or will states that want to pursue a combined question on their combined Medicaid/SNAP application have to wait for updated FNS guidance to be released?
Similarly, existing guidance requires states to share data (including demographic data like race and ethnicity) with health plan carriers via a federally standardized 834 template. States cannot make changes to existing data fields on this form—any changes made currently result in enrollment transaction failures. If OMB standards are updated, how and when will changes be made to the 834 file form to align with these new changes?
Finally, the revisions have implications for state data reporting of race and ethnicity into the Transformed Medicaid Statistical Information System (T-MSIS). If approved, states will need guidance on how to transition to a single data element (combined race and ethnicity). They will need to understand how to streamline or roll-up more granular data and more write-in data and how to manage the likely increase in people who report more than one race.
Data Granularity
The revised guidance rightfully acknowledges the challenges associated with collecting more granular data. If the final guidance recommends the inclusion of an open text response option for each detailed category, states will need detailed, individual guidance on how best to manage those data. While most states prioritize granularity, they simply don’t have the staff time or, in some cases, the expertise to develop the thoughtful and detailed cleaning and coding procedures required to process a large volume of write-in data. In addition, many current IT systems don’t have the functionality to collect and store a large volume of write-in data.
One way to support this would be to develop or enhance an existing hierarchy that includes a long and diverse list of racial and ethnic categories, such as the Centers for Disease Control Race Category and Ethnicity Groupings. Another way to support the use and reporting of disaggregated data is to provide technical support and guidance around data use standards. This could include standards around recency, maximum “refusal to answer” thresholds, data missingness thresholds, and sample size thresholds that guide suppression of publication.
Technical Assistance
States need direct technical assistance (TA) to support the successful implementation of revised standards. This will need to go beyond documentation and guidance. To do this well, states should have access to experts who can provide practical, hands-on advice that is responsive to their specific needs. The type of assistance needed will vary. States with sophisticated analytic teams may seek advice on how to bridge race and ethnicity data collected under one method with data collected under a revised method. Other states may need more fundamental support to implement the expanded race/ethnicity option in a way that is the least disruptive to their current data collection structure.
We would also recommend that any TA effort include a forum for states to discuss implementation challenges with their peers and serve as a repository for promising practices. States will face different challenges but always appreciate having a forum to discuss problems and solutions with other state officials. In addition, there is limited research on best ways to collect data on race and ethnicity and even less on operational considerations for collecting this information in an administrative context like a Medicaid application. Technical assistance should encourage and support the evaluation of systems’ improvements and serve as a clearinghouse for sharing key findings.
To build trust with the enrollees from whom this data is being collected, states would also benefit from technical assistance or model training materials on the best ways to communicate why this data is being collected and how it is being used (e.g., TA on effective forms of community engagement, Navigator or assister training, or instructional language scripts for frontline workers.)
Funding
Questions that collect race and ethnicity data within the Medicaid application are embedded in many other complex and multifaceted questions about topics such as employment, income, household composition, etc. The systems that collect and house this information vary in their age, technical capacity, and purpose. Almost uniformly, they are complex and expensive to change, both in terms of data collection but also data transfer, reporting, and sharing. Ideally, states can access new dedicated funding or receive clear guidance on how existing federal money can be used to make necessary IT and systems changes.
The funding associated with this effort should also be flexible. It should support direct costs like system modifications but also priorities such as stakeholder engagement, instructional language development, and training—all of which are critical to successfully implementing the revised data collection guidance.
Urgency of Additional Guidance
While we are encouraged to see revised standards related to race and ethnicity data collection, we want to stress the urgency of revised guidance related to data collection on sexual orientation, gender identity, primary language, and disability. The current standards on sex are woefully inadequate, to the point of causing harm to people who identify as belonging to a sexual or gender minority population. Standards around disability and language are similarly lacking. Given the intersectionality of these concepts as they relate to identity, it’s important to make progress on updating standards for all areas, not just one. In addition, if states are to make significant investments to modify application wording as well as data systems and reporting structures to improve the collation of race and ethnicity, it makes sense to do this with the knowledge and understanding of timing for future changes regarding sexual orientation, gender identity, primary language, and disability. At the best, these timelines could be aligned, and at the least, states should have visibility to when those revisions are likely to be released.
Publication
Better Health through Data: Improved Collection of Demographic Data in Medicaid
SHADAC Deputy Director Elizabeth Lukanen served as an expert panelist for an Alliance for Health Policy briefing hosted by Arnold Ventures titled "Better Health through Data: Opportunities and Limitations of Health Data" which was held virtually on October 6, 2022. This event reviewed the importance and use of health data in addressing health disparities, the main barriers that persist in limitations to health data, and policy levers that can improve health data collection and utilization at the federal level including changes to data standards and systems, incentives and requirements, education and technical assistance, and regulation.

Elizabeth's presentation specifically focused on Medicaid Administrative Data and how SHADAC has been working to evaluate activities aimed at improving response rates and enhancing the quality of these data at the state level. She also highlights efforts by a few states – Oregon, New York, and Maryland – that have done a lot of work to fill gaps in their demographic data collection of Medicaid enrollees.
Visit the Alliance for Health Policy event page for further details, resources provided by the panelists, and a recording of this event.
Related resources supported by State Health and Value Strategies (SHVS):
- Issue Brief - Collection of Race, Ethnicity, Language (REL) Data in Medicaid Applications: A 50-state Review of the Current Landscape
- Issue Brief - Collection of Sexual Orientation and Gender Identity (SOGI) Data: Considerations for Medicaid and Spotlight on Oregon
- Expert Perspective - Exploring Strategies to Fill Gaps in Medicaid Race, Ethnicity, and Language Data
- Expert Perspective - New York State of Health Pilot Yields Increased Race and Ethnicity Question Response Rates
Blog & News

Understanding the Medicaid MAGI and CHIP Application Process Time Performance Indicator
July 21, 2022:The speed and accuracy with which state Medicaid programs process applications will become increasingly important as the COVID-19 Public Health Emergency (PHE) comes to an end. Once states phase out the PHE, they will have to manage new Medicaid and Children’s Health Insurance Program (CHIP) applications at the same time they start processing the unprecedented volume of redeterminations and renewals that were on hold due to the continuous enrollment condition of the Families First Coronavirus Response Act (FFCRA). One performance indicator that provides a window into how efficiently state Medicaid programs process their Medicaid Modified Adjusted Gross Income (MAGI) and CHIP applications is Medicaid MAGI and CHIP Application Processing Times. This indicator was developed in 2013 to improve both programs through the provision and analysis of quality data. The Centers for Medicare and Medicaid Services (CMS) released its fourth update of this indicator in April 2022, which also appears as a measure of State Administrative Accountability on the Medicaid & CHIP Scorecard. In this blog, we provide an overview of the performance indicator and highlight the following themes that have emerged since the last reporting period (February – April 2021):
- Many states saw improvements in their processing times even as timeliness standards were relaxed during the PHE. Nearly 71 percent of all determinations on applications were conducted in less than 7 days.
- More than 51 percent of all determinations on applications were conducted in under 24 hours. On average, expansion states had a larger percentage of applications being processed under 24 hours than non-expansion states.
- 31 states either improved the number of applications processed within seven days, or stayed the same from 2020.
- Only 5 percent of all determinations do not meet CMS standards because they were conducted in over 45 days.
Overview of Performance Indicator and Data Quality
Every month, CMS relies on state Medicaid and CHIP agencies to collect and submit eligibility and enrollment data as part of CMS’ Performance Indicator Project. The MAGI and CHIP application processing times performance indicator provides an understanding of how many calendar days it takes between when the state agency receives an application and when it made a final eligibility determination using the MAGI standard. Determinations must be made within 45 days for new MAGI Medicaid applicants, and once the PHE ends, state agencies will have 4 months to resume timely application processing for both MAGI and non-MAGI Medicaid applications. States are not required to meet the timeliness standards for application processing due to COVID-19, which provides important context for these performance indicator findings: with increased applications and relaxed rules, many states were still able to make improvements to processing times during a time of crisis.1
The CMS provides technical assistance to ensure timely and accurate eligibility determinations – states are continuously improving their data quality for Medicaid MAGI and CHIP application times. Only three states - California, Nevada, and South Dakota - are not reporting on this indicator in 2021 (based on CMS’ specifications), which is a marked improvement from five states not reporting in 2020. However, it is important to note that this report only shows three months out of the year, and these data are constantly fluctuating based on policy changes and other factors that may or may not be state-specific.
Changes to MAGI Medicaid and CHIP Processing Times in 2021 by State
On average, close to 71 percent of applications were processed within seven days, which is well-above the CMS standard and an increase from 2020. Additionally, 19 states and the District of Columbia have processed their applications quicker than the seven day national average (see Figure 1). More than 51 percent of all determinations on applications were conducted in under 24 hours, which increased from 2020 as well.
Figure 1. Average Percent of MAGI Medicaid and CHIP Applications Processed within 7 days, States vs National, 2021
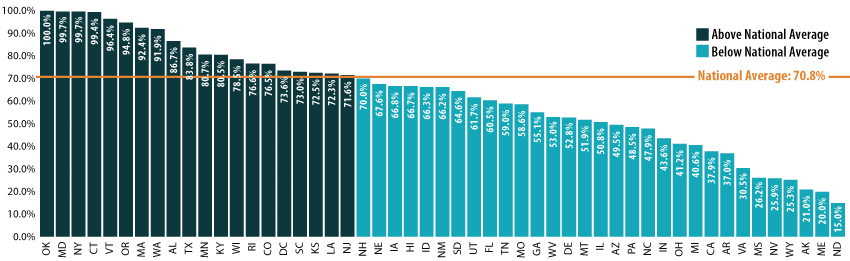
Source: SHADAC analysis of CMS Medicaid MAGI and CHIP Application Processing Times, 2021, available here: https://www.medicaid.gov/state-overviews/medicaid-modified-adjusted-gross-income-childrens-health-insurance-program-application-processing-time-report/index.html
In 2021, 31 states either improved the number of applications processed within seven days or stayed the same from 2020. (Almost the same number – although a slightly different mix – of states showed improvements in this indicator between 2019 and 2020 as well.) Oklahoma was one of two states that stayed the same (the other being Maryland) and had the highest number of applications (100%) processed; this was also achieved within 24 hours. Texas saw the greatest improvement, with a 46.7 percentage point [pp] increase. Texas’ level of improvement was followed by Iowa (43.7pp increase with 66.8 percent of applications processed within seven days in 2021), Georgia (42.6pp increase; 55.1 percent of applications processed within seven days), Missouri (41.5pp increase; 58.6 percent of applications processed within seven days), and Vermont (39.0pp increase; 96 percent of applications processed within seven days). In general, there are still nearly 5 percent of applications processed after 45 days (therefore not meeting the CMS standard) though this indicator has decreased from 2020.
On average, states that adopted the Affordable Care Act (ACA) Medicaid expansion had a larger percentage of processed applications within 24 hours than non-expansion states–an average of 40.5 percent of applications were processed within 24 hours by expansion states, compared to an average of 22.9 percent processed within 24 hours by non-expansion states. However, the average percentage of processed applications from both expansion and non-expansion states are comparable within 7 days, at 62.8 percent and 61.1 percent respectively.2
Medicaid enrollment grew significantly during the COVID-19 pandemic, driven by job and income loss as well as maintenance of eligibility (MOE) requirements. From February 2020 to April 2021, enrollment grew by 15.5 percent, and a rapid mini-survey of Medicaid directors from 44 states showed 8.9 percent enrollment growth for the 2022 fiscal year overall.3,4 However, application increases varied widely state-by-state. In general, application growth was significant, as 17 states saw an increase in applications in 2020 compared to 2019 (according to a national survey conducted by the Kaiser Family Foundation and the Georgetown University Center for Children and Families). Seven of those states reported increases higher than 10 percent.5, Of the 17 states experiencing application increases, over half saw a greater share of those applications being processed within 7 days.6 In addition, few of these states reported application backlogs.
However, there were nearly 29 percent fewer applications during the February to April 2021 reporting period compared to 2020. States that did not experience application increases could attribute this to a number of factors, including “smaller than expected declines in employer-sponsored insurance, [or] a drop in applications early in the pandemic due to office closures and the elimination of reapplications (where an individual loses coverage, often due to procedural reasons, then reapplies a short time later) due to the MOE requirements”.7
Conclusion
The CMS’ latest update on MAGI and CHIP application processing shows an overall improvement regarding processing times, despite significant increases in application volumes and the relaxation of timeliness standards during the PHE. While processing times have improved, there are still challenges with streamlined eligibility, enrollment, and renewal processes. CMS recently released a resource to remind states on best practices to process new applications, challenges to anticipate, and how to meet the requirements associated with submitting their data after the PHE. SHADAC has previously highlighted enrollment and renewal challenges that predated the pandemic as well as mitigation strategies. As we take these challenges into consideration alongside the end of the COVID-19 PHE, it will be necessary to continue monitoring this indicator for improvements and setbacks.
1 CMS. (2021, January 6). Covid-19 Frequently Asked Questions (FAQs) for State Medicaid and Children's Health Insurance Program (CHIP) Agencies. https://www.medicaid.gov/state-resource-center/downloads/covid-19-faqs.pdf
2 CMS. (2022, April 21). Medicaid MAGI and CHIP Application Processing Time Report. https://www.medicaid.gov/state-overviews/downloads/magi-application-time-report-2021.pdf
3 Williams, E. (2021, October 27). Medicaid Enrollment & Spending Growth: FY 2021 & 2022. Kaiser Family Foundation. https://www.kff.org/medicaid/issue-brief/medicaid-enrollment-spending-growth-fy-2021-2022/
4 Williams, E., & Hinton, E. (2022, April 4). Medicaid Spending and Enrollment: Updated for FY 2022 and Looking Ahead to FY 2023. Kaiser Family Foundation. https://www.kff.org/medicaid/issue-brief/medicaid-spending-and-enrollment-updated-for-fy-2022-and-looking-ahead-to-fy-2023/
5 Brooks, T., Gardner, A., Tolbert, J., Dolan, R., & Pham, O. Medicaid and CHIP Eligibility and Enrollment Policies as of January 2021: Findings from a 50-State Survey. Kaiser Family Foundation. https://www.kff.org/report-section/medicaid-and-chip-eligibility-and-enrollment-policies-as-of-january-2021-findings-from-a-50-state-survey-report/
6 SHADAC analysis of CMS Medicaid MAGI and CHIP Application Processing Time Report. https://www.medicaid.gov/state-overviews/downloads/magi-application-time-report-2021.pdf
7 Brooks, T., Gardner, A., Tolbert, J., Dolan, R., & Pham, O. Medicaid and CHIP Eligibility and Enrollment Policies as of January 2021: Findings from a 50-State Survey. Kaiser Family Foundation. https://www.kff.org/report-section/medicaid-and-chip-eligibility-and-enrollment-policies-as-of-january-2021-findings-from-a-50-state-survey-report/