VISIT STATE HEALTH COMPARE
Publication


Virtual Tour of State Health Compare (Webinar)
May 23, 2017, at 12:00 p.m. Central / 1:00 p.m. Eastern
On May 23rd, SHADAC hosted a virtual tour of State Health Compare, a new, user-friendly online tool for obtaining and comparing state-level estimates related to health and health care.
![]() State Health Compare: How's It Different?
State Health Compare: How's It Different?
State Health Compare combines estimates previously available separately through the SHADAC Data Center and the Robert Wood Johnson Foundation (RWJF) Data Hub. The new, merged tool brings together estimates on a wide range of health-related topics in an effort to allow analysts and policymakers to view state-level data through a broad Culture of Health lens.
The Virtual Tour: What Will You Learn?
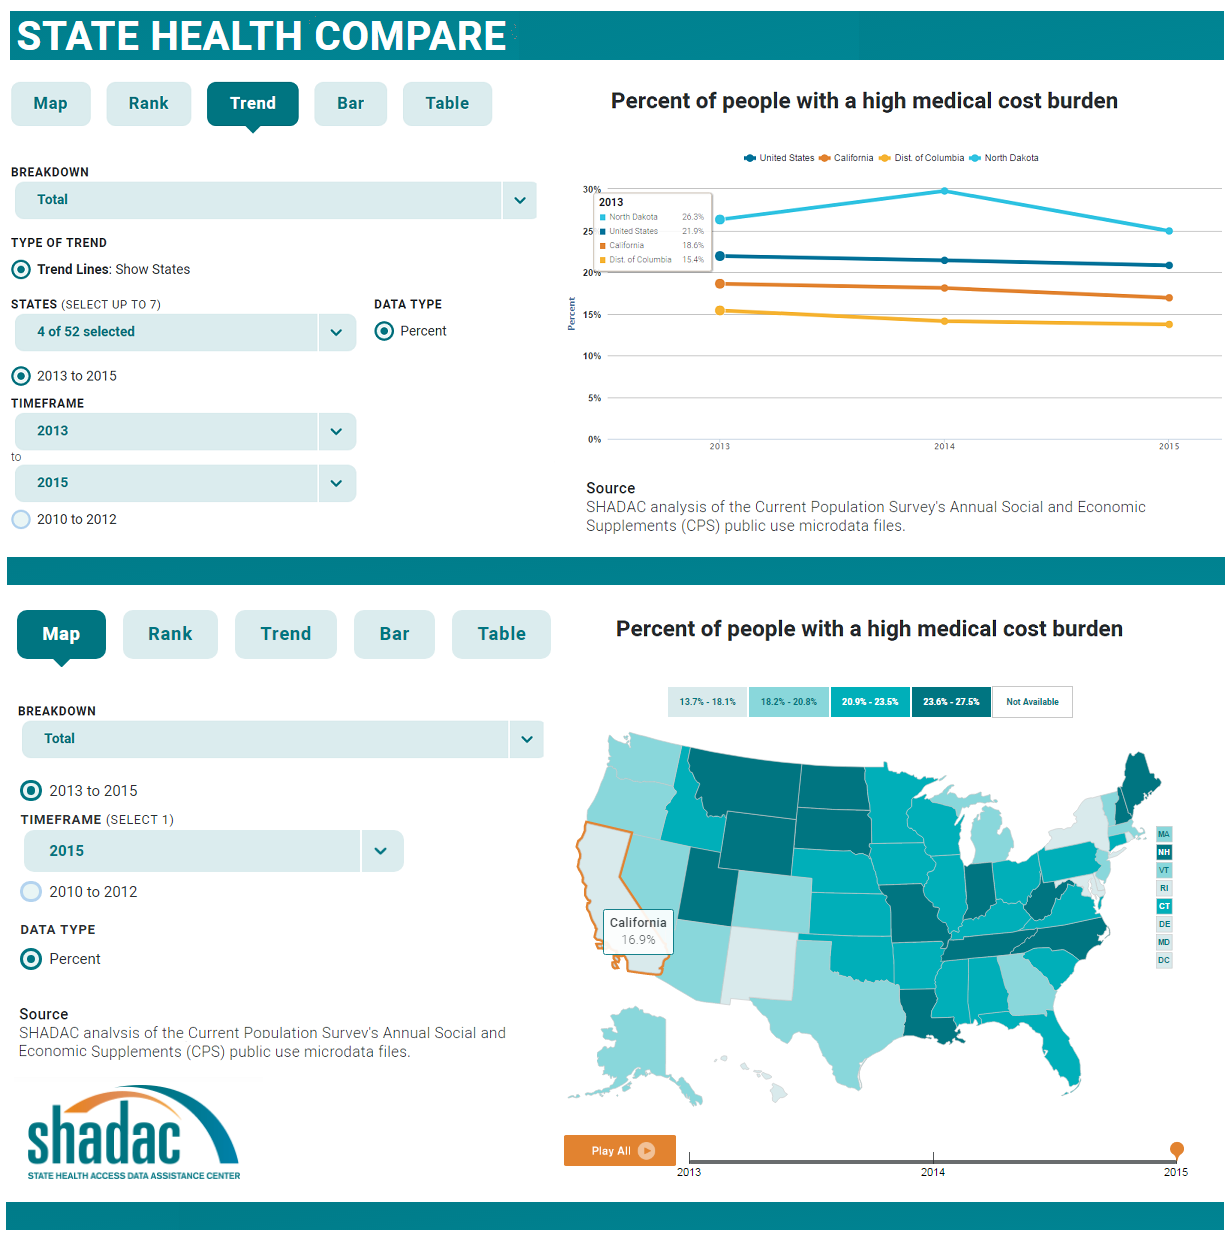
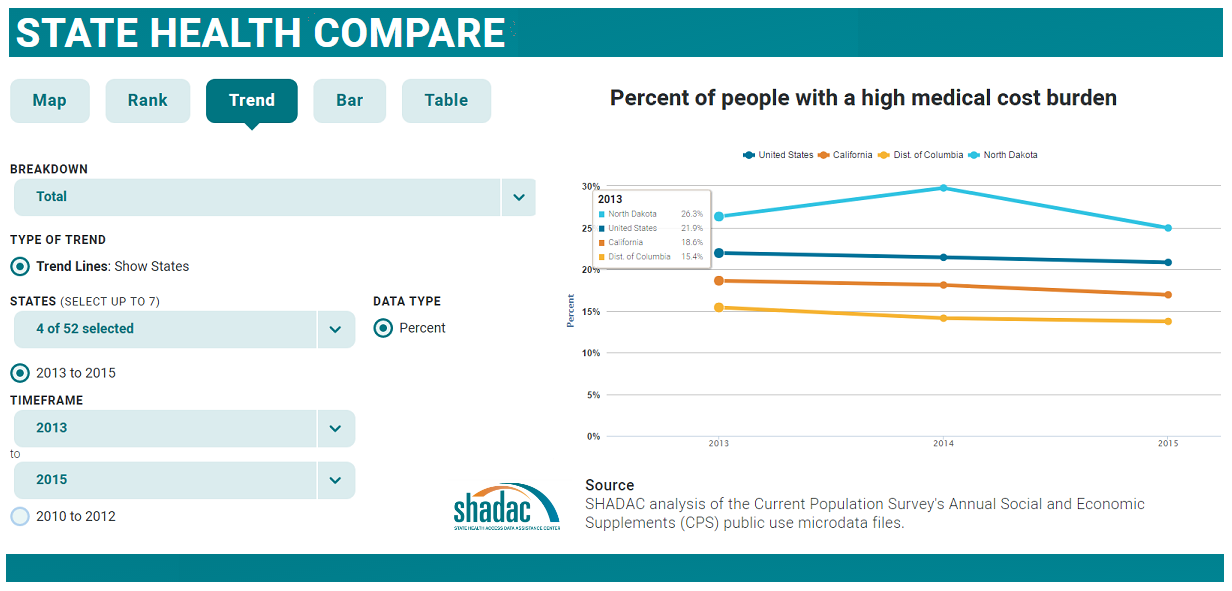
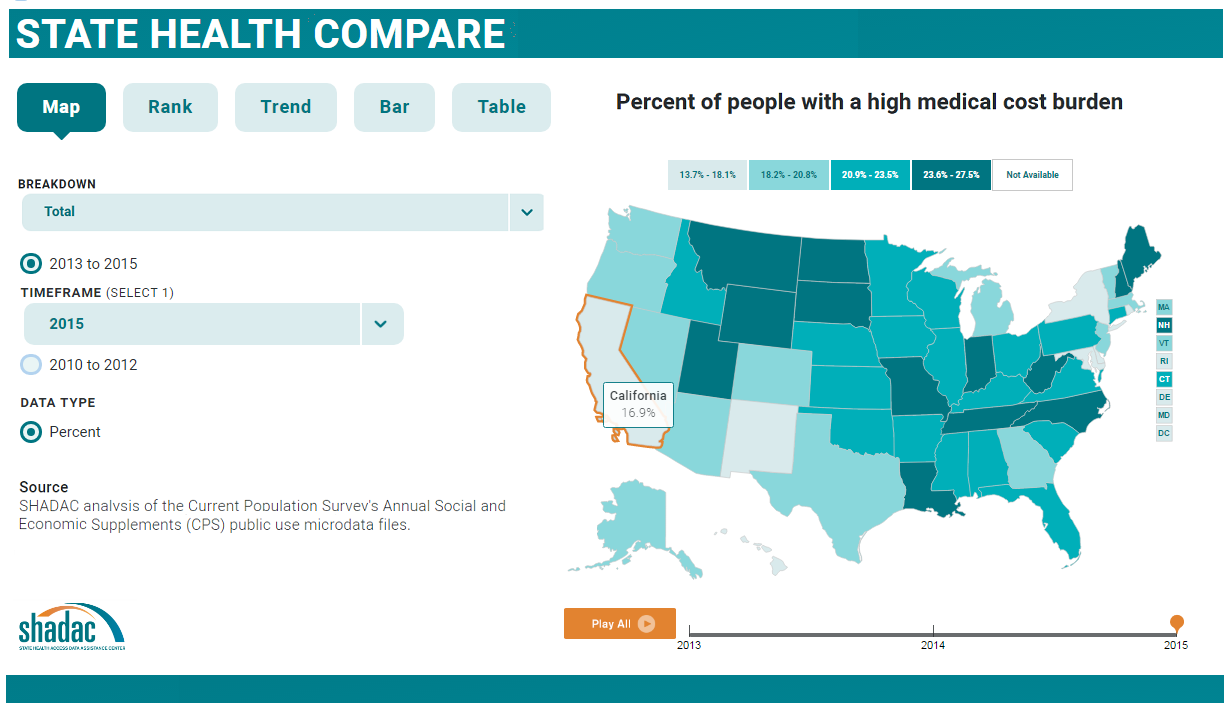
SHADAC Senior Research Fellow Joanna Turner guided attendees on a tour of State Health Compare's user interface. Ms. Turner provided an overview of available estimates and showed how users can generate maps, bar charts, trend lines, and tables to examine the estimates within and across states and over time, as well as by characteristics such as age, race/ethnicity, etc. Attendees also learned how to download graphics and export the underlying data.
Ms. Turner was joined on the webinar by Carolyn Miller, Senior Program Officer at RWJF, and by SHADAC Director Lynn Blewett. SHADAC Senior Research Fellow Brett Fried will also be available to answer questions.
View the presentation slides here or watch the recording below.
View the event transcript here.
Related Resources
Hest, R. (2017). "Significance Testing Using State Health Compare." SHADAC Technical Brief. Minneapolis, MN: State Health Access Data Assistance Center.
SHADAC. (2013). "Using SHADAC Health Insurance Unit (HIU ) and Federal Poverty Guideline (FPG) Microdata Variables." SHADAC Technical Brief.Minneapolis, MN: State Health Access Data Assistance Center.
SHADAC. (2011). "FPG vs. FPL: What's the Difference?" SHADAC Blog. Minneapolis, MN: State Health Access Data Assistance Center.

Blog & News

New NHIS Data: Insurance Coverage Mostly Stable in 2016
May 17, 2017: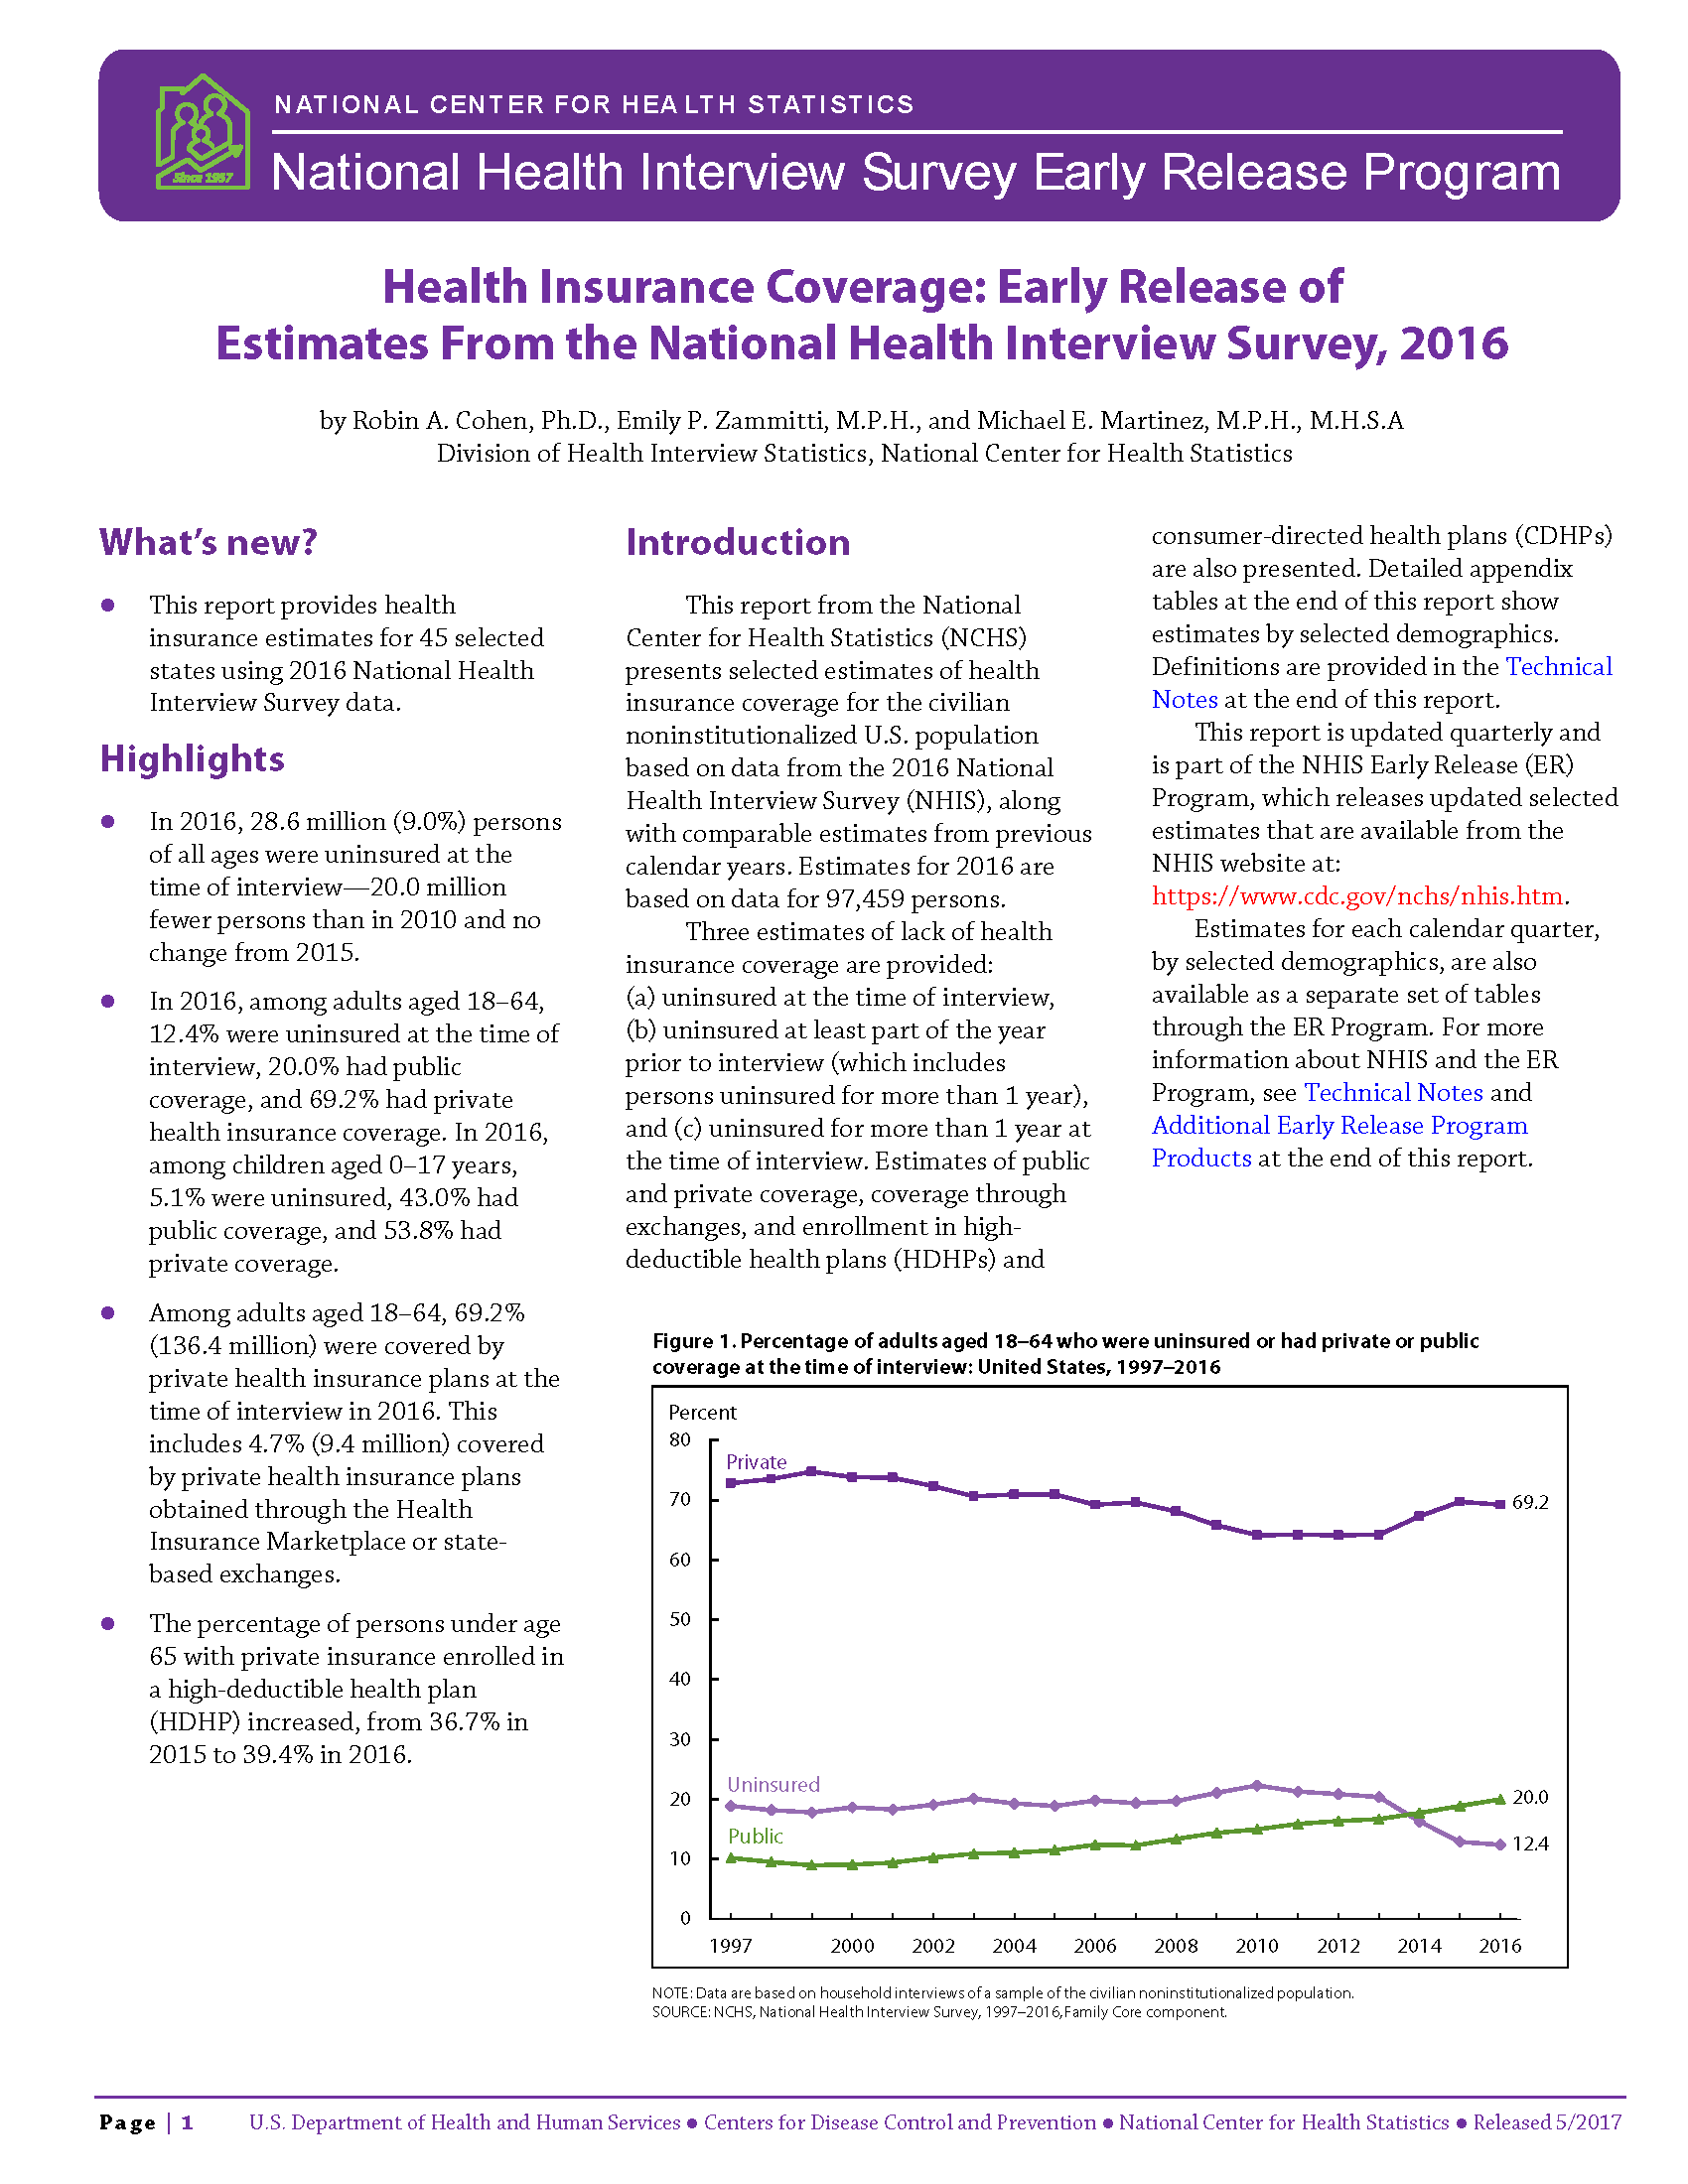 The National Center for Health Statistics (NCHS) released health insurance coverage estimates for 2016 from the National Health Interview Survey (NHIS) as part of the NHIS Early Release Program. These are the first available full-year coverage estimates for 2016 from a federal survey, with full-year estimates also available for 45 states.
The National Story: Coverage Was Largely Stable, Enrollment in High-Deductible Health Plans Continued to Climb
With only a few exceptions, coverage and uninsurance rates remained stable between 2015 and 2016.
Coverage by Type
Adults (18-64 years)
The new estimates show that among adults aged 18 to 64, only the rate of public coverage changed significantly, increasing 1.1 percentage points. Uninsurance and private coverage were statistically stable. Among this group, in 2016:
- 12.4% (24.5 million) were uninsured at the time of interview
- 20.0% had public coverage (vs. 18.9% in 2015)
- 69.2% had private coverage
Children (0-17 years)
The rates of coverage for children (0-17 years) by type of coverage were statistically unchanged from 2015. Among this group in 2016:
- 5.1% (3.8 million) were uninsured at the time of interview
- 43.0% had public coverage
- 53.8% had private coverage
The Uninsured
Adults (18-64 years)
Not only did uninsurance hold steady from 2015 to 2016 among non-elderly adults taken as a whole, but the distribution of uninsurance among subgroups remained stable:
- Adults aged 25 to 34 years continued to be the most likely to be uninsured, with nearly twice the uninsured rate of 45-64 year olds (16.5% vs. 8.9%).
- Adults aged 18 to 24 and adults aged 35 to 44 once again had similar rates of uninsurance, at 13.7 and 14.4, respectively.
Children (0-17 years)
Uninsurace among children was stable overall between 2015 and 2016; however, a breakdown by poverty status and coverage type shows that the percentage of poor children (<100% FPL) who were uninsured at the time of interview increased significantly, from 4.4 to 6.5 percent.
Race/Ethnicity
Rates of uninsurance remained stable between 2015 and 2016 for all measured racial/ethnic groups. The population of individuals identifying as Hispanic/Latino remained the most likely to be uninsured, with 19.3% of Hispanics/Latinos under age 65 lacking coverage. The population of individuals identifying as Asian remained the least likely to be uninsured, with 6.3% of Asians under age 65 lacking coverage.
Enrollment in High-Deductible Health Plans
Among persons under the age 65 with private health insurance, the percentage who were enrolled in a high deductible health plan (HDHP) increased in 2016. Among this age group:
- 39.4 percent were enrolled in an HDHP (vs. 36.7% in 2015)
- 15.5 percent were enrolled in HDHPs that incorporated health savings accounts (vs. 13.3% in 2015)
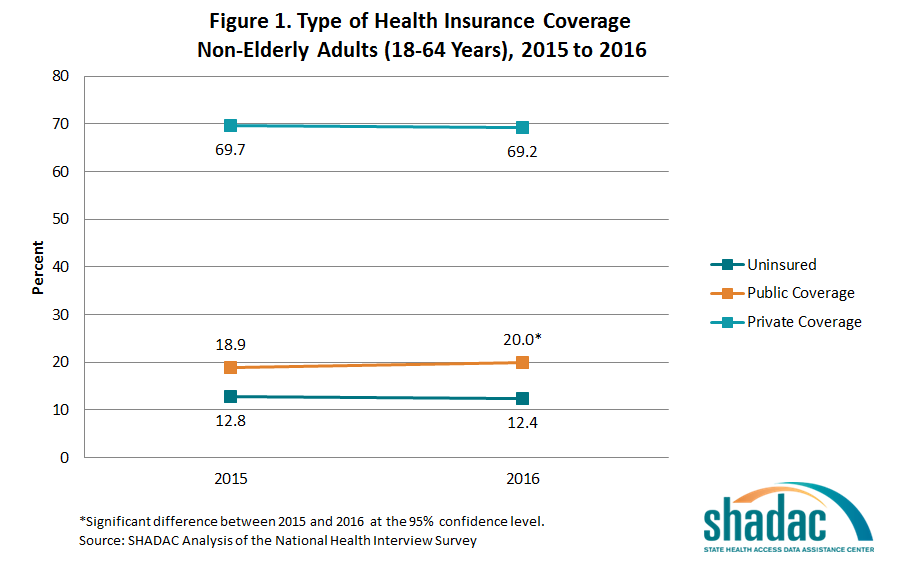
In the States: Overall Coverage Stability Mirrors National Story, Uninsurance More Common in Non-Expansion States
NHIS estimates of the uninsured are available for 45 individual states with sufficient sample size for the 2016 calendar year. Among states with estimates available for both 2015 and 2016, only two saw a significant change in uninsurance: In Arkansas, uninsurance declined 4.7 percentage points, from 11.8% to 7.1%; and in Wisconsin, uninsurance increased 2.0 percentage points, from 3.7% to 6.5%
State Medicaid Expansion Status
In both Medicaid expansion states and non-expansion states, rates of uninsurance and public and private coverage remained stable among non-elderly adults (18 to 64) from 2015 to 2016.
Among adults ages 18 to 64 living in expansion states in 2016:
- 9.2 percent were uninsured at the time of interview
- 70.0 percent had private coverage
- 22.5 percent had public coverage
Among adults ages 18 to 64 in 2016 living in states that did not expand Medicaid:
- 17.9 percent were uninsured at the time of interview
- 67.8 percent had private coverage
- 15.7 percent had public coverage
Non-elderly adults in expansion states continued to be less likely to be uninsured than non-elderly adults in non-expansion states in 2016, with uninsurance in expansion states at 9.2% and uninsurance in non-expansion states at 17.9%.
View the NCHS Early Release Report, "Health Insurance Coverage: Early Release of Estimates from the National Health Interview Survey, 2016."
Related Content
Access NHIS estimates for 2013 to 2015 for insurance coverage and health care access, utilization and costs at State Health Compare, SHADAC's new, user-friendly online tool for obtaining and comparing state-level estimates related to health and health care. For background on leveraging State Health Compare to explore the NHIS, read "Using State Health Compare to Analyze Estimates of Health Care Access, Cost, and Utilization" (SHADAC Blog, May 16, 2017).
About the NHIS Early Release Program
The new NHIS estimates were published as part of the NHIS Early Release Program, through which analytic reports and preliminary microdata files are made available on an expedited schedule so that data users have access to the most recent NHIS information without having to wait for the final annual NHIS microdata files to be released after the end of each data collection year. The early release reports and files are produced prior to final data editing and weighting.
Blog & News
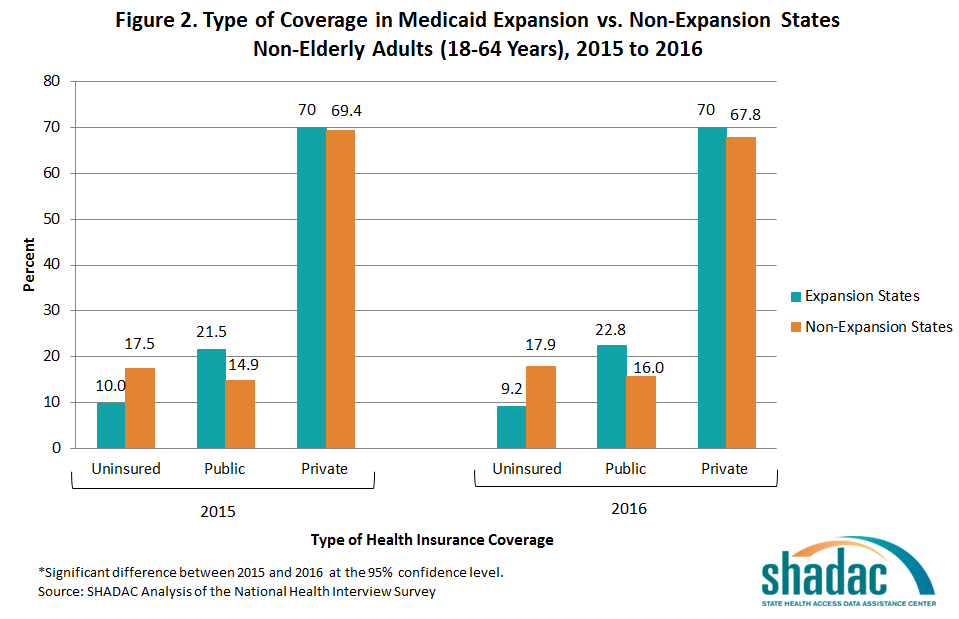
New Analysis Shows Impact of ACA on Uninsured by Congressional District
September 05, 2019:A new SHADAC analysis[i] provides information about the impacts of the Affordable Care Act (ACA) on the uninsured by Congressional District, for all 50 states (435 Congressional Districts). The analysis, funded by the California Health Care Foundation, includes detailed infographics and data tables illustrating changes in the number and rate (percentage) of uninsured between 2013 and 2015 across all Congressional Districts and for a range of demographic groups within each Congressional District including: race/ethnicity; income; citizenship; educational attainment; and employment status.
Notably, all but five of the Congressional Districts (out of 435 nationwide) experienced a statistically significant decline in the uninsured rate between 2013 and 2015. However, there was considerable variation in the magnitude of these declines. The percentage point decline in the uninsured ranged from 14.5 in the 34th Congressional District of California to slightly less than one percentage point in the third Congressional District of Massachusetts.
There was also variation in the impact of the ACA on the uninsured for subgroups within individual Congressional Districts. For example, in many Congressional Districts those with lower incomes and less education experienced larger declines in uninsurance following the ACA. The infographics provide intuitive, “at a glance” visualizations of these important differences.
Access the 2013-2015 Congressional District uninsured estimates.
[i] Source: SHADAC analysis of U.S. Census Bureau 2013 and 2015 American Community Survey's Table S2701 and S2716 downloaded from American FactFinder; http://factfinder2.census.gov; (March 2017)
Blog & News
Announcing: State Health Compare, a New Online Tool to Study State Health Estimates
May 25, 2017:SHADAC invites you to explore State Health Compare, a new, user-friendly online tool for obtaining and comparing state-level estimates related to health and health care.
 State Health Compare combines estimates previously available separately through the SHADAC Data Center and the Robert Wood Johnson Foundation (RWJF) Data Hub. The new, merged tool brings together estimates on a wide range of health-related topics in an effort to allow analysts and policymakers to view state-level data through a broad Culture of Health lens.
Topics for which estimates are available through State Health Compare include: health insurance coverage, cost of care, health behaviors, health outcomes, acccess to and utilization of care, care quality, public health, and socioeconomic indicators.
Users can explore these topics within and across states and look at trends over time and by characteristics such as age, race/ethnicity, etc., through user-generated maps, bar charts, trend lines, and tables. Graphics are easily downloadable, and the underlying data can be exported.
Explore State Health Compare.
SHADAC's Virtual Tour of State Health Compare on May 23rd
SHADAC provided a virtual tour of State Health Compare during a webinar on Tuesday, May 23rd, at 12:00 p.m. Central. SHADAC Senior Research Fellow Joanna Turner led the tour and answered questions from attendees. Ms. Turner was joined by Carolyn Miller, Senior Program Officer at the Robert Wood Johnson Foundation, and by SHADAC Director Lynn Blewett.
Visit the event page to view presentation slides, transcripts, and a recording of the virtual tour.
Publication
May 23rd Virtual Tour of State Health Compare: A New Online Tool to Study State Health Estimates
Join us for a virtual tour of State Health Compare, a new, user-friendly online tool for obtaining and comparing state-level estimates related to health and health care.
State Health Compare: How's It Different?
State Health Compare combines estimates previously available separately through the SHADAC Data Center and the Robert Wood Johnson Foundation (RWJF) Data Hub. The new, merged tool brings together estimates on a wide range of health-related topics in an effort to allow analysts and policymakers to view state-level data through a broad Culture of Health lens.
 The Virtual Tour: What Will You Learn?
Ms. Turner will be joined on the webinar by Carolyn Miller, Senior Program Officer at RWJF, and by SHADAC Director Lynn Blewett. SHADAC Senior Research Fellow Brett Fried will also be available to answer questions.