VISIT STATE HEALTH COMPARE
Blog & News


Issue Brief: Unwinding the Medicaid Continuous Coverage Requirement - Transitioning to Employer-Sponsored Coverage (State Health & Value Strategies Cross-Post)
January 2023:The following content is cross-posted from State Health and Value Strategies, published on January 19, 2023.
Authors: Elizabeth Lukanen and Robert Hest, SHADAC
 Medicaid and the Children’s Health Insurance Program (CHIP) have played a key role in the response to the COVID-19 pandemic, providing a vital source of health coverage for millions of people. The Families First Coronavirus Response Act (FFCRA) implemented a continuous coverage requirement in Medicaid, coupled with an increase in federal payments to states. The requirement has prevented states from disenrolling Medicaid enrollees, except in limited circumstances, allowing millions of Americans continued access to healthcare services during the pandemic.
Enrollment in Medicaid and CHIP has grown sharply since February 2020, with more than 20 million enrollees added to state rosters as of September 2022. Continuous coverage can also likely be credited for the decrease in the number of people who were uninsured in 2021, down to 8.6% from a pre-pandemic level of 9.2% in 2019. This was driven by a 1.4 percentage point increase in public coverage in 2021, to 36.8% from 35.4% in 2019. These trends were mirrored across states, with 28 states experiencing significant decreases in their rates of uninsurance. Meanwhile, 36 states saw rising rates of public coverage with none seeing a decline in public coverage.
When the unwinding of the Medicaid continuous coverage requirement begins, states will restart eligibility redeterminations, and millions of Medicaid enrollees will be at risk of losing their coverage. Estimates vary, but most approximate that in the range of 15 million to 18 million people will lose Medicaid coverage, with some portion exiting because they are no longer eligible, some losing coverage due to administrative challenges despite continued eligibility, and some transitioning to another source of coverage. While much attention has been paid to how states can approach the unwinding of the continuous coverage requirement to prioritize the retention of Medicaid coverage and transitions to marketplace coverage, less attention has been paid to the role of employer-sponsored insurance.
To get a sense for the size of the group that might have employer-sponsored coverage as an option, this issue brief discusses the proportion of individuals with an offer of employer-sponsored coverage by income and state, and the proportion of those offers that are considered affordable based on premium cost. The issue brief also discusses the importance of a Medicaid disenrollment survey to monitor the coverage transitions associated with the unwinding.
A companion issue brief, Helping Consumers Navigate Medicaid, the Marketplace, and Employer Coverage, discusses how state Medicaid agencies, state-based marketplaces, labor departments, and employers can play critical roles in helping people understand and navigate their employer coverage options.
To support communications efforts during the unwinding, SHVS has also produced sample messaging for state departments of labor to share with the employer community which explains the unwinding and coverage options for employees.
Publication
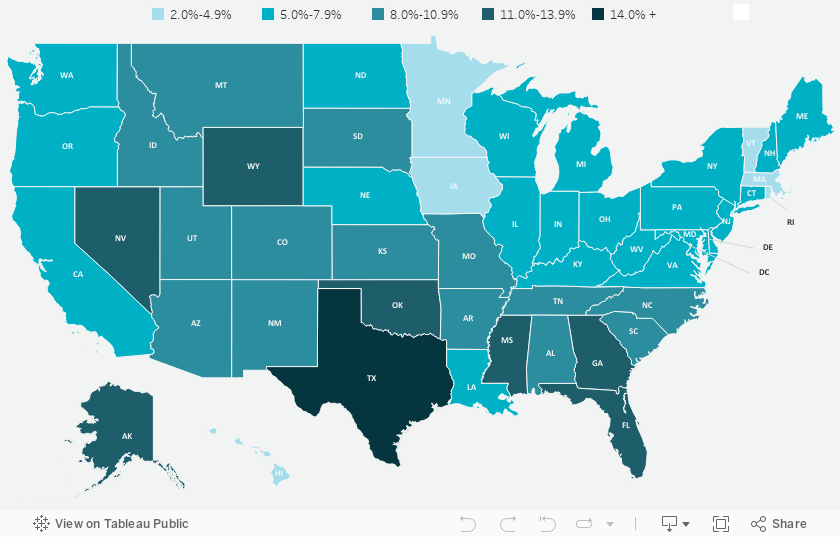
2021 ACS Data: State and County Uninsured Rates, with Comparison Year 2019
Each year, SHADAC uses data released from the American Community Survey (ACS) via the U.S. Census Bureau's data.census.gov tool to produce estimates of uninsurance at the state and county level.*
Click on a state in the interactive map below to view a PDF table of uninsured rates by state and sub-state geographies, but also by demographic characteristics (e.g., age, race/ethnicity, and poverty level) for 2021 and comparison year 2019.^
Click here to view uninsurance estimates for the United States.
Click here to view uninsurance estimates for Puerto Rico and its municipios.
Note: These tables present uninsured rates, which indicate the share of the population that is uninsured. For example, a 10 percent uninsured rate for adult women indicates that 10 percent of all adult women are uninsured.
Additional Estimates (50-State Comparisons)
Maps & Tables of Private, Public, & Uninsured Changes from 2019 to 2021
Private Coverage Rates by State, Change from 2019 to 2021, for All People
Public Coverage Rates by State, Change from 2019 to 2021, for All People
Uninsurance Rates by State, Change from 2019 to 2021, for All People
Uninsurance Rates by State, Change from 2019 to 2021, for Children under age 18
About the ACS
The ACS is a household survey that began in 2005 and produces annually updated data on a variety of population characteristics, including health insurance coverage. In total, the ACS surveys approximately three million U.S. households each year. An important feature of the ACS is that it includes a large enough sample for state‐level and sub‐state estimates.
The ACS began asking survey respondents about health insurance coverage during the 2008 calendar year. Specifically, the survey asks respondents about current coverage for each person in the respondent’s household. A person is categorized as “insured” if he or she has coverage at the point in time at which the survey is administered.
*Why Aren’t Estimates Provided for All Counties?
Due to sample size constraints, single-year ACS estimates are available at the county level only for counties with a population greater than 65,000.
^Why Are the Estimates Being Compared to 2019 and not to 2020?
Impacts of the COVID-19 pandemic on survey data collection and dissemination efforts, as well as the presence of measurable nonresponse bias, resulted in ACS estimates from data year 2020 being released on an “experimental only” basis, and the Census Bureau has recommended that these estimates not be used or compared to any other data year.
How Are These Estimates Different from the Estimates that SHADAC Publishes Using Census Bureau Micro-Data Files?
Two definitions used by the Census Bureau to generate the tabulations above differ from those that SHADAC uses to generate tabulations for State Health Compare. The definitional differences are as follows:
Family
The Census Bureau defines a family as “all related people in a household.”
SHADAC defines a family using a measure called the “Health Insurance Unit” (HIU), which includes all individuals who would likely be considered a family unit in determining eligibility for either private or public coverage.
To learn more about the 2020 update of SHADAC's Health Insurance Unit (HIU) see our HIU resource page, which houses two issue briefs: The first describes the SHADAC HIU, its purpose, the most recent update, and improvements to HIU data inputs; and the second outlines the impacts of using the SHADAC HIU in analysis so that researchers can assess whether the SHADAC HIU is suitable for their research and what the potential impacts of its use might be. The page also provides a link to STATA and SAS codes to aid in the use of the HIU variable.
Family Income
The Census Bureau determines family income as a percentage of the Federal Poverty Level (FPL), which is a definition of poverty used primarily for statistical purposes. For example, FPL is used to estimate the number of Americans living in poverty each year.
SHADAC determines family income as a percentage of the U.S. Department of Health and Human Services’ Federal Poverty Guideline (FPG), which is a measure used for administrative purposes. For example, FPG is used to determine eligibility for federal programs such as Medicaid and the Supplemental Nutrition Assistance Program (SNAP).
Check out our blog post from May 2022 to learn more about the difference between FPL and FPG,
Related ACS Materials:
Blog & News

2022 NHIS Early Release: Estimates for First Half of the Year Show Continued Fall of Uninsured Rates
December 15, 2022:As part of the National Health Interview Survey (NHIS) Early Release Program, the National Center for Health Statistics (NCHS) recently published a second round of health insurance coverage estimates for the first half of 2022, covering the months of January to June.
Uninsurance was again measured at historic lows, with just 8.3% of all ages reporting being uninsured compared to 9.6% in the first half of 2021. This significant decrease represents 3.7 million fewer people without insurance through June 2022 (27.4 million as opposed to 31.1 million in 2021).
Other overarching comparisons between January-June estimates in 2022 and 2021 showed:
- The rate of individuals without health insurance coverage was significantly lower among those under 65, particularly for nonelderly adults (age 18-64), who saw a 1.9 percentage-point (PP) drop in their uninsured rate, from 14.0% in 2021 to 12.1% in 2022.
- Rates of public and private coverage remained statistically unchanged for all age groups.
Much like in our analysis of the NHIS Q1 estimates, no measure of statistical significance in either public or private coverage changes was able to account for the large drop in uninsurance rates. Therefore, we can only surmise that the potential shifts in coverage shown by the data—nearly unchanged among public coverage and slight indications of increasing private coverage—may in time point to confirmations of a post-pandemic recovery.
Coverage Changes for All Ages and Nonelderly Adults (18-64)

*Statistically significant at the 95% confidence level.
Important Findings by Demographic Groups
Analyzing coverage rates by more granular population levels revealed few significant changes between January to June of 2022 and the same time in 2021. However, we did note sizeable drops in uninsured rates for nonelderly adults with an income less than 100% of the federal poverty level (down from 19.5% in 2021 to 14.9% in 2022) and nonelderly adults living in states that have not yet expanded Medicaid (decreasing from 17.1% in 2021 to 14.5% in 2022).
While it is heartening to see persistently low overall rates of uninsurance, to anticipate that any perceived gains in private coverage^ have been potentially driven by employer-sponsored insurance and thus by rising post-pandemic employment levels, and improvements in coverage for those experiencing greater levels of poverty, it is also important to understand where there are still opportunities to improve coverage rates. For instance, Hispanic/Latino individuals were more than twice as likely to be uninsured compared with all nonelderly individuals under 65 (20.5% versus 9.9%) for the third year in a row.
Examining uninsured rates for individuals of other races/ethnicities showed that uninsurance decreased to 6.4% from 7.5% between 2022 and 2021 for nonelderly White individuals, but was stable among Black individuals (10.0%), Asian individuals (6.9%), and persons who identified as being of multiple races and other races (8.6%).
Much like overarching national trends, no racial or ethnic groups experienced any significant differences in rates of public coverage; however, White individuals saw gains in private coverage, rising from 72.7% in 2021 to 75.1% in 2022, while Hispanic individuals, Black individuals, Asian individuals, and individuals who reported being of multiple races and other races remained statistically unchanged between the first half of 2021 and 2022, at 44.7%, 49.7%, 72.4%, and 53.2%, respectively.
Impact of COVID-19 on NHIS 2021 Data
While federal survey data collection has recovered greatly from pandemic-related disruptions in 2020, it’s important to note that the presence of COVID-19 did impact collection operations in 2021 to a lesser degree. From January through April 2021, NHIS interviews continued to be attempted by telephone first, with personal visits used only to follow up on nonresponse, deliver recruitment materials, and conduct interviews when telephone numbers were unknown. Starting in May, field representatives were given the discretion to resume personal visits based on their assessment of risks and conditions in the area.
As such, differences between early estimate reports may contain greater variation than in years past; however, all data presented in this report continues to meet NCHS standards of reliability.1
For further details on the impacts of the COVID pandemic on federal surveys in 2020 and 2021, see SHADAC briefs: “Comparing Federal Government Surveys That Count the Uninsured: 2022” and “Changes in Federal Surveys Due to and During COVID-19.”
Notes and Citations
All differences described in this analysis are statistically significant at the 95% confidence level unless otherwise indicated by an “^”.
Estimates are representative of the civilian noninstitutionalized U.S. population, and comparisons presented here are between NHIS data for January-June 2022 and January-June 2021.
1 Cohen, R.A. & Cha, A.E. (December 2022). Health insurance coverage: Early release of estimates from the National Health Interview Survey, January–June 2022. National Center for Health Statistics (NCHS). https://www.cdc.gov/nchs/data/nhis/earlyrelease/insur202212.pdf
Blog & News

SHADAC in AJPH: Insurance-Based Discrimination Reports and Access to Care Among Non-Elderly U.S. Adults, 2011-2019
December 8, 2022:This journal article was originally published in the American Journal of Public Health (AJPH).
Authors: Kathleen Thiede Call, PhD, Giovann Alarcon-Espinoza, PhD, MPP, Natalie Schwer Mac Arthur, PhD, MAc, and Rhonda Jones-Webb, DrPH
 SHADAC researchers and external co-authors recently published an article in the American Journal of Public Health (AJPH) that examines rates of insurance-based discrimination for nonelderly adults with private, public, or no insurance between 2011 and 2019, a period marked by passage and implementation of the Affordable Care Act (ACA) and threats to it.
Using 2011–2019 data from the biennial Minnesota Health Access Survey, the study found that about 4,000 adults aged 18 to 64 report insurance-based discrimination experiences. Using logistic regressions, the authors examined associations between insurance-based discrimination and (1) sociodemographic factors and (2) indicators of access.
Key Findings
- On average, approximately 10% of nonelderly adults reported insurance-based discrimination, although there was a statistically significant increase from 7.7% in 2015 to 11.0% in 2017.
- Reports of insurance-based discrimination remained remarkably stable within each coverage type between 2011 and 2019:
- Uninsured adults ranged between 24.7% to 28.1%
- Adults with public coverage ranged between 18.4% to 24.0%
- Adults with private coverage ranged between 3.0% to 5.4%
- Compared with adults with private insurance (4% on average), insurance-based discrimination was 5 or 6 times higher for adults with public insurance (21% on average) and about 7 times higher for adults with no insurance (27% on average).
- There was little association between insurance-based discrimination and having a usual source of care. However, insurance-based discrimination persistently interfered with confidence in getting needed care and reports of forgone care.
These findings indicate that policy changes from 2011 to 2019 affected access to health insurance, but high rates of insurance-based discrimination among adults with public insurance or no insurance were impervious to such changes. Stable rates of insurance-based discrimination during a time of increased access to health insurance via the ACA suggest deeper structural roots of healthcare inequities.
Read the full American Journal of Public Health article to learn more about the study methods and findings. A copy of this AJPH article is also available upon request.
Blog & News
California Health Insurance Stable in 2021, but Many Will Need to Switch Coverage Once COVID-19 Pandemic Protections End (CHCF Cross Post)
November 4, 2022:The following content is cross-posted from California Health Care Foundation published on November 4, 2022.
Authors: Colin Planalp and Lacey Hartman, SHADAC
Employer-sponsored insurance declined significantly; Medi-Cal and individual market coverage held steady
During 2021, the second calendar year of the COVID-19 pandemic, California’s health insurance landscape remained relatively stable. This article focuses exclusively on Californians under age 65, which is the threshold for age-based Medicare coverage, and the coverage rates highlighted below include children except where otherwise specified (i.e., “nonelderly adults”). Based on the 2021 California Health Interview Survey (CHIS), the percentage of Californians under age 65 without health insurance, 7.4% in 2021, was not significantly different from the prior year. There also were no statistically significant changes across demographic groups, including income, age, geography, and race and ethnicity.
Also, the rate of Californians with individual market coverage, 5.9% in 2021, was statistically unchanged from 2020. While the rate of Californians with Medi-Cal coverage (California’s Medicaid program), 26.4% in 2021, appears higher than the 24.8% of 2020, the difference is not statistically significant. That finding contrasts with records from the California Department of Health Care Services, which reported that Medi-Cal enrollment increased by 7.3% (893,552 enrollees) in 2021 for people under age 65, growing from 12,244,085 in December 2020 to 13,137,637 in December 2021.1
There are multiple potential explanations why survey data on Medi-Cal enrollment may differ from Medi-Cal’s records. Research shows that surveys tend to undercount people enrolled in state Medicaid programs, in part due to people’s confusion over program names and whether they are still enrolled in Medicaid. This second issue, of people being unaware they are still enrolled, may have been exacerbated during the pandemic. A temporary policy, termed “continuous coverage,” prevented enrollees from being disenrolled from Medicaid during the public health emergency, as health coverage has been vital to preserving access to health care. This policy may have resulted in some Californians retaining Medi-Cal coverage they assumed had expired.
Health Insurance in California by Coverage Type, 2013–21

At the same time, the rate of Californians with employer-sponsored insurance (ESI) declined significantly, from 60.1% in 2020 to 57.8% in 2021. The losses in ESI appear to have been offset by increases in Medi-Cal coverage for some key groups. For instance, while ESI rates declined significantly for nonelderly adults (age 18–64), people with moderate incomes (139%–400% of federal poverty level) and Latinx people experienced statistically significant increases in Medi-Cal coverage rates. 2
Although the percentage of Californians without health insurance at a given time was unchanged in 2021, the rate of Californians experiencing long-term uninsurance (for a year or more) rose from 4.8% in 2020 to 5.7% in 2021, a statistically significant increase.

Conclusions and Discussion
Overall, the stability of the state’s health insurance rate can be seen as positive, particularly during the upheaval of the COVID-19 pandemic. Despite massive job losses in 2020, California’s uninsurance rate declined to a historic low in the first year of the pandemic, almost certainly due to federal and state efforts to maintain or improve access to health insurance. The ability for California to hold that low rate of uninsurance into a second volatile year of the pandemic is notable.
There were other measures, however, that indicate California’s coverage landscape shifted slightly since 2020. For instance, the state’s rate of ESI coverage declined significantly in 2021, which would be concerning if it developed into a trend. However, it is important to recognize that in 2020 the portion of Californians with ESI was a high-water mark since full implementation of the Affordable Care Act in 2014, so it could be that the trend of increased ESI in recent years is only moderating.
Another potentially concerning indicator was the increase in California’s rate of long-term uninsurance from 2020 to 2021. But in this case, trend data show that the 2020 long-term uninsurance rate of 4.8% may simply have been an outlier — possibly to due to the pandemic — with the 2021 rate of 5.7% falling back in line with the narrow range of rates between 5.3% and 5.8% for other years since 2016.
Altogether, data from the 2021 CHIS illustrate a surprisingly stable landscape of health insurance coverage. The COVID-19 pandemic — which began in 2020 and continued into 2021 and beyond — had the potential to cause massive losses of health insurance coverage, primarily through declining ESI caused by sharp job losses. But uninsurance rates did not spike, and ESI coverage has not shown dramatic erosion compared to the prepandemic trend.
Even as the pandemic persisted into 2022, many of the government supports that helped people maintain coverage during the crisis have already ended or are expected to sunset soon. For example, the growth of Medi-Cal coverage for key subpopulations during the pandemic is due in large part to the continuous coverage provision associated with the public health emergency, expected to end sometime in 2023. While researchers project that most Californians losing Medi-Cal will be eligible for other types of coverage, as CHCF has written elsewhere, it will be critical to take action to keep enrolled those who continue to be eligible for Medi-Cal, and to connect those who become ineligible to alternative sources of coverage. This — as well as other challenges, such as inflation — may make holding onto California’s coverage gains difficult. To fully understand whether and what kinds of impacts the pandemic triggered in California’s health coverage landscape, it will be vital to continue monitoring data from 2022 and future years.
Notes
1 Wilson Analytics analysis of “Month of Eligibility, Race/Ethnicity, and Age group, by County, Medi-Cal Certified Eligibility” (Jan. 2010–March 2022), California Health and Human Services Open Data portal.
2 Groups typically eligible for Medi-Cal above 138% FPL include children, pregnant women, and some disabled people. However, due to the continuous coverage provision under the federal COVID-19 public health emergency, some whose incomes rose above the 138% threshold may have temporarily retained Medi-Cal coverage, even though they would have lost eligibility under normal circumstances.