VISIT STATE HEALTH COMPARE
Blog & News


2022 ACS Tables: State and County Uninsured Rates, with Comparison Year 2021
November 17, 2023:Each year, SHADAC uses data released from the American Community Survey (ACS) via the U.S. Census Bureau's data.census.gov tool to produce estimates of uninsurance at the state and county level.*
Click on a state below in the interactive map to see a PDF table of uninsured rates by state and sub-state geographies, but also by demographic characteristics (e.g., age, race/ethnicity, and poverty level) for 2022 and comparison year 2021.
Click here to view uninsurance estimates for the United States.
Click here to view uninsurance estimates for Puerto Rico and its municipios.
Note: These tables present uninsured rates, which indicate the share of the population that is uninsured. For example, a 10 percent uninsured rate for adult women indicates that 10 percent of all adult women are uninsured.
Maps & Tables of Private, Public, & Uninsured Changes from 2021 to 2022
- Private Coverage Rates by State, Change from 2021 to 2022, for All People
- Public Coverage Rates by State, Change from 2021 to 2022, for All People
- Uninsurance Rates by State, Change from 2021 to 2022, for All People
About the ACS
The ACS is a household survey that began in 2005 and produces annually updated data on a variety of population characteristics, including health insurance coverage. In total, the ACS surveys approximately three million U.S. households each year. An important feature of the ACS is that it includes a large enough sample for state‐level and sub‐state estimates.
The ACS began asking survey respondents about health insurance coverage during the 2008 calendar year. Specifically, the survey asks respondents about current coverage for each person in the respondent’s household. A person is categorized as “insured” if he or she has coverage at the point in time at which the survey is administered.
*Why Aren’t Estimates Provided for All Counties?
Due to sample size constraints, single-year ACS estimates are available at the county level only for counties with a population greater than 65,000.
How Are These Estimates Different from the Estimates that SHADAC Publishes Using Census Bureau Micro-Data Files?
Two definitions used by the Census Bureau to generate the tabulations above differ from those that SHADAC uses to generate tabulations for State Health Compare. The definitional differences are as follows:
Family
The Census Bureau defines a family as “all related people in a household.”
SHADAC defines a family using a measure called the “Health Insurance Unit” (HIU), which includes all individuals who would likely be considered a family unit in determining eligibility for either private or public coverage.
To learn more about the 2020 update of SHADAC's Health Insurance Unit (HIU) see our HIU resource page, which houses two issue briefs: The first describes the SHADAC HIU, its purpose, the most recent update, and improvements to HIU data inputs; and the second outlines the impacts of using the SHADAC HIU in analysis so that researchers can assess whether the SHADAC HIU is suitable for their research and what the potential impacts of its use might be. The page also provides a link to STATA and SAS codes to aid in the use of the HIU variable.
Family Income
The Census Bureau determines family income as a percentage of the Federal Poverty Level (FPL), which is a definition of poverty used primarily for statistical purposes. For example, FPL is used to estimate the number of Americans living in poverty each year.
SHADAC determines family income as a percentage of the U.S. Department of Health and Human Services’ Federal Poverty Guidelines (FPG), which is a measure used for administrative purposes. For example, FPG is used to determine eligibility for federal programs such as Medicaid and the Supplemental Nutrition Assistance Program (SNAP).
To learn more about the difference between FPL and FPG, read our updated blog post from April 2023.
Related ACS Materials:
- An Annual Conversation with the U.S. Census Bureau: 2022 Health Insurance Coverage Estimates from the ACS and CPS
- 2022 ACS: Declining Uninsured Rates for the U.S. and States are Supported by Private and Public Coverage Increases
- CPS ASEC: 2022 National Health Insurance Coverage Estimates Show Falling Rates of Uninsurance and Direct-Purchase Coverage (Infographic)
Publication
An Annual Conversation with the U.S. Census Bureau: 2022 Health Insurance Coverage Estimates from the ACS and CPS
On Thursday, September 28th at 1:00 PM CST, SHADAC hosted a webinar covering the release of new 2022 health insurance coverage estimates from two key, large-scale federal data sources: The American Community Survey (ACS) and the Current Population Survey (CPS).
Estimates from both surveys were presented at: the national and state levels, as well as by coverage type, and a range of other demographic categories (age, geography, poverty level, and more), during the webinar. Technical and analytic insight was provided from experts at the U.S. Census Bureau, which administers both the ACS and CPS, and SHADAC researchers joined with our special guests from the Census Bureau to answer questions from attendees after the presentation.
Attendees were able to learn about:
- New 2022 health insurance coverage estimates
- When to use which estimates from the ACS vs the CPS
- How to access the estimates via Census reports and the data.census.gov website
- How to access state-level estimates from the ACS using SHADAC tables and State Health Compare web tool
Speakers
 Kathleen T. Call, Moderator Kathleen T. Call, Moderator
Principal Investigator
SHADAC Dr. Call has been an Investigator with SHADAC since its launch in 2001. She is also a Professor in the Division of Health Policy and Management at the University of Minnesota (UMN), School of Public Health (SPH). She demonstrates her commitment to community-engaged scholarship through her leadership in the Clinical and Translational Science Institute, and the Interdisciplinary Research Leaders (IRL) program, and by co-chairing the UMN, SPH Health Equity Work Group.
|
 Katherine Keisler-Starkey, Speaker Katherine Keisler-Starkey, SpeakerEconomist in Health and Disability Statistics Branch United States Census Bureau Katherine Keisler-Starkey is an economist in the Health and Disability Statistics Branch in the U.S. Census Bureau’s Social, Economic and Housing Statistics Division. In her position, Ms. Starkey provides subject matter expertise on health topics for the Current Population Survey Annual Social and Economic Supplement (CPS ASEC) and has authored the Census Bureau’s Health Insurance Coverage in the United States report for the last four years. Her research interests focus on Applied Microeconomics, including Health Economics, Public Finance, and Labor Economics, and she is the author of several topically focused Census working papers and blogs in these areas. |
 Robert Hest, Speaker Robert Hest, SpeakerSenior Research Fellow
SHADAC Robert Hest joined SHADAC in 2017 and was recently made Senior Research Fellow. Mr. Hest provides expertise in survey data, data analysis and processing, and project management. Mr. Hest also manages SHADAC’s State Health Compare website, coordinating data processing, quality assurance, dissemination, and documentation of data.
|
 Sharon Stern, Speaker Sharon Stern, SpeakerAssistant Division Chief
United States Census Bureau Sharon Stern is the Assistant Division Chief for employment characteristics in the U.S. Census Bureau’s Social, Economic and Housing Statistics Division. In her position, Ms. Stern oversees statistics on the labor force, health insurance and disability from several Census Bureau surveys. She has authored a wide variety of Census Bureau reports and papers on topics related to poverty, disability, and health insurance.
|
Related Resources
SHADAC
- Webinar slides from SHADAC
- CPS ASEC: 2022 National Health Insurance Coverage Estimates Show Falling Rates of Uninsurance and Direct-Purchase Coverage (Infographic) (Blog)
- 2022 ACS: Declining Uninsured Rates for the U.S. and States are Supported by Private and Public Coverage Increases (Blog)
U.S. Census Bureau
- Webinar slides from Census Bureau
- Health Insurance Coverage in the United States: 2022 (Report)
- Health Insurance Coverage of U.S. Workers Increased in 2022: Health Insurance Rates for Working-Age Adults Higher by Race, Hispanic Origin, Region (Blog)
- Uninsured Rates Decreased in Over Half of U.S. States in 2022: Changes in Types of Health Insurance Coverage Contributed to Declines in Uninsured Rates From 2021 to 2022 (Blog)
Blog & News
Hest, Robert
Theis, Lindsey
Stewart, Andrea
2022 ACS: Declining Uninsured Rates for the U.S. and States are Supported by Private and Public Coverage Increases
Setember 14, 2023:
Related Releases and Materials
|

The U.S. Census Bureau released 2022 health insurance coverage estimates from the American Community Survey (ACS) today, which included state-level information about health insurance coverage by type as well by certain demographic categories. The Census Bureau also released an accompanying report and blog post highlighting many of the changes seen from 2021 to 2022.
Overall, the data showed a drop in uninsured rates, with an 8.0% rate of uninsurance in 2022 as compared to 8.6% in 2021. This echoes similar year-over-year decreases in uninsurance shown in data from the Current Population Survey (CPS), for which estimates were released on Tuesday, and in recent survey data from the National Health Interview Survey (NHIS). Eight percent represents the lowest-ever national rate of uninsurance measured in the ACS.
The national decline in uninsurance was supported by decreases in 27 states, with Maine the only state to see an increase in its uninsured rate, from 5.7% in 2021 to 6.6% in 2022, reversing the previous trend from 2019 to 2021.* Overall, uninsured rates ranged across states from a low of 2.4% in Massachusetts to a high of 16.6% in Texas, a continuing trend from past years. The largest drop in uninsured rates was found in Oklahoma, which fell by 2.1 percentage points (PP) to 11.7% in 2022 from 13.8% in 2021.
The drop in uninsured rates coincided with small yet significant increases in 2022 for both private coverage — 67.2% from 67.0% in 2021 — and public coverage — 37.2% from 36.8%. Alaska saw the largest increase in private coverage, rising 2.2 PP to 66.4%. Nine states saw increases in private coverage, while nine states saw decreases in private coverage. And unsurprisingly, Oklahoma saw the largest increase in public coverage, rising 2.3 PP to 39.6%: Oklahoma was one of two states, along with Missouri to have expanded Medicaid in 2022.
The rest of this blog post highlights some of the national and state-level changes that took place between 2021 and 2022 in the broadest categories of insurance (uninsurance, public coverage, and private coverage) for two key age groups, nonelderly adults (age 19-64) and children (age 0-18). Accompanying interactive maps allow readers to view and sort the different coverage types for each age group.
Key Findings from the 2022 ACS: Nonelderly Adults (19-64)
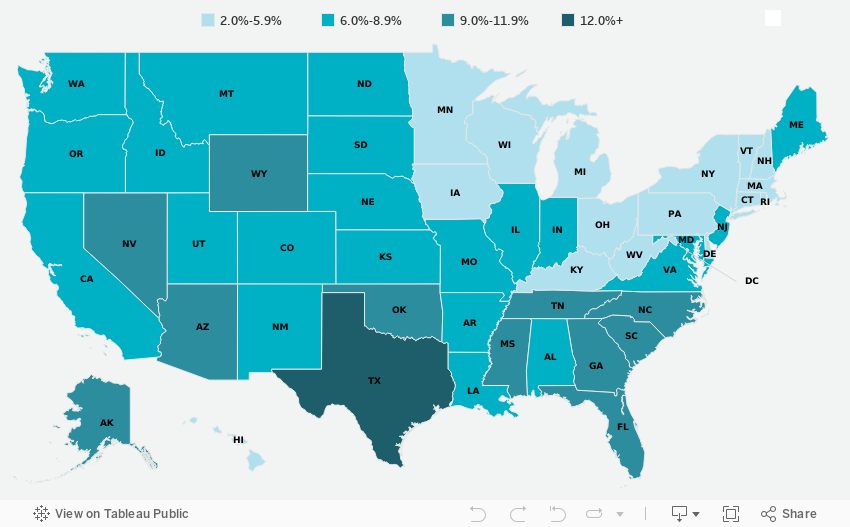
Figure 1. Changes in state-level coverage rates among nonelderly adults, 2021-2022
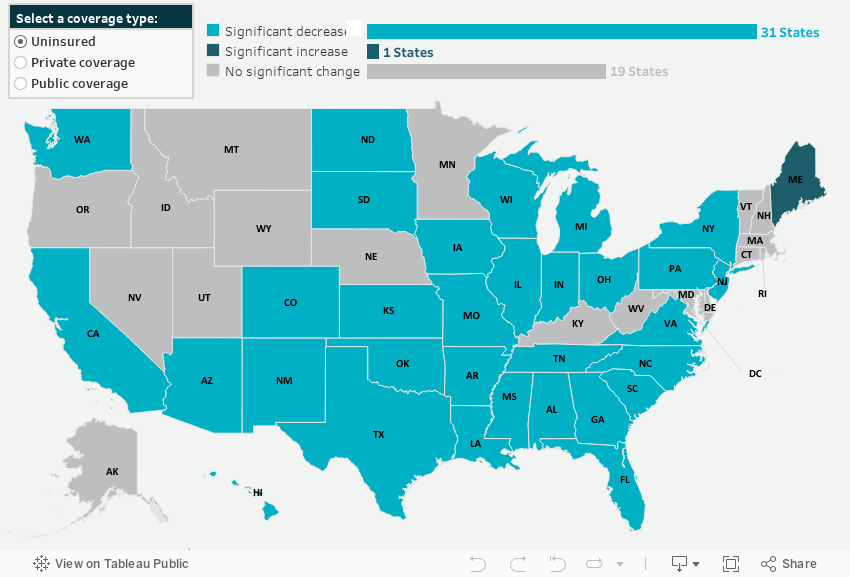
State-Level Uninsurance
Nonelderly adults also saw falling uninsurance rates, dropping by 0.9 PP from 12.2% in 2021 to 11.3% in 2022. Additionally, 31 states saw decreases in their uninsured rates for nonelderly adults while only Maine saw an increase, rising 1.4 PP to 9.6%. The largest decline in uninsurance was seen in Oklahoma, whose rate of uninsured nonelderly adults dropped a notable 3.4 PP to 16.8% in 2022.
State-Level Private Coverage
Private coverage increased significantly for nonelderly adults, rising 0.7 PP to 73.4% in 2022 from 72.7% in 2021. This increase was echoed across 21 states, with Mississippi seeing the largest increase at 2.2 PP, rising to 69.7% in 2022. Private coverage levels fell across just three states — Maine, Minnesota, and Virginia — with Maine seeing the most significant drop, falling 1.8 PP to 74.1% in 2022.
State-Level Public Coverage
Overall, nonelderly adults also experienced a significant increase in public coverage from 2021 to 2022. Rates of public coverage rose to 19.4% from 19.1% in 2021, driven by similar increases across 14 states. Individually, Oklahoma once again saw the largest increase — 19.9%, up from 16.3% in 2021. Of the eight states that saw decreases in 2022, public coverage for nonelderly adults declined the most in Rhode Island, dropping 2.1 PP to 21.7
Key Findings from the 2022 ACS: Children (0-18)
Figure 2. Changes in state-level coverage rates among children, 2021-2022
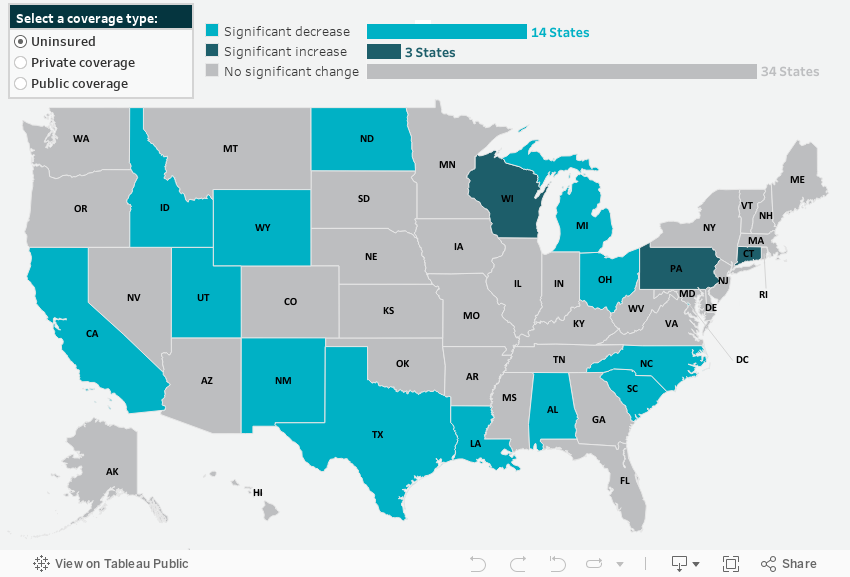
State-Level Uninsurance
For children, uninsured rates fell to 5.1% in 2022 from 5.4% in 2021. Fourteen states also saw drops in children’s uninsurance, Wyoming being the largest - falling 3.5 PP to 7.9%, followed by New Mexico, which saw a 2.6 PP decrease from 6.4% in 2021 to 3.8% in 2022. Three states (Connecticut, Pennsylvania, and Wisconsin) saw increased children’s uninsured rates for 2022.
State-Level Private Coverage
Unlike nonelderly adults, children did not experience an overall increase in private coverage for 2022. Private coverage remained statistically unchanged for children nationally at 60.6%. However, 13 states did see rising private coverage rates, with Rhode Island leading the way, jumping 4.8 PP to 69.4% in 2022. Six states saw declines in private coverage, led by a drop of 2.3 PP in Missouri, whose rate of private coverage for children in 2022 was 63.2%.
State-Level Public Coverage
Like private coverage rates, public coverage remained statistically unchanged for children from 2021 to 2022, sitting at 39.6%. Just eight states saw increased public coverage for kids in 2022, led by a 2.6 PP jump in North Dakota, from 21.3% in 2021 to 23.9% in 2022. And seven states saw declining public coverage rates, with children in Rhode Island experiencing a precipitous fall of 5.9 PP to 34.4% in 2022.
Future Data Releases and Products
Supplemental tables for the 2022 ACS 1-Year Estimates will be released from the U.S. Census Bureau on October 19, 2023, and 2018-2022 ACS 5-Year Estimates will be available on December 7, 2023.
Stay tuned for more granular details about insurance coverage changes in the states from 2021 to 2022 via customized SHADAC tables examining coverage at the state and county level, and for an announcement of updated health insurance coverage measures available on State Health Compare.
Notes
All changes described in this document are significant at the 90% level. Private coverage includes individually purchased, employer-sponsored coverage, and TRICARE military health coverage Public coverage includes Medicare, Medicaid/CHIP, and VA health care. Public and private coverage types are not exclusive and include individuals with those types of coverage alone or in combination with other coverage. Estimates represent the civilian noninstitutionalized population.
Overarching estimates of uninsurance and public and private coverage are for all ages, except where noted for children (age 0-18) and nonelderly adults (19-64).
COVID-19 Public Health Emergency Impacts
Continuous Coverage Requirement
The continuous coverage requirement that prevented states from terminating individuals’ Medicaid coverage during the pandemic ended on March 31, 2023. The resumption of Medicaid eligibility redeterminations and renewals (and potential disenrollments), a process commonly referred to as the “unwinding,” began on April 1, 2023, and each state has a year to navigate a return to normal operations while also meeting reporting requirements set by CMS for publicly sharing coverage transitions and outcomes data during this time. While the health insurance estimates released by the US Census Bureau for 2022 precede the beginning of the unwinding process, the data provide an essential baseline for understanding how health insurance coverage is distributed across the U.S. and among the states prior to the unwinding, as well as marker to measure the impacts of this seismic coverage transition as potentially millions of individuals, both adults and children, are poised to lose Medicaid and must either find another form of coverage (e.g., state-based marketplace or employer-sponsored insurance [ESI]), or risk becoming uninsured.
Several resources have been compiled by SHADAC to track the unwinding process in a variety of avenues, falling under several broader categories:
Guidance for States
- Using Surveys to Monitor Coverage Transitions During the Unwinding of the Medicaid Continuous Coverage Requirement
- Best Practices for Publicly Reporting State Unwinding Data
Health Insurance Coverage Data Tracking
- State-Based Marketplace Transition Data During the Unwinding
- State Dashboards to Monitor the Unwinding of the Medicaid Continuous Coverage Requirement
- Tracking Health Insurance Coverage During the Unwinding: Monthly Data from the Household Pulse Survey
*Data Collection and Dissemination
As has been extensively documented by both SHADAC and the Census Bureau, disruptions to data collection and dissemination efforts—as well as the presence of significant nonresponse bias—due to the COVID-19 pandemic heavily impacted estimates for 2020. As such, the Census Bureau released 2020 ACS 1-year data in an “experimental-only” format and cautioned against their use. Similarly, the Census Bureau recommends that data users do not compare 2020 ACS 1-year experimental estimates with any other data. Researchers therefore have compared 2019 to 2021 data.
Blog & News
Hest, Robert
Theis, Lindsey
Stewart, Andrea
CPS ASEC: 2022 National Health Insurance Coverage Estimates Show Falling Rates of Uninsurance and Direct-Purchase Coverage (Infographic)
September 12, 2023:
Related Releases and Materials
|

The U.S. Census Bureau has released an initial report detailing the state of health insurance coverage in the United States for 2022.
Drawing on data from the Current Population Survey Annual Social and Economic Supplement (CPS ASEC), the report highlights good news overall as the percentage of the population without health insurance coverage at any point in 2022 fell to 7.9% from 8.3% in 2021—a decrease of 0.4 percentage points or approximately 1.3 million people (25.9 million in 2022 vs. 27.2 million in 2021).
The following blog post explores changes in national-level coverage rates by demographic characteristics - such as age, employment, race and ethnicity, immigration status, poverty status, and Medicaid expansion status - for nonelderly adults (age 19-64) and for children (age 0-18). While neither group saw an overall significant change in uninsured rates, both experienced shifts across demographic subgroups.
Additionally of note, though not within the scope of this blog to explore further, elderly adults (age 65+) saw a significant increase in Medicare rates, which the Census Bureau notes is due to a larger elderly population overall, not a larger share of those adults having Medicare. The continued growth of an aging population will continue to have ramifications for a number of health-related measures, including health insurance coverage rates, and bears following in future research.
Changes in Uninsurance by Age (Nonelderly Adults age 19-64, and Children age 0-18) and Characteristics
 Among nonelderly adults, the overall rate of uninsurance fell to 10.8% in 2022, a 0.8 percentage point (PP) decrease from 2021.
Comparatively, the uninsured rate among children remained statistically unchanged from 2021 (5.0%) at 5.4% in 2022.
Race and ethnicity
In 2022, rates of uninsurance fell among nonelderly Black, Hispanic, and White adults, declining to 11.4%, 23.4%, and 6.8% (versus 12.7%, 25.1%, and 7.5%), respectively. Rates of uninsurance among nonelderly Asian adults were unchanged at 7.4%.
Similarly, while uninsurance rates remained stable for children of several racial and ethnic groups in 2022 - 4.1% for Asian children, 4.7% for Black children, and 8.6% for Hispanic children - the rate of uninsurance rose significantly among White children, increasing to 4.1% in 2022 from 3.4% in 2021.
Immigration status
The rate of uninsurance among native-born nonelderly adults fell to 8.2% in 2022 from 9.1% in 2021, while the uninsurance rate among foreign-born adults remained statistically unchanged at 22.1% in 2022 compared to 22.8% in 2021.
Rates of uninsurance were unchanged among native-born children at 4.7% in 2022 and among foreign-born children at 20.6% in 2022.
Poverty level
When examining coverage by poverty level, rates of uninsurance were unchanged at 24.2% among nonelderly adults with incomes below 100% poverty, decreased to 15.2% from 16.8% for those between 100%-399% poverty, and decreased to 3.9% from 4.5% for those living at or above 400% poverty.
In 2022, rates of uninsurance were unchanged for children in the two lower poverty level categories—8.9% for those in families with incomes below 100% poverty and 6.1% for those living in families with incomes between 100%-399% poverty. However, uninsured rates rose to 2.6% among children in families with incomes at or above 400% of poverty, an increase of 0.9 PP from 2021.
Medicaid expansion status
As of January 1, 2022, 38 states and the District of Columbia have chosen to act on the option provided by the Affordable Care Act (ACA) and expand Medicaid eligibility requirements, with the additions of Missouri and Oklahoma last year. Comparing rates of uninsurance by expansion and nonexpansion states revealed divergent trends for nonelderly adults and children.
In 2022, the uninsured rate fell to 8.4% in 2022 from 9.2% in 2021 for nonelderly adults living in expansion states and fell to 16.2% in 2022 from 17.0% in 2021 for those in nonexpansion states.
However, children in expansion and nonexpansion states saw no significant change in uninsured rates for 2022 compared to 2021 at 4.1% and 8.1%, respectively.
Notable Public and Private Coverage Changes
Among nonelderly adults, rates of public coverage and private coverage were unchanged at 19.1% and 72.9%, respectively. Rates of employer-based coverage increased to 63.5% in 2022 among nonelderly adults, up 0.6 PP from 2021. Rates of Medicare coverage fell to 3.6% among nonelderly adults in 2022, down from 3.8% in 2021.
By Race and Ethnicity (Total Population)
Rates of private and public coverage were statistically unchanged among Asian (72.2% and 27.8%, respectively) and Hispanic individuals (49.4% and 37.7%, respectively).
Among Black persons, the percentage with private coverage rose to 56.6% in 2022, up from 55.1% in 2021, and the percentage with public coverage fell to 41.2% in 2022, down from 42.7% in 2021.
Among White individuals, the percentage with private coverage fell to 72.3% in 2022, down from 73.2% in 2021, and the percentage with public coverage rose to 35.4% in 2022, up from 34.6% in 2021.
Immigration Status (Total Population)
Rates of private and public coverage were unchanged among the native-born population at 67.6% and 36.7%, respectively. Among the foreign-born population, the percent with private coverage was unchanged at 54.4% while the percentage with public coverage rose to 32.8% in 2022 from 31.7% in 2021.
Medicaid Expansion Status (Total Population)
In expansion states, the share with private coverage fell to 66.6% in 2022 from 67.1% in 2021 while the share with public coverage rose to 37.6% in 2022 from 36.9% in 2021. In nonexpansion states, the share of the population with private coverage and public coverage were unchanged at 63.6% and 32.9%, respectively.
Employment Status (Nonelderly Adults)
Public coverage rose among working nonelderly adults in 2022 to 12.6% from 11.8% in 2021 while the share with private coverage was stable at 80.0%. Public coverage rose among those who worked full-time year round and those who worked less than full-time, year round, rising to 8.9% and 23.5%, respectively. Private coverage was unchanged among these groups at 84.8% and 66.0%, respectively. Private and public coverage were unchanged among those who did not work, at 47.5% and 42.6%, respectively.
More on the insurance coverage changes among working-age adults can be found in a topically focused blog released today by the Census Bureau.
Notes
All changes are tested at the 90% confidence level.
All estimates come from the 2022 and 2023 Current Population Survey Annual Social and Economic Supplements, which provide data for years 2021 and 2022, respectively.
Uninsured estimates represent individuals with no health insurance coverage for the entire calendar year.
Estimates of health insurance coverage type represent individuals with that type of coverage at any point during the calendar year. Types of health insurance coverage are not mutually exclusive.
COVID-19 Public Health Emergency Impacts
Continuous Coverage Requirement
The continuous coverage requirement that prevented states from terminating individuals’ Medicaid coverage during the pandemic ended on March 31, 2023. The resumption of Medicaid eligibility redeterminations and renewals (and potential disenrollments), a process commonly referred to as the “unwinding,” began on April 1, 2023, and each state has a year to navigate a return to normal operations while also meeting reporting requirements set by CMS for publicly sharing coverage transitions and outcomes data during this time. While the health insurance estimates released by the US Census Bureau for 2022 precede the beginning of the unwinding process, the data will provide an essential baseline for understanding how health insurance coverage is distributed across the U.S. and among the states prior to the unwinding, as well as marker to measure the impacts of this seismic coverage transition as potentially millions of individuals, both adults and children, are poised to lose Medicaid and must either find another form of coverage (e.g., state-based marketplace or employer-sponsored insurance [ESI]), or risk becoming uninsured.
Several resources have been compiled by SHADAC to track the unwinding process in a variety of avenues, falling under several broader categories:
Guidance for States
- Using Surveys to Monitor Coverage Transitions During the Unwinding of the Medicaid Continuous Coverage Requirement
- Best Practices for Publicly Reporting State Unwinding Data
Health Insurance Coverage Data Tracking
- State-Based Marketplace Transition Data During the Unwinding
- State Dashboards to Monitor the Unwinding of the Medicaid Continuous Coverage Requirement
- Tracking Health Insurance Coverage During the Unwinding: Monthly Data from the Household Pulse Survey
Data Collection and Dissemination - Nonresponse Bias
While Census Bureau researchers have not cited any concerns with CPS ASEC data collection or release processes, an ongoing issue of persistently lower response rates and resultant nonresponse bias has been documented for the past few years, coinciding with the beginning of the COVID-19 pandemic. In March 2023 (the point in time that the CPS is administered), the response rate fell to its lowest point yet, at 68.9%, compared to a pre-pandemic rate of 82% (March 2019). This lower response rate particularly affects the CPS measures of income, and since 2020, the Census Bureau has been working to address the bias in higher reported earnings using new weighting methods to create adjusted income and poverty estimates. More detail on this methodology can be found in a companion blog released today by Census Bureau researchers.
Blog & News
Hest, Robert
Theis, Lindsey
Exploring Cost and Coverage Rates in Employer-Sponsored Insurance (Infographic)
September 5, 2023:Throughout the United States, a majority of Americans and their families receive health insurance coverage through their employer. In 2021, the number of people covered by this type of coverage—known as employer-sponsored insurance or ESI—exceeded 169 million. While a fuller picture of the coverage landscape will be available later this fall as agencies such the U.S. Census Bureau release more health insurance data, in this blog and infographic, SHADAC researchers use recently released data from the Medical Expenditure Panel Survey-Insurance Component (MEPS-IC) to analyze private-sector ESI and provide an initial snapshot of estimates for 2022 on a national level and within the states.
Key Findings (2022 vs. 2021)
 Employee Access to Coverage
- The offer of employer-sponsored insurance coverage was extended to a large majority of private-sector workers. In 2022, 85.6% of employees in the U.S. worked in establishments that offered health insurance coverage, a rate that was statistically unchanged from 2021 (85.7%).
Employee Coverage Costs
Premiums
- The average annual premium for single coverage significantly increased to $7,590 in 2022, a $210 or 2.8% increase from 2021.
- Among the states, average annual single premiums ranged from $6,713 in Oklahoma to $8,936 in New York.
- For those enrolled in family coverage, average annual premiums also significantly increased. In this case, premiums increased to $21,931 in 2022, a $550 or 2.6% increase from 2021.
- Among the states, average annual family premiums ranged from $19,003 in Oklahoma to $25,892 in Alaska.
Deductibles
- For single coverage, the 2022 average individual deductible was $1,992, unchanged from 2021 ($2,004).
- Among the states, average individual deductibles ranged from $1,343 in D.C. to $2,771 in Maine.
- Among those enrolled in family coverage, the average deductible per employee enrolled was $3,811 in 2022. This was also unchanged from 2021 ($3,868).
- Among the states, average family deductibles ranged from $3,009 in D.C. to $4,858 in South Dakota.
High-Deductible Health Plans*
- In 2022, the share of employees enrolled in high-deductible health plans (HDHPs) decreased significantly in 2022 to 53.6% – a decrease of 2.1 percentage points from 2021.
- Among the states, the percent of private-sector employees enrolled in high-deductible health plans ranged from 21.8% in Hawaii to to 72.2% in South Dakota.
Key Takeaways
With so many Americans relying on an employer for health insurance coverage, measures of ESI coverage and cost remain important indicators of the financial and health burdens many individuals and families face. These measures will be of greater importance going forward as some current Medicaid enrollees may transition to employer coverage during the 2023-2024 unwinding of the Medicaid continuous coverage requirement. SHADAC is monitoring the unwinding process through a variety of avenues, including: federal surveys, state dashboards, and state-based marketplace data.
In 2022, as in previous years, premiums continued to rise, though premium increases were small compared to the relatively high rate of inflation in 2022. Average deductibles were unchanged from 2021, which represents a break from the long-running trend of increasing deductibles. Additionally, the share of private sector employees enrolled in high-deductible plans decreased by a small but statistically significant margin, which represented the first decrease since 2013. With regard to coverage, a large majority of workers were employed in establishments that offered health insurance coverage, and this was unchanged from 2021.
Notes and Sources
* High-deductible health plans (HDHP) are defined as plans that meet the minimum deductible amount required for Health Savings Account (HSA) eligibility ($1,400 for an individual and $2,800 for a family in 2022).
Data are from the 2022 Medical Expenditure Panel Survey–Insurance Component (MEPS-IC), produced by the Agency for Healthcare Research and Quality (AHRQ).
Health insurance coverage estimates through 2021 are available on SHADAC’s State Health Compare web tool at statehealthcompare.shadac.org, and estimates for 2022 will be added soon.