VISIT STATE HEALTH COMPARE
Blog & News
Hest, Robert
Liu, Grace
Theis, Lindsey


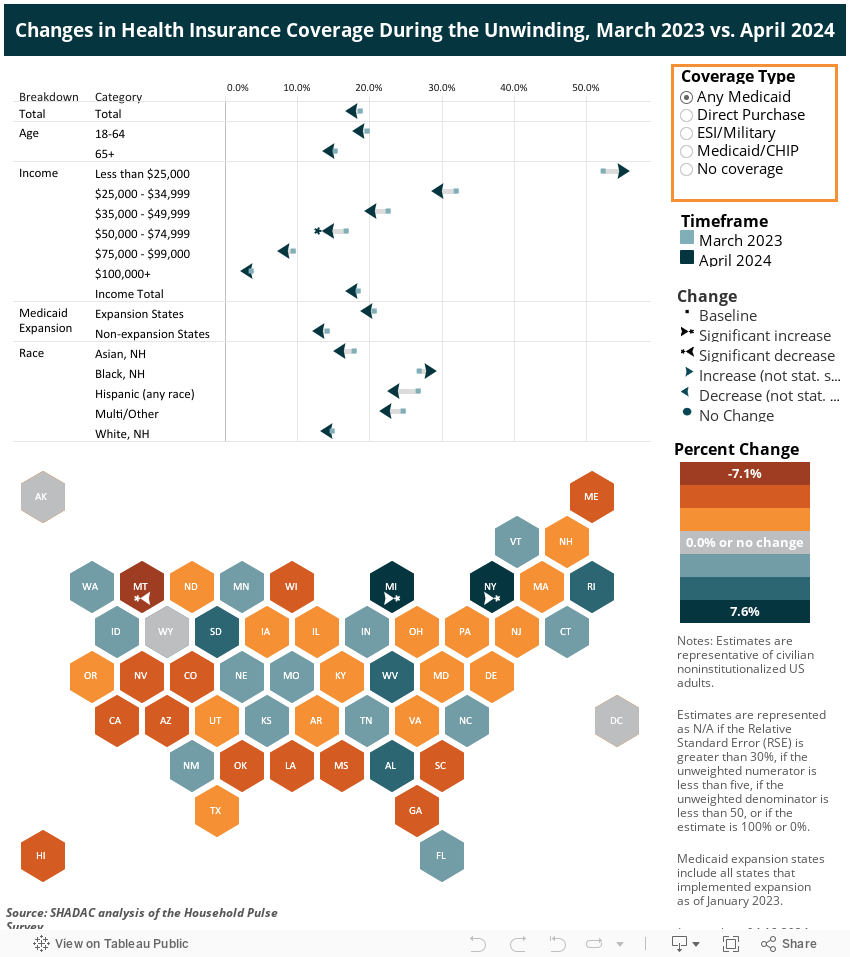
Tracking Health Insurance Coverage During the Unwinding: Monthly Data from the Household Pulse Survey
Originally posted on July 24, 2023 - Last updated on October 4, 2024:This update was posted on October 4, 2024 and uses data from the October 2024 release of the Household Pulse Survey, collected August 20 - September 16, 2024.
Important Note: This will be the final data release from the Household Pulse Survey, and the final update of this SHADAC product. Moving forward, the U.S. Census Bureau will be launching a similar study with a longitudinal design called the Household Trends and Outlook Pulse Survey (HTOPS) in January 2025. You can read more about this study here.
Introduction
The unwinding of the Medicaid continuous coverage requirement represents the largest nationwide coverage transition since the Affordable Care Act. Since February 2020, enrollment in Medicaid and the Children’s Health Insurance Program (CHIP) has increased by 23 million enrollees and analysis indicates that as many as 15 million individuals will exit Medicaid to other coverage or become uninsured. This blog uses data from the U.S. Census Bureau’s Household Pulse Survey (HPS) to track trends in adult health insurance coverage rates as states “unwind” the Medicaid continuous coverage requirement and restart standard redetermination procedures.
Given the intense interest from policymakers and the media in monitoring coverage transitions during the unwinding, many states have released Medicaid administrative data showing their progress, with some State-based Marketplaces also reporting transition data. Though administrative data can show the number of successful Medicaid renewals and coverage terminations along with transitions to Marketplace coverage, they cannot provide information on transitions to other sources of coverage, such as employer-sponsored insurance or provide an estimate of changing rates of uninsured individuals.
As states continue the process of redetermining beneficiaries’ Medicaid eligibility, this resource will help track transitions in coverage. Specifically, it will present rates of primary source of health insurance coverage by type (Employer/Military, Direct Purchase, Medicaid/CHIP) and rates of no insurance as they are observed in the HPS. Estimates will be presented at the state and national level by selected individual and geographic characteristics. The survey does not include children, so the analysis is limited to adults 18 and older.
This blog will be updated on a monthly basis as new HPS data are released and compare the latest monthly coverage estimates (reference above in the subtitle) to estimates from March 2023, the last month before the unwinding began.
Highlighted Findings
Limited to statistically significant changes at the 95% confidence level.
- Compared to March 2023, ESI/Military coverage fell 1.6 percentage points (PP) to 52.1% among all adults in September. This decrease was reflected across several groups:
- Adults age 65 or older (2.4PP)
- White, non-Hispanic adults (2.1PP)
- Adults living in Medicaid expansion states (1.7PP)
- The uninsurance rate overall did not change significantly. While uninsurance rates among adults age 65 or older fell 1.1PP, significant increases were seen in the following groups:
- Adults age 18 - 64 (1.2PP)
- White, non-Hispanic adults (1.1PP)
- Adults with prior year household incomes of $50,000 - $74,999.
- Rates of any Medicaid fell 4.2PP among adults with prior year household incomes of $50,000 - $74,999. Rates among all adults held steady at 18.0%.
- The rate of Direct Purchase coverage increased in adults with prior year household incomes of $50,000 - $74,999.
- There were few meaningful changes in rates of Medicaid/CHIP as a primary source of coverage.
Select a coverage type from the orange box on the right in the dashboard below to filter the visualizations.
Methods and Data
This analysis uses public use microdata from the Household Pulse Survey (HPS), a monthly, nationally representative, quick-turnaround survey that collects data on topics including household demographics, education, employment, food sufficiency, financial spending, housing security, and physical and mental health, in addition to current health insurance coverage.
The survey has a typical monthly sample size of 60,000 to 80,000 U.S. adults and is designed to produce state-level (and a select number of metropolitan-level) estimates of the civilian noninstitutionalized adult population. The survey does not include children (those age 17 or younger).
As of January 2024, data is collected for approximately four weeks each month from adults age 18 or older via a short, online survey and is released on a monthly basis. Prior to this, data was collected for approximately two weeks each month and released on a monthly basis. Readers should keep in mind that the HPS emphasis on producing near-real-time data comes with the tradeoff of lower levels of data quality compared with “gold standard” surveys such as the American Community Survey (ACS).
These data quality issues include very low response rates (e.g., 6.7% response rate in the March 2023 survey), underrepresentation of harder-to-reach groups (e.g., adults with lower levels of education, young adults), a lack of editing and imputation for most variables, and likely some degree of nonresponse bias. For these reasons, HPS estimates should be treated with a greater degree of caution than estimates from other federal surveys.
Further, like other surveys, the HPS relies on respondents’ self-reporting their coverage, which is often associated with known biases such as the Medicaid Undercount and reflects respondents’ (sometimes imperfect) knowledge of their own coverage rather than the reality reflected in administrative data sources.
The HPS’ health insurance coverage measure is similar to that used in the ACS and asks respondents: “Are you currently covered by any of the following types of health insurance or health coverage plans?” Respondents are allowed to select “Yes” or “No” from among the following coverage types:
1. “Insurance through a current or former employer or union (through yourself or another family member)”;
2. “Insurance purchased directly from an insurance company, including marketplace coverage (through yourself or another family member)”;
3. “Medicare, for people 65 and older, or people with certain disabilities”;
4. “Medicaid, Medical Assistance, or any kind of government-assistance plan for those with low incomes or a disability”;
5. “TRICARE or other military health care”;
6. “VA (including those who have ever used or enrolled for VA health care)”;
7. “Indian Health Service”; or
8. “Other”
The response options for employer coverage [1], TRICARE [5], and VA [6] were combined into one Employer/Military coverage category, and respondents were considered uninsured if they didn’t affirmatively report any coverage under options 1-6.
 SHADAC’s primary source of coverage hierarchy was applied to determine which payer was likely primary when a respondent reported multiple sources of coverage (see SHADAC brief for more information).
For example, the hierarchy would classify a respondent reporting both Medicaid/CHIP coverage and Employer/Military coverage as having Employer/Military as a primary source of coverage, as Employer coverage typically acts as the primary payer for individuals with Employer and Medicaid coverage.
Estimates with a relative standard error (standard error divided by the percentage estimate) of 30% or greater, based on an unweighted denominator count of less than 50, based on an unweighted numerator count of less than five, or with a weighted estimate of exactly 0% or 100% were considered statistically unreliable and were suppressed.
Two-sided t-tests (95% confidence level) were used to assess statistically significant differences between the most recent data month and the baseline month (i.e., March). A lack of statistically significant difference does not affirmatively establish that there was no significant difference but rather that the data presented here are not sufficient to show a significant difference.
Blog & News
Walsh, Elliot
Liu, Grace
Social Vulnerability Index in Minnesota: Community and Uninsured Profile Interactive Map Updated with SVI, MNsure Regions, and More
July 02, 2024:SHADAC has made some exciting updates to our resource, “Minnesota’s Community and Uninsured Profile.” This profile, created with funding from the Blue Cross and Blue Shield of Minnesota Foundation, was designed to provide accessible information to policymakers and community members alike on Minnesota uninsured people and populations.
Along with updating the profile with 2022 American Community Survey data, researchers have also updated and added to the interactive map of Minnesota that allows users to visually explore the information & data, including information on Minnesotan communities' social vulnerability index. Our hope is that this update will make it even easier for people to:
- Explore the varied communities in the state
- Evaluate community needs
- Monitor equity initiatives, and
- Inform strategic planning
Let’s take a look at the major updates we’ve made to both the profile and its accompanying interactive map:
1. Social Vulnerability Index (SVI) Added to Interactive Map at the Zip Code Level
 SHADAC Researchers have added Social Vulnerability Index (SVI) ratings to the Minnesota Community and Uninsured Profile Interactive Map. What is SVI, though, and what does it mean for communities in Minnesota and beyond?
Social Vulnerability is defined by the Centers for Disease Control and Prevention (CDC) as, “the demographic and socioeconomic factors (such as poverty, lack of access to transportation, and crowded housing) that adversely affect communities that encounter hazards and other community-level stressors.” In short, it represents how vulnerable a community is to stressors, whether that’s a natural stressor (like a tornado or hurricane, for example) or human-caused (like a chemical spill, for example).
The Social Vulnerability Index (SVI) quantifies an area’s social vulnerability, assigning a numerical value that allows for comparison of different locations (counties, zip codes, etc.) to understand how different communities may respond to or be affected by hazards and stressors.
The index measures vulnerability based on four overall factors: socioeconomic status (including insurance status, educational status, housing costs, employment, poverty level), household characteristics (like age composition, English language proficiency, etc.), racial & ethnic minority status, and housing type & transportation (like multi-unit structures, mobile homes, access or lack of access to vehicle, public transit, overcrowding, etc.).
This SVI information now lives on the BCBS Minnesota Community and Uninsured Profile’s Interactive Map – users can click on each zip code area on the map revealing that area’s SVI along with other data such as rate of uninsured, population, and more. Find the map here or click on the image of the map.
2. Every Geographic Layer Now Clickable with Basic Stats
Before the latest update, users were only able to click on Zip Code Tabulation Areas (ZCTAs). Now, researchers have made it possible for users to click on various geographic layers. Along with ZCTAs, users can now click to get basic data (population, number of uninsured, and rate of uninsured) by:
- County
- Economic development region
- House district
- Senate district
- MNsure region
- And more
This allows users to view data in a larger variety of ways and view increasingly specific data in a more easily accessible way.
3. Toggle Other Relevant Factors
Researchers also updated the feature allowing users to toggle relevant indicators on the map such as:
- Native American reservation locations & names
- Hospitals
- Schools
- County seat
- And more
These relevant factors can have large impacts on that area’s overall community makeup and social vulnerability. For example, a geographic area that is close in proximity to multiple hospitals may be less socially vulnerable than a rural area that has no hospitals close by.
4. Profile Updated with Latest Available Data
Along with these key updates to the profile’s accompanying interactive map, researchers also recently updated the profile itself with 2022 American Community Survey data. Learn more about the data update in this blog post.
Start Using the Interactive Map to Learn About Minnesota’s Varied Communities
Understanding communities’ needs begins with understanding those communities and the people within them.
The Minnesota Community and Uninsured Profile was created to help people better understand the many diverse communities within the state. It provides users with important data and information that is accessible, specific, and relevant. Its accompanying interactive map puts that data and information into a clear visual space, helping users understand how geographic location impacts communities and their needs throughout the state.
Ready to learn more about the diversity of Minnesotan communities? Start exploring the interactive map here, and check out the full profile at this link.
Blog & News
2023 National Health Interview Survey (NHIS) Early Release: Estimates from Quarter 4 (October to December) Hold Steady
June 05, 2024:The National Center for Health Statistics (NCHS) has released quarterly estimates of health insurance coverage beginning in October 2022 through December 2023 from the National Health Interview Survey (NHIS) as a part of the NHIS Early Release Program. Each quarter covers a three-month span, and this blog specifically looks at survey data from the most recent quarter (Q4 – October to December 2023) and notes any differences compared to the same time period in 2022.
Between Q4 of 2022 and Q4 of 2023, rates of uninsurance, public coverage, and private coverage for adults (age 18-64) remained mostly unchanged. Across all age groups, there were slight decreases in the rates of uninsurance and private coverage, and a slight increase in the rate of public coverage, but none of these changes were statistically significant.
Figure 1: Health Insurance Coverage Rates by Type (Adults Aged 18-64), Q4 2022 vs. Q4 2023*
*No changes were statistically significant at 95% confidence.
- Brief: Comparing Federal Government Surveys That Count the Uninsured: 2023
- Blog: 2023 NHIS Early Release Estimates from Quarter 3 Hold Steady
- Blog: Insurance Coverage Trend Analysis – How Does the Household Pulse Survey Compare?
Sign up for our newsletter here to get the most up-to-date announcements, blogs, updates, and relevant data news & resources.
Publication
Comparing Federal Government Surveys That Count the Uninsured: 2023
 SHADAC has recently updated our annual “Comparing Federal Government Surveys that Count the Uninsured” brief following the release of new insurance coverage estimates from surveys conducted by the US Census Bureau, the Agency for Healthcare Research and Quality (AHRQ), and the Centers for Disease Control and Prevention (CDC).
Accurate estimates of the number of people that do not have insurance coverage (also referred to as uninsured or uninsurance) are important in understanding trends and the impacts of actions (policy changes), events (like public health emergencies), or shifts in the economic landscape (like periods of recession) that may affect health insurance coverage.
The brief provides an annual update to comparisons of uninsurance estimates from five federal surveys. As in prior years, we have included estimates from:
- The American Community Survey (ACS)
- The Current Population Survey (CPS)
- The Medical Expenditure Panel Survey - Household Component (MEPS-HC)
- The National Health Interview Survey (NHIS)
View and download the Comparing Federal Government Surveys 2023 Brief to learn more about our findings and analysis.
Publication
Categorization of Health Insurance Coverage Type from Survey Questions after Health Reform: The Case of the Current Population Survey
This article, coauthored by SHADAC Investigator Kathleen Call alongside colleagues from the Humphrey School of Public Affairs Angela Fertig and U.S. Census Bureau Joanne Pascale, used administrative records linked with survey data to explore how to categorize private marketplace coverage versus public coverage in the redesigned Current Population Survey (CPS) health insurance module.

To begin, using data from an experimental study called Comparing Health Insurance Measurement Error (CHIME) two algorithms were created.
The second algorithm, dubbed 'AR', classifies coverage type by leveraging survey responses matched to administrative records from a private health insurer.
The two algorithms were then compared by examining three reporting accuracy metrics of coverage type classification: underreporting, overreporting, and prevalence. Then, they used the results to assess whether the AR algorithm improved, or could improve, the accurate categorization of private versus public coverage on the CPS.
Principal Findings
This study’s findings show that the AR algorithm produced measurable improvements over the CON algorithm, with only one minor trade-off. Underreporting of public coverage was reduced by about 5 percentage points, and overreporting of private, marketplace, and nongroup/marketplace coverage was reduced (by almost 2 percentage points; almost 7 percentage points; and almost 11 percentage points, respectively).
The cost of these improved metrics was higher underreporting of marketplace and nongroup/marketplace coverage.
However, because one of the main goals and motivations for this research project was to address the problem of the chronic underreporting of public coverage, researchers suggest that the trade off to improve reporting of public coverage with a cost of underreporting marketplace coverage (that has relatively low prevalence) might be acceptable.
To read the full article, visit this link.