Blog & News
Affordability and Access to Care in 2018: Examining Racial and Educational Inequities across the United States (Infographic)
December 17, 2019: The Centers for Medicare and Medicaid Services (CMS) recently reported that the cost of health care spending in the United States increased by 4.6 percent last year to reach an all-time high of approximately $3.6 trillion.1 This report comes amidst a number of other concerning health care cost-related trends, such as the largest single-year increase for single-coverage premiums in 2018 from $6,368 to $6,715 (5.4 percent) for workers enrolled in employer-sponsored insurance (ESI) and an increase in average household spending on health care (out of pocket expenses, cost-sharing for ESI, and payroll taxes for Medicare, etc.) rising to a record $1.04 trillion.2
Rising expenses such as these have contributed to the record number of Americans (25 percent) who reported in 2019 that either themselves or a family member skipped or delayed needed medical care due to cost, according to the results from a new Gallup poll released earlier this month.3
This post examines Americans’ access and ability to afford medical care, focusing on inequities related to race/ethnicity and education, and using two recently updated measures from SHADAC’s State Health Compare: Adults Who Forgo Needed Medical Care and Adults with No Personal Doctor. These measures come from a SHADAC analysis of 2018 data from the CDC’s Behavioral Risk Factor Surveillance System (BRFSS).
Racial and educational inequities persist in adults’ reported ability to afford needed medical care
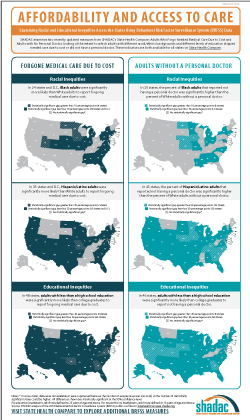
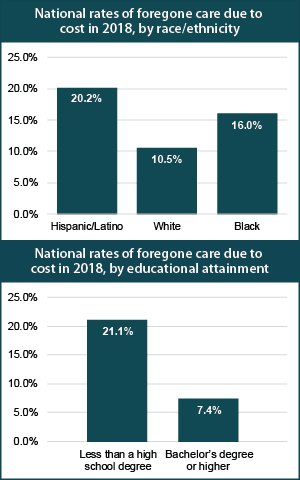
 Significant inequities in adults’ ability to afford medical care by race/ethnicity emerged when we examined the updated data for 2018. At the national level, our analysis showed that Hispanic/Latino adults were nearly twice as likely as White adults to forgo needed medical care due to cost (20.2 percent versus 10.5 percent), and African Americans/Black adults were 1.5 times as likely to report forgoing care compared to White adults (16.0 percent versus 10.5 percent). Hispanic/Latino adults were also significantly more likely to report forgoing medical care than White adults in 35 states and D.C., and this gap was greater than 20 percentage points in Maryland (31.4 percent versus 7.4 percent) and Missouri (34.4 percent versus 11.1 percent). Black adults were significantly more likely to report going without care than White adults in 24 states and D.C., and this gap was greater than 10 percentage points in four states: Iowa (16.2 percentage points), North Dakota (15.5 percentage points), Utah (11.5 percentage points), and Minnesota (10.2 percentage points).
Nationwide, Americans with less than a high school degree were almost three times as likely to report going without needed medical care due to cost as compared to those with a bachelor’s degree (21.1 percent versus 7.4 percent) in 2018. Adults with less than a high school education were significantly more likely to report forgone care due to cost compared to adults with college degrees in 2018 in all but two states—Montana and Vermont—and in the District of Columbia (D.C.). For four states this gap was greater than 20 percentage points in 2018—Georgia (21.1 percentage points), Maryland (20.9 percentage points), Oklahoma (21.2 percentage points), and Virginia (21.2 percentage points).*
Racial/ethnic minorities and adults without a high school diploma less likely to have a personal doctor
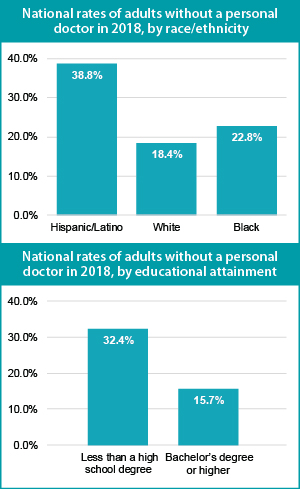
 Nationally, Hispanic/Latino and Black adults were both significantly more likely to report not having a regular doctor as compared to their White counterparts. Our analysis revealed that Hispanic/Latino adults were more than twice as likely as White adults to report not having a personal doctor (38.8 percent versus 18.4 percent), and Black adults were nearly 25 percent more likely to report not having a personal doctor compared with White adults (22.8 percent versus 18.4 percent).*
These inequities in access to care by race/ethnicity were present in a large majority of states. A significant gap between Hispanic/Latino and White adults with no personal doctor was present in 43 states, and Hispanic adults were more than three times as likely to report not having a personal doctor in five states (Connecticut, Maryland, Nebraska, New Jersey, and North Carolina). This significant gap also persisted between Black and White adults in 20 states, as we found that Black adults were more than twice as likely to not have a personal doctor in three states—Connecticut (22.8 percent versus 10.8 percent), Iowa (31.2 percent versus 15.1 percent), and Rhode Island (21.2 percent versus 9.9 percent).*
Nationally, adults with less than a high school degree were more than twice as likely to not have a regular doctor as those with an undergraduate degree or greater (32.4 percent versus 15.7 percent). This pattern was consistent across nearly the entire nation, as adults with less than a high school education were significantly more likely than college graduates to report not having a personal doctor in 46 states. The gap between less than high school graduates and college graduates was larger than 20 percentage points in eight states (California, Colorado, Georgia, Maryland, Nebraska, Nevada, New Jersey, and Utah).
Note
* Data were not available or were suppressed for some states because the number of sample cases was too small, so this number could be higher if data were available in all states. For education breakdowns, adults are defined as 25 years of age and above. For race/ethnicity breakdowns, adults are defined as 18 years of age and above. All differences are statistically significant at the 95% level.
Explore Additional BRFSS Data at State Health Compare
Visit State Health Compare to explore national and state-level estimates for the following measures that also come from the BRFSS:
Income Inequality
Sales of Opioid Painkillers
Adult Cancer Screenings
Chronic Disease Prevalence
Activities Limited due to Health Difficulty
Adult Obesity
Adult Binge Drinking
Adult Smoking
Adult E-Cigarette Use (New Measure)
State Health Compare also features a number of other indicator categories, including: health insurance coverage, cost of care, access to and utilization of care, care quality, health behaviors, health outcomes, and social determinants of health.
Related Reading
Now Available on State Health Compare: Eleven Updated Measures and One Brand New Measure
Educational Attainment and Access to Health Care: 50-State Analysis
Fifty-State Analysis Finds Lower Access to Care among Adults with Less Education
[1] Hartman, M., Martin, A.B., Benson, J., & Catlin, A. (2019, December 5). National Health Care Spending in 2018: Growth Driven by Accelerations in Medicare and Private Insurance Spending. HealthAffairs. [E-published ahead of print.] https://doi.org/10.1377/hlthaff.2019.01451
[2] State Health Access Data Assistance Center (SHADAC). (2019, August 14). State-level Trends in Employer-Sponsored Health Insurance, 2014-2018. Retrieved from https://www.shadac.org/ESIReport2019
Murad, Y. (2019, December 5). U.S Health Spending Rose to $3.6 Trillion in 2018, Propelled by Health Insurance Tax. Morning Consult. Retrieved from https://morningconsult.com/2019/12/05/u-s-health-spending-rose-to-3-6-trillion-in-2018-propelled-by-health-insurance-tax/
[3] Saad, L. (2019, December 9, 2019). More Americans Delaying Medical Treatment Due to Cost. Retrieved from https://news.gallup.com/poll/269138/americans-delaying-medical-treatment-due-cost.aspx
Pages
- « first
- ‹ previous
- 1
- 2
- 3


