Blog & News


Seven Measures Have Been Retired from State Health Compare
December 10, 2024:To maintain State Health Compare (SHC) as a relevant and current resource for data users, SHADAC regularly evaluates our collection of SHC measures to ensure they inform current health care and health policy discussions. We also want to be able to update measures consistently with recent data.
As a part of this process, SHADAC both adds new measures to State Health Compare and retires existing measures if they can no longer be updated, are no longer relevant to the current moment, are little used by SHC users, or fall outside of SHADAC’s areas of focus.
To that end, SHADAC has retired seven measures from State Health Compare. The measures will continue to live at their same web addresses (URLs), but they will no longer be updated or displayed in the list of SHC measures on the Explore Data page. These seven measures that have been retired are as follows:
Blog & News
Walsh, Elliot
Hest, Robert
Stewart, Andrea
Survey Data Season Essentials: ACS vs CPS: What Is the Difference Between These Two Federal Surveys?
October 03, 2024:
This post is a part of our Survey Data Season series where we examine data from various surveys that are released annually from the summer through early fall. Find all of the Survey Data Season series posts on our Survey Data Season 2024 page here.
Each year, SHADAC covers the data releases of multiple federal surveys from a variety of agencies, beginning with the National Health Interview Survey (NHIS) in June continuing through the release of Current Population Survey Annual Social and Economic Supplement (CPS ASEC) and American Community Survey (ACS) data products in September through January.
Recently, survey data from both the 2024 Current Population Survey Annual Social and Economic Supplement and the 2023 American Community Survey were released. While these two surveys overlap in a number of topics and similarities, they are also distinct in what they measure and how.
In this blog, we will discuss the similarities and differences between two of the biggest federal survey resources available: the ACS and the CPS ASEC.
Which Federal Agencies Conduct the CPS and the ACS?
The United States Census Bureau has conducted the Current Population Survey Annual Social and Economic Supplement (CPS ASEC) since 1947 and the current iteration of the American Community Survey (ACS) since 2005 (though Census has conducted similar, prototype ACS surveys since 2000).
The Current Population Survey is jointly sponsored by the Census Bureau and the U.S. Bureau of Labor Statistics (BLS).
When Are CPS and ACS Data Released?
Single-year data from the two surveys is released annually in the second week of September, with supplemental materials for the ACS - such as the Public Use Microdata Sample or “PUMS” files, and the 5-year combined estimates - released later in the year.
Find the survey data release schedules for these and other survey data resources on our Survey Data Season page.
Can You Combine or Compare Multiple Years of ACS or CPS Data?
Yes - you can combine and/or compare multiple years of ACS data*. Along with 1-year ACS data files released in September, the Census Bureau has also released 5-year ACS data files annually in December since 2009.
Yes - you can generally combine and/or compare multiple years of CPS data. Care should be taken in combining or comparing across CPS data years, as the survey methodology has been revised numerous times throughout its history. Additionally, because some of the same individuals are surveyed across two CPS data years, researchers should think carefully about how to treat those repeated observations.
On SHADAC’s online data tool, State Health Compare, multiple measures utilize ACS or CPS data that allow users to compare years, trends, and more. We will go over some specific examples of how we use ACS and CPS data later in this blog.
*Except 2020 data, for which the COVID-19 pandemic majorly impacted data collection and distribution efforts. These data are considered “experimental only” and should not be compared to or combined with other years of data. However, the Census Bureau notes that the 5-year files that have the 2020 data year within them are okay for normal use.
Design Differences Between the CPS and the ACS
While both of these surveys are conducted by the Census Bureau, they differ in design, methods, measures, and more. The table below provides an overview of some of the most major differences.
| Current Population Survey (CPS) | American Community Survey (ACS) | |
|---|---|---|
| Data Collection Period | February through April of survey year | January through December of survey year |
| Method | Survey of civilian non-institutionalized U.S. population | Survey of U.S. population (including group quarters) |
| Annual Housing Units Interviewed | About 60,000 | About 2.15 million |
| Geography* | Nation, region, states | Nation, states, sub-state |
| Mode | Phone and in-person^ | Mail, in-person, and internet^ |
| Uninsurance: Measure |
Uninsured measured by: - All year - Part of year (since 2018) - Point-in-time (since 2014) |
Uninsurance measured by: - Point-in-time |
| Health Insurance Coverage: Years Available |
1979 to 2024 | 2008 to 2023✝ |
*Geographic level available for data breakdowns - i.e., CPS data is available for the U.S., by region (Midwest, South, Northeast, West) and for states.
^In-person (ACS & CPS) and mailing activities (ACS) were halted in March 2020. Both resumed in limited capacity in July 2020, and in-person activities resumed fully in September 2020 while mailing activities resumed fully in April 2021.
✝ 2020 data are experimental release only and should not be compared to other years of data.
What Do the ACS vs CPS Measure?
Both the ACS and the CPS gather information on a wide variety of measures.
According to its page on the Census Bureau website, the Current Population Survey, “[provides] information on many of the things that define us as individuals and as a society – our work, our earnings, and our education. In addition to being the primary source of monthly labor force statistics, the CPS is used to collect data for a variety of other studies that keep the nation informed of the economic and social well-being of its people.”
Specifically, the CPS collects data on measures like:
- Health insurance coverage
- Unemployment
- Labor force participation rate
- Employment data (occupation, industry, class of worker)
- Employment-population ratio
- Child support
- School enrollment
- Demographic data collection (age, race, sex, gender, etc.)
According to its page on the Census Bureau website, the American Community Survey, “helps local officials, community leaders, and businesses understand the changes taking place in their communities. It is the premier source for detailed population and housing information about our nation.”
Specifically, the ACS collects data on measures like:
- Health insurance coverage
- Jobs and occupations
- Educational attainment
- Information on veterans
- Whether people own or rent their homes
- Employment status
- Disability information
- Housing costs
- Demographic data collection (age, race, sex, gender, etc.)
You can learn more about the specific questions & measures on the American Community Survey, and why they are asked, on the “Why We Ask Each Question” page on the Census Bureau website.
As you can see, both surveys collect data on similar topics: housing, income, insurance coverage, demographic information, employment, education, and more. A key difference between these two sources is that the ACS provides us with both national and state-level data and estimates for these measures (in addition to lower levels of geography), while the CPS mainly focuses on national-level data.
ACS vs CPS: Guidance on When to Use Each Source
Knowing what survey data to use depends on what you’re looking at, what measures you’re interested in, the years you’re looking at, and more. The table below guides you through common uses of ACS and CPS survey data, and when to use which source.
| Current Population Survey (CPS) | American Community Survey (ACS) | |
|---|---|---|
| Trends by Year | 1979 to 1986 1987 to 2012 2013 to 2017 2017 forward |
2008 forward*✝ |
| State Estimates | Yes - can be used for state-level estimates | Yes - can be used for state-level estimates |
| Sub-state Estimates | N/A: CPS does not collect sub-state data |
Yes: 1-year for geographies with populations > 65,000 5-year for all geographic areas including all counties and ZIP code tabulation areas (ZCTA) |
| Small Populations | Sample size does not support estimates for small populations | Yes |
* While the ACS began in 2005, health insurance coverage questions were not added until 2008.
✝ Except 2020 data, which were “experimental” and should not be compared to other data years.
How Does SHADAC Use ACS and CPS data?
One of the main ways that SHADAC uses the data from these surveys is for our health insurance coverage estimates. These two sources are essential for how SHADAC estimates uninsurance, public insurance, and private insurance coverage rates, including providing information on health insurance coverage nationally, by state, and by demographic categories like race and ethnicity, income, age, and more.
Using the latest 2023 data released in September 2024 from each of these two surveys, SHADAC researchers created two resources explaining overall health insurance coverage estimates. Some of our main findings from these data sources this year include:
- a stable national uninsurance rate for the total U.S. population in 2023
- at 7.9% according to the ACS (compared to 8.0% in 2022)
- at 8.0% according to the CPS (compared to 7.9% in 2022)
- the rate of uninsurance among children (age 0-18) rose significantly
- to 5.8% in 2023 from 5.4% in 2022 according to CPS data
- to 5.4% in 2023 from 5.1% in 2022 according to ACS data
Read the details on our findings from these two surveys at the links below:
SHADAC also uses the wide variety of measures and data available from these surveys on our State Health Compare tool. This online and interactive data tool allows users to create customized data sets and visualizations of state-level health estimates for a number of measures under many categories, including measures on:
- Health Insurance Coverage
- Access to Care
- Cost of Care
- And more
Take a look at the measures available on our State Health Compare (SHC) site that use data from the ACS and CPS!
Measures that Use ACS Data on SHC
Click on any of these measures to explore the data on State Health Compare.
Health Insurance Coverage Type
Percent of adults with fair or poor health status
Percent of households with a broadband internet subscription
Percent of children considered to be poor (<100% FPG)
Income inequality (Gini Coefficient)
Percent of cost-burdened rental households
Measures That Use CPS Data on SHC
Click on any of these measures to explore the data on State Health Compare.
Health Insurance Coverage Type
Percent of people with a high medical cost burden
Median Medical Out-of-Pocket Spending
Percent of adults with fair or poor health status
Have you used State Health Compare to explore data and delve into health care topics? Share your work and tag us on LinkedIn - we love to see how people use SHC to make connections, identify gaps, and work towards making health care accessible & affordable for all people. You can also e-mail us at shadac@umn.edu - we would love to connect!
Stay Updated with SHADAC’s Survey Data Season Series
Stay up to date on our Survey Data Season series, with more Essentials blogs like this one along with other products analyzing newly released data, by signing up for our newsletter and following us on LinkedIn.
Blog & News

2023 ACS Tables: State and County Uninsured Rates, with Comparison Year 2022
September 17, 2024:
This post is a part of our Survey Data Season series where we examine data from various surveys that are released annually from the summer through early fall. Find all of the Survey Data Season series posts on our Survey Data Season 2024 page here.
Each year, SHADAC uses data released from the American Community Survey (ACS) via the U.S. Census Bureau's data.census.gov tool to produce estimates of uninsurance at the state and county level.*
Click on a state below in the interactive map to see a PDF table of uninsured rates by state and sub-state geographies, but also by demographic characteristics (e.g., age, race/ethnicity, and poverty level) for 2023 and comparison year 2022.
Figure 1: Uninsured Rates by State for 2023, Comparison Year 2022

Click here to view uninsurance estimates for the United States.
Click here to view uninsurance estimates for Puerto Rico and its municipios.
Note: These tables present uninsured rates, which indicate the share of the population that is uninsured. For example, a 10 percent uninsured rate for adult women indicates that 10 percent of all adult women are uninsured.
Maps & Tables of Private, Public, & Uninsured Changes from 2022 to 2023
- Private Coverage Rates by State, Change from 2022 to 2023, for All People
- Public Coverage Rates by State, Change from 2022 to 2023, for All People
- Uninsurance Rates by State, Change from 2022 to 2023, for All People
About the American Community Survey (ACS)
The ACS is a household survey that began in 2005 and produces annually updated data on a variety of population characteristics, including health insurance coverage. In total, the ACS surveys approximately three million U.S. households each year. An important feature of the American Community Survey is that it includes a large enough sample for state‐level and sub‐state estimates.
The ACS began asking survey respondents about health insurance coverage during the 2008 calendar year. Specifically, the survey asks respondents about current coverage for each person in the respondent’s household. A person is categorized as “insured” if he or she has coverage at the point in time at which the survey is administered.
*Why Aren’t Estimates Provided for All Counties?
Due to sample size constraints, single-year ACS estimates are available at the county level only for counties with a population greater than 65,000.
How Are These Estimates Different from the Estimates that SHADAC Publishes Using Census Bureau Micro-Data Files?
Two definitions used by the Census Bureau to generate the tabulations above differ from those that SHADAC uses to generate tabulations for State Health Compare. The definitional differences are as follows:
Family
The Census Bureau defines a family as “all related people in a household.”
SHADAC defines a family using a measure called the “Health Insurance Unit” (HIU), which includes all individuals who would likely be considered a family unit in determining eligibility for either private or public coverage.
To learn more about the 2020 update of SHADAC's Health Insurance Unit (HIU) see our HIU resource page, which houses two issue briefs: The first brief describes the SHADAC HIU, its purpose, the most recent update, and improvements to HIU data inputs; the second brief outlines the impacts of using the SHADAC HIU in analysis so that researchers can assess whether the SHADAC HIU is suitable for their research and what the potential impacts of its use might be. The page also provides a link to STATA and SAS codes to aid in the use of the HIU variable.
Family Income
The Census Bureau determines family income as a percentage of the Federal Poverty Level (FPL), which is a definition of poverty used primarily for statistical purposes. For example, FPL is used to estimate the number of Americans living in poverty each year.
SHADAC determines family income as a percentage of the U.S. Department of Health and Human Services’ Federal Poverty Guidelines (FPG), which is a measure used for administrative purposes. For example, FPG is used to determine eligibility for federal programs such as Medicaid and the Supplemental Nutrition Assistance Program (SNAP).
To learn more about the difference between FPL and FPG, read our updated FPL and FPG blog post from April 2024.
Related Survey Data Season Materials
Blog & News
Hest, Robert
Stewart, Andrea
2023 ACS: After Two Years of Decline, Uninsured Rates Increased for Children; Public and Private Coverage Rates See Variations Across the States
September 30, 2024:
This post is a part of our Survey Data Season series where we examine data from various surveys that are released annually from the summer through early fall. Find all of the Survey Data Season series posts on our Survey Data Season 2024 page here.
The U.S. Census Bureau released 2023 health insurance coverage estimates from the American Community Survey (ACS) yesterday, September 12, 2024. These estimates include both national- and state-level information about health insurance coverage by type, as well by certain demographic categories.
Overall, 2023 ACS data and findings at the national level echoed those from the Current Population Survey (CPS ASEC), which was released this past Tuesday, September 10, 2024. According to new ACS data, among the total U.S. population, the 7.9% uninsured rate in 2023 remained statistically unchanged from the previous year (8.0%).
Also like the 2023 CPS data, the newly released ACS data show a significant increase in the uninsured rate among children (age 0-18) in 2023, rising to 5.4% from 5.1% in 2022.
The rest of the blog will walk through state-level findings regarding different types of health insurance coverage (public, private, and uninsurance) in 2023. We will also discuss changes by age category for nonelderly adults (age 19-64) and children (age 0-18).
Key Findings from the 2023 ACS by Health Insurance Coverage Types
Uninsurance
The stability of the national uninsurance rate from 2022 to 2023 was supported by little change among the states between these two years as well.
The uninsured rate fell in 11 states, and increased in Iowa, New Jersey, and New Mexico. North Dakota saw the largest decrease in uninsurance at 1.9 percentage points (PP), moving from 6.4% in 2022 to 4.5% in 2023. New Mexico saw the largest percentage point increase in uninsurance at 0.9 PP, rising from 8.2% in 2022 to 9.1% in 2023. Across the states, Texas and Massachusetts continued their long-running trend as the states with the highest and lowest rates of uninsurance, at 16.4% and 2.6%, respectively.
Private Coverage
2023 ACS data show that rates of private coverage fell slightly to 67.0% in 2023 from 67.2% in 2022. Rates of employer-sponsored insurance coverage (ESI) and direct purchase coverage were unchanged at 54.7% and 13.9%, respectively.
Private insurance coverage rates decreased in nine states in 2023, and increased in four - Florida, North Dakota, Texas, and West Virginia. Delaware saw the largest decrease in private coverage with a 2.7PP decrease from 71.8% in 2022 to 69.1% in 2023. North Dakota saw the largest increase in private coverage, rising 2.4PP from 78.4% in 2022 to 80.8% in 2023. Rates of private coverage across the states ranged from a high of 80.8% in North Dakota to a low of 54.1% in New Mexico.
Public Coverage
Nationally, the rate of public insurance coverage rose significantly in 2023, increasing to 37.4% from 37.2% the previous year. Surprisingly, the rate of Medicaid coverage was unchanged at 21.3% (21.2% in 2022), while the rate of Medicare coverage rose to 18.8% in 2023 from 18.5% the year prior.
Public coverage saw the most change of all insurance types across the states in 2023, increasing in 13 and decreasing only in Arkansas, Idaho, Texas, and West Virginia. Arkansas saw the largest decrease in public coverage, falling by exactly 2.0PP from 45.0% in 2022 to 43.0% in 2023. Wyoming experienced the largest increase in public coverage, rising also by exactly 2.0PP from 31.2% in 2022 to 33.2% in 2023. Across the states, rates of public coverage ranged from a high of 52.2% in New Mexico to a low of 22.6% in Idaho in 2023.
Key State-Level Findings from the 2023 ACS by Age: Nonelderly Adults (19-64)
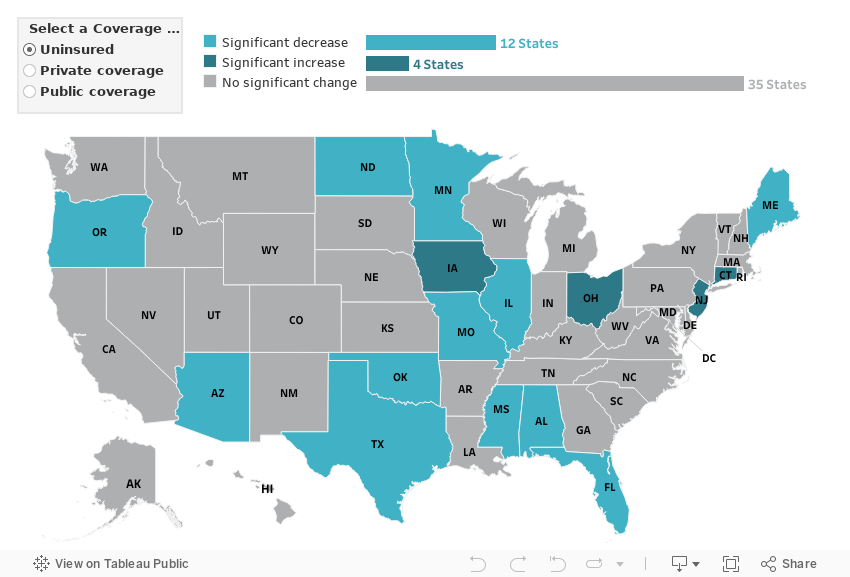
Uninsurance
The uninsured rate among nonelderly adults decreased 0.3PP from 11.3% in 2022 to 11.0% in 2023, representing the third year of falling uninsured rates for this group. Twelve states saw decreases in their uninsured rates while only Connecticut, Iowa, New Jersey, and Ohio saw increases in their uninsured rates. As with the overall population, North Dakota saw the largest decrease in uninsured rates among nonelderly adults, decreasing 2.2PP to 6.1% in 2023. Iowa saw the largest increase in uninsured rates, rising 1.0PP to 7.1% in 2023.
Private Coverage
The rate of private coverage among nonelderly adults was unchanged at 73.5% in 2023 (73.4% in 2022). Across the states, nearly the same number experienced increases (eight) in private coverage rates for nonelderly adults as experienced decreases (six). North Dakota had the largest increase at 3.3PP, with private coverage rates rising to 85.1% in 2023 from 81.8% in 2022. Delaware saw the largest decrease at 2.3PP, with private coverage rates falling to 74.0% in 2023 from 76.3% in 2022.
Public Coverage
The rate of public coverage among nonelderly adults was also unchanged in 2023, holding steady at 19.5% (19.4% in 2022). Looking at the states, this rate stability was supported by a nearly equal number of states that experienced increases (six) as did those that experienced decreases (five). Delaware had the largest increase in public coverage, rising 2.1PP to 21.4% in 2023 from 19.3% in 2022. Arkansas had the largest decrease in public coverage, falling by 2.1PP to 24.1% in 2023 from 26.2% in 2022.
Key State-Level Findings from the 2023 ACS by Age: Children (0-18)
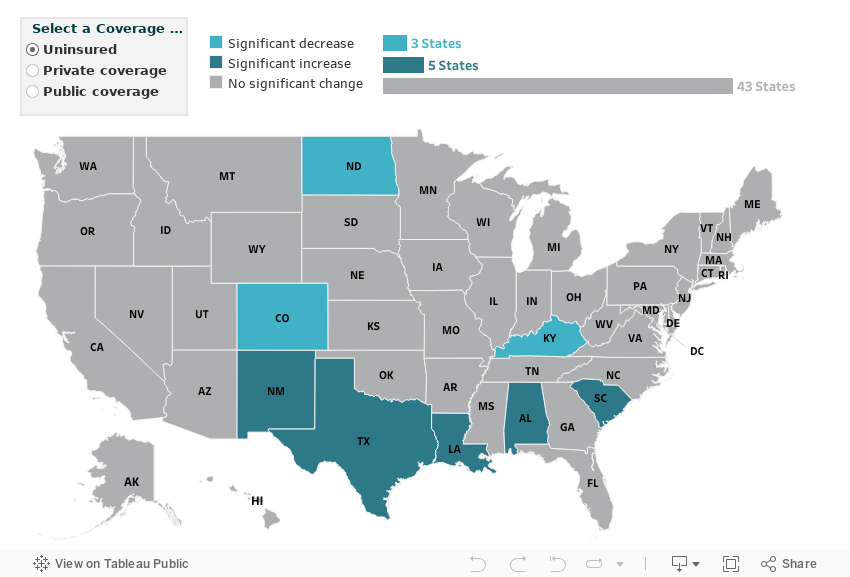
Uninsurance
The uninsured rate among children rose 0.3PP to 5.4% in 2023 from 5.1% in 2022. This change represents the first year of increased uninsurance among children after two years of falling rates. Five states saw an increase in their uninsured rate while three states — Colorado, Kentucky, and North Dakota — saw a decrease in their uninsured rate. As with nonelderly adults, North Dakota had the largest decrease in uninsured rates for children, falling 1.9PP from 5.5% in 2022 to 3.6% in 2023. New Mexico saw the largest increase in uninsurance, rising 2.1PP from 3.8% in 2022 to 5.9% in 2023. Rates of uninsurance among children ranged from a low of just 1.3% in the District of Columbia to a high of 11.9% in Texas.
Private Coverage
The rate of private coverage among children in 2023 was 60.6%, unchanged from the same recorded rate in 2022. Nearly as many states — Florida, Illinois, Maryland, and West Virginia — saw increases in rates of private coverage as those that saw decreases — New Mexico, Ohio, Pennsylvania, Tennessee, and Wyoming — from 2022 to 2023. West Virginia has the largest increase in private coverage, rising 4.8PP to 57.3% while Wyoming had the largest decrease in private coverage, falling 6.4PP to 65.2%.
Public Coverage
The rate of public coverage among children in 2023 was 39.4%, statistically unchanged from the previous year at 39.6%. Five states — Iowa, Missouri, New Mexico, Tennessee, and Wyoming — saw an increase in public coverage while seven saw a decrease in public coverage. Wyoming had the largest increase in public coverage, rising 9.5PP to 33.6% while West Virginia had the largest decrease in public coverage, falling 5.0PP to 46.0% in 2023.
Future Data Releases and Products
Supplemental tables for the 2023 ACS 1-Year Estimates will be released from the U.S. Census Bureau on October 17, 2024, and 2019-2023 ACS 5-Year Estimates will be available on December 12, 2024. Stay up to date with the latest Survey Data Season releases and resources on the archive page here.
We will also soon be releasing more granular details about insurance coverage changes in the states from 2022 to 2023 via customized SHADAC tables examining coverage at the state and county level, along with an announcement of updated health insurance coverage measures available on State Health Compare.
Concluding the Continuous Coverage Requirement and the Medicaid Unwinding
The continuous coverage requirement that prevented states from terminating individuals’ Medicaid coverage during the COVID-19 pandemic ended on March 31, 2023. The resumption of Medicaid eligibility redeterminations and renewals (and potential disenrollments), a process commonly referred to as the “unwinding,” began on April 1, 2023 and has since ended on June 30, 2024.
Each state was given a 14-month period to navigate returning to normal operations while also meeting reporting requirements set by the Centers for Medicare & Medicaid Services (CMS), such as submitting monthly “Unwinding Data Reports,” in order to publicly share coverage transitions and outcomes data during this time. Though the unwinding period has come to a close, a May 30, 2024, State Health Official (SHO) letter announced that CMS will extend these requirements for the foreseeable future. Beginning on July 1, 2024, all states are expected to continue to submit certain metrics contained in the Unwinding Data Report, now referred to as an “Eligibility Processing Report,” on an ongoing basis.
For more information on the post-unwinding period and reporting process, see a recent blog written by SHADAC researchers for State Health & Value Strategies:
Unwinding Ends, but States’ Reporting of Medicaid Renewal Data Continues (SHVS Cross-Post)
It is important to note that full-year 2023 estimates from all surveys, including the ACS and CPS, will not be fully reflective of a Medicaid unwinding process that began mid-year. However, provisional data from sources like the Census Bureau’s Household Pulse Survey, can give us an indicator of coverage trends during this time.
If you are interested in learning more, SHADAC researchers have compiled a clear, concise, and informative data resource that can be found here:
Related Releases and Materials
Recent Data Release: Current Population Survey ASEC: 2023 National Health Insurance Coverage Estimates Remain Steady for Adults but Rise for Children
We just released a new blog and accompanying infographic from SHADAC researchers covering the release of 2023 health insurance coverage data across the United States. Drawing from the Current Population Survey Annual Social and Economic Supplement (CPS ASEC), the blog looks at uninsured rates at the national level, as well as by select demographic categories.
Upcoming Webinar: U.S. Census Bureau Data Explained: Breaking Down 2023 Health Insurance Coverage Estimates from the ACS & CPS - featuring a Q&A with a Census Bureau Expert
On Thursday, September 26th at 1:00 PM CST, SHADAC will host a webinar covering the release of new Census data on health insurance coverage estimates for 2023. The estimates come from two key federal surveys conducted by the U.S. Census Bureau: The American Community Survey (ACS) and the Current Population Survey (CPS).
SHADAC researchers and presenters Robert Hest and Andrea Stewart will discuss the 2023 health insurance data at national and state levels, as well as by coverage type, and a range of other demographic categories (age, geography, poverty level, and more).
In addition, SHADAC will walk through how to access the data and examples of how to use it to answer research questions. We are also pleased to once again welcome a special guest from the Census Bureau, Sharon Stern, who will join us to answer questions from attendees after the presentation.

Notes
All changes described in this document are significant at the 90% level. Private coverage includes individually purchased, employer-sponsored coverage, and TRICARE military health coverage. Public coverage includes Medicare, Medicaid/CHIP, and VA health care. Public and private coverage types are not exclusive and include individuals with those types of coverage alone or in combination with other coverage. Estimates represent the civilian noninstitutionalized population.
Overarching estimates of uninsurance and public and private coverage are for all ages, except where noted for children (age 0-18) and nonelderly adults (19-64).
Publication
A Post-Pandemic Look at the Cost of Employer-Sponsored Insurance (ESI) Coverage: Data from the 2023 Medical Expenditure Panel Survey (MEPS)
This post is a part of our Survey Data Season series where we examine data from various surveys that are released annually from the summer through early fall. Find all of the Survey Data Season series posts on our Survey Data Season 2024 page here.
Over the past five years, the makeup of the health insurance coverage marketplace in the United States has changed considerably due in large part to the COVID-19 related public health emergency (PHE) and its effects, both immediate and delayed. The arrival of the coronavirus caused an unprecedented spike in unemployment which, for those affected, led to a resultant loss of employer-sponsored health insurance coverage – also commonly referred to as employer-sponsored insurance, or ESI.
These losses were at least partially offset by rising enrollment in and retention of public health insurance coverage like Medicaid under the continuous coverage requirement in the Families First Coronavirus Response Act (FFCRA). However, this requirement has now ended, and states have officially completed the transition to restart standard redetermination and enrollment procedures, a period commonly known as the “Medicaid unwinding,” or simply, the “unwinding.”

Preliminary data from states and federal sources like the Household Pulse Survey (HPS) suggests a potential recovery for ESI enrollment in the coming years, a trend that SHADAC will continue to monitor.
New ESI Report from SHADAC
A new report from SHADAC researchers Andrea Stewart and Robert Hest uses estimates from the Medical Expenditure Panel Survey-Insurance Component (MEPS-IC), produced by the Agency for Healthcare Research and Quality (AHRQ), to look at national and state-level ESI data in 2023 with 2022 as a comparison.
Despite pandemic-related decreases, ESI still represents the primary source of health insurance coverage for a majority of the U.S. population (54.7%, or approximately 182.3 million people in 2023), and it important to understand how trends in coverage and, most importantly, cost, have changed in the emergence from the pandemic and in the months post-continuous coverage requirement.
ESI cost-related factors included in the report are:
- Premiums (single and family)
- Deductibles (single and family), and
- Enrollment in high-deductible health plans (HDHPs)
Accompanying this narrative are detailed 50-state comparison tables that allow for easy cross-state analysis of ESI trends from 2019 to 2023, significant changes in ESI rates from 2022 to 2023, and state vs national average comparisons for 2023 estimates.
Find the full report here, and the 50-state comparison tables below.

Looking for more resources on health insurance coverage and cost? Check out some of the following SHADAC resources:
- Blog: 2023 NHIS Full-Year Health Insurance Estimates Early Release: Decreasing Uninsured Rates Overall and for Certain Groups of Nonelderly Adults
- Blog and Infographic: CPS ASEC: 2023 National Health Insurance Coverage Estimates Remain Steady for Adults but Rise for Children
- Blog: 2023 ACS: After Two Years of Decline, Uninsured Rates Increased for Children; Public and Private Coverage Rates See Variations Across the States