VISIT STATE HEALTH COMPARE
Publication


Changes in Federal Surveys Due to and During COVID-19 Brief
 On a recent webinar, the U.S. Census Bureau made the announcement that they will not be releasing 2020 data from the American Community Survey (ACS) as usual in September. Instead, due to the impact of the coronavirus pandemic, “experimental” estimates will be available in November. This substantial change to the data release of a major federal survey highlights one (among many) of the disruptive effects of the coronavirus—the interruption of data collection processes and falling response rates for yearly federal surveys.
Other federal agencies have made their own attempts at adapting surveys to address pandemic-related challenges: delaying data release dates, shifting in-person collection methods to phone and email, adding COVID-related questions to their questionnaire, canceling survey collection for the year, or even creating an entirely new survey, such as the Census Bureau’s new Household Pulse Survey (HPS).
A new brief from SHADAC summarizes these and other COVID-era changes and challenges for four major federal surveys—American Community Survey (ACS), Current Population Survey (CPS), Medical Expenditure Panel Survey (MEPS), and National Health Interview Survey (NHIS)—and explains what effects these adaptations may have for understanding 2020 data as it becomes available.
For more announcements and information related to the 2020 ACS data release changes, visit our webpage.

Publication
Comparing Federal Government Surveys That Count the Uninsured: 2020
 With the release of new insurance coverage estimates from surveys conducted by the U.S. Census Bureau, the Agency for Healthcare Research and Quality (AHRQ), and the Centers for Disease Control and Prevention (CDC), SHADAC has updated our annual “Comparing Federal Government Surveys that Count the Uninsured” brief.
The brief provides an annual update to comparisons of uninsurance estimates from four federal surveys:
- The American Community Survey (ACS)
- The Current Population Survey (CPS)
- The Medical Expenditure Panel Survey - Household Component (MEPS-HC)
- The National Health Interview Survey (NHIS)
In this brief, SHADAC presents current and historical national estimates of uninsurance along with the most recent available state-level estimates from these surveys. We also discuss the main reasons for variation in the estimates across the different surveys as well as possible reasons for incomparability of estimates across and within the surveys.
Download a PDF of the Comparing Federal Government Surveys Brief.
Last year’s brief with data from 2019, and certain 2018 data, can be accessed here.
Blog & News

Understanding the New CPS Processing System and New 2018 Health Insurance Coverage Estimates
November 01, 2022:On Tuesday, September 10th, the U.S. Census Bureau released estimates of income, poverty, and health insurance coverage for 2018 from two large-scale federal data surveys conducted annually and administered by the Bureau: the American Community Survey (ACS) and the Current Population Survey Annual Social and Economic Supplement (CPS ASEC). The CPS ASEC is a key source of data on poverty, health insurance coverage, health status, and medical out-of-pocket spending, in addition to a range of other economic and demographic characteristics for the United States population. For information on the ACS estimates see the recently published blog, “National Uninsurance Increased alongside Eight States; Three States Saw Decreases.”
The 2019 CPS ASEC (2018 calendar year estimates) is the first release of a “Production File” to feature a new data processing system that takes into account changes made to the health insurance questions in the 2014 CPS ASEC redesign. Changes include the addition of new variables related to types of coverage that a person held at the time of interview, Marketplace coverage, and sub-annual coverage.[1] For a detailed discussion of these changes, please see several papers produced by the Census Bureau that are available here. This blog briefly discusses the implication of the new processing system on the ability to trend estimates of health insurance coverage.
According to Census, health insurance estimates created using the new processing system should not be compared with estimates produced using the old processing system.1 Currently, the Census Bureau has released three files that that were produced using the new processing system: the 2017 CPS ASEC Research File, the 2018 CPS ASEC Bridge File, and the 2019 CPS ASEC Production File. The Census Bureau publication released this past week—“Health Insurance Coverage in the United States, 2018”—compares the calendar year 2018 health insurance estimates from the 2019 CPS ASEC Production File with the calendar year 2017 estimates from the 2018 Bridge File because both of these files use the new processing system.
The table below illustrates the importance of distinguishing between estimates of health insurance coverage produced by the old versus the new processing system.
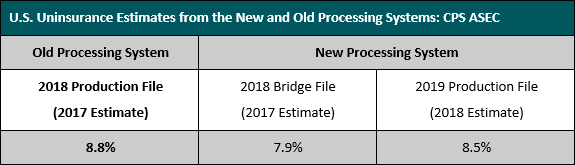
Sources: The uninsurance estimates are from “Health Insurance Coverage in the United States, 2018” and “Health Insurance Coverage in the United States, 2017”.
For example, when comparing estimates of the 2017 national uninsured rate, the old processing system (2018 Production File) produces an estimate of 8.8 percent, while the new processing system (2018 Bridge File) produces an estimate of 7.9 percent, nearly a whole percentage point lower. When examining changes in the uninsured rate between 2017 and 2018, the Census Bureau uses the 2017 estimate from the 2018 Bridge File (7.9 percent), created using the new processing system, to compare against the 2018 estimate from the 2019 Production File (8.5 percent), also created using the new processing system.
Using only estimates from data produced by the new processing system thus allows for a true apples-to-apples comparison.
[1] Notes.
New variables: The Research and Bridge Files and the 2019 CPS ASEC contain several additional variables based on new content added to the survey, including variables related to Marketplace-purchased individual coverage (i.e., if coverage was purchased from Marketplace and if the individual received a tax subsidy), concurrent coverage, and variables based on alternative definitions of medical out-of-pocket expenditures.
Sub-annual coverage: Sub-annual coverage variables (i.e., if a person was covered for none, some, or all of the previous calendar year) are available for any coverage, private coverage, government coverage, and Medicaid coverage. Sub-annual coverage data are used to determine if a person had any coverage during the calendar year. Berchick, E.R., Barnett, J.C., and Upton, R.D. (2019). Health Insurance Coverage in the United States, 2018 [Report P60-267]. Retrieved from https://www.census.gov/content/dam/Census/library/publications/2019/demo/p60-267.pdf
Blog & News
Updated Health Insurance Coverage Estimates Available for All U.S. Counties
January 14, 2019:SHADAC tables of state and county uninsurance estimates for 2013 to 2017 are now available via clickable map. Users can click a state to access a table of 5-year uninsurance estimates for each state as a whole, as well as all counties located within, using data from the American Community Survey (ACS).
 Data Background
The 5-year ACS is created by pooling together five years of ACS data to produce estimates for areas and subgroups with smaller populations. With the 5-year pooled data, estimates are available even for counties with a population below 65,000 (for which estimates are not available with just a single year of ACS data).
Publication
State and County Coverage Estimates, 2013-2017 ACS
Use this clickable map to see health insurance coverage estimates for each state and all counties for the pooled years 2013-2017.
Counties are searchable by bookmark in each state file.
2013-2017 American Community Survey (ACS) 5-Year Estimates:
Percent Uninsured, Total Civilian Noninstitutionalized Population by County
Click here to view estimates for Puerto Rico by municipio.
Click here to view a 50-state table of estimates.
These estimates come from the 5-year American Community Survey (ACS) via the U.S. Census Bureau’s American FactFinder (AFF) tool. The 5-year ACS is created by pooling together five years of ACS data to produce estimates for areas and subgroups with smaller populations.
About the ACS
The ACS is a household survey that began in 2005 and produces annually updated data on a variety of population characteristics, including health insurance coverage. In total, the ACS surveys approximately three million US households each year. An important feature of the ACS is that it includes a large enough sample for state‐level and sub‐state estimates.
The Census Bureau publishes 1-year estimates for areas with populations of 65,000 or more and 5-year estimates (covering 60 months) for all statistical, legal, and administrative entities.
The ACS began asking survey respondents about health insurance coverage during the 2008 calendar year. Specifically, the survey asks respondents about current coverage for each person in the respondent’s household. A person is categorized as “insured” if he or she has coverage at the point in time at which the survey is administered.
How Are these Estimates Different from the Estimates that SHADAC Publishes Using Census Bureau Micro-Data Files?
Two definitions used by the Census Bureau to generate the tabulations above differ from those that SHADAC uses to generate tabulations for State Health Compare. The definitional differences are as follows:
Family
- The Census Bureau defines a family as all related people in a household.
- SHADAC defines a family using a measure called the “Health Insurance Unit” (HIU), which includes all individuals who would likely be considered a family unit in determining eligibility for either private or public coverage.
- To learn more about the HIU, see SHADAC Brief #27, “Defining Family for Studies of Health Insurance Coverage.”
Family Income
- The Census Bureau determines family income as a percentage of the Federal Poverty Level (FPL), which is a definition of poverty used primarily for statistical purposes. For example, FPL is used to estimate the number of Americans living in poverty each year.
- SHADAC determines family income as a percentage of the U.S. Department of Health and Human Services’ Federal Poverty Guidelines (FPG), which is a measure used for administrative purposes. For example, FPG is used to determine eligibility for federal programs such as Medicaid and the Supplemental Nutrition Assistance Program (SNAP).
- To learn more about the difference between FPL and FPG, click here.