Blog & News
State Health Compare Adds New Social Determinants Measure: Percent of Children with Adverse Childhood Experiences
September 14, 2020:A new State Health Compare measure examines the prevalence and degree of adverse childhood experiences (ACEs) among different demographic groups, with estimates available across the states and over time.
What are ACEs?
The Centers for Disease Control and Prevention (CDC) defines ACEs as “potentially traumatic events that occur in childhood (0-17 years)” including experiencing violence, abuse, or neglect; witnessing violence in the home or community; or having a family member attempt or die by suicide. ACEs also include “aspects of the child’s environment that can undermine their sense
of safety, stability, and bonding,” such growing up in a household with substance misuse, mental health problems, and instability due to parental separation or household members being in jail or prison.i
Why are ACEs Important?
A landmark study conducted in the 1990s found a significant relationship between the number of ACEs an individual experienced and a variety of negative outcomes in adulthood, including poor physical and mental health, substance abuse, and risky behaviors (e.g., smoking, having a history of sexually transmitted disease/infection, etc.). The more ACEs an individual experienced, the greater the risk of these outcomes.ii Because ACEs are common, with about 61% of adults reporting at least one type of ACE and nearly one in six reporting four or more types of ACEs, preventing ACEs
could reduce a large number of negative physical and behavioral health outcomes.iii
How Can We Prevent ACEs?
Creating and sustaining safe, stable, nurturing relationships and environments for children and families can prevent ACEs.iv Data on the prevalence and severity of ACEs among different groups can help policymakers and public health professionals target prevention efforts effectively so that resources are efficiently leveraged to support these relationships and environments where they are most needed.
What Can We Learn from the State Health Compare Estimates?
The ACEs estimates presented in State Health Compare indicate the percent of children with no ACEs, the percent of children with one ACE, and the percent of children with multiple ACEs. Breakdowns are available by age, insurance coverage type, education, poverty level, and race/ethnicity. Available time periods are the two-year pooled periods of 2016-2017 and 2017-2018
Children with ACEs: Data Highlights
Nationwide, an estimated 18.6% of all children (age 0-17) had multiple ACEs in 2017-2018, 23.3% had one ACE, and 58.2% had zero ACEs. The following section takes a quick dive into the percentages of children with multiple ACEs to highlight some of the subgroup analyses that are available using State Health Compare.
Percent of Children with Multiple ACEs: By Age Group
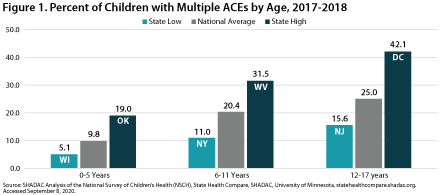
Figure 1 shows the national rates of children with multiple ACEs and state high and low rates for different age groups of children, with rates tending to be higher among older children and lower among younger children. Overall, the lowest percentage of children with multiple ACEs by age was 5.1% among 0-5 year-olds in Wisconsin, and the highest percentage was 42.1% among 12-17 year-olds in the District of Columbia (DC).
Percent of Children with Multiple ACEs: By Race/Ethnicity
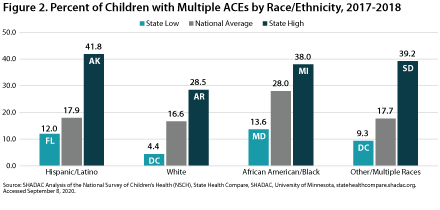
 Figure 2 shows the national rates and state high and low rates for children with multiple ACEs by race/ethnicity in 2017-2018. When examining the national rate of children with multiple ACEs by race/ethnicity, as well as state-level highs and lows for this measure, White children consistently ranked at the bottom, with the lowest percentage being 4.4% among White children living in DC. The highest nation- wide percentage of children with multiple ACEs by race/ethnicity was among African American/Black children, of whom 28% had more than one ACE. The highest state-level percentage was 41.8% among Hispanic/Latino children living in Alaska.
Percent of Children with Multiple ACEs: By Insurance Coverage Type
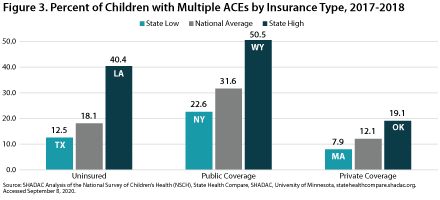
 Figure 3 shows the percentage of children with two or more ACEs according to insurance status in 2017-2018. Nationwide, the highest proportion of children reporting multiple ACEs was among those with public coverage, at 31.6 percent. This is more than 2.5 times the nationwide low of 12.1 percent among children with private coverage. At the state level, a low of 7.9 percent of privately insured children in Massachusetts reported multiple ACEs, versus a high of 50.5 percent of publicly insured children in Wyoming.
Percent of Children with Multiple ACEs: By Poverty Level
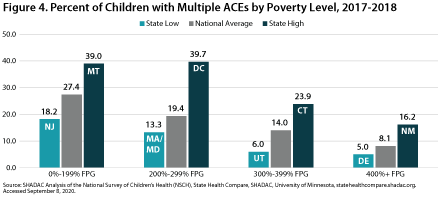
 Figure 4 shows the prevalence of multiple ACEs by poverty level in 2017-2018. The national percentage of children who had multiple ACEs by poverty level was highest among children at 0 to 199 FPG at 27.4 percent. This proportion was lowest among children in household with incomes at or above 400 percent of the Federal Poverty Guideline (FPG) at 8.1 percent—a 19.3 percentage-point difference from the rate for high-income children. At the state level, the highest percentages of children with multiple ACES by poverty level were 39.7 percent among children at 200 to 299 percent FPG living in DC and 39.0 percent among children at 0 to 199 percent FPG living in Montana. The state low for multiple
ACEs by poverty level was 5.0 percent among children at
or above 400 percent FPG living in Delaware.
Learn More
To explore State Health Compare’s ACEs estimates further, visit State Health Compare at statehealthcompare.shadac.org and click on “Explore Data.”
Other social and economic factors that can be explored through State Health Compare include:
i Centers for Disease Control and Prevention (CDC). (April 2020). “Preventing Adverse Childhood Experiences.” Available at https://www.cdc.gov/violenceprevention/acestudy/fastfact.html?CDC_AA_refVal=https%3A%2F%2Fwww.cdc.gov%2Fviolenceprevention%2Fchildabuseandneglect%2Faces%2Ffastfact.html
ii Felitti, V.J., Anda, R.F., Nordenberg, D., Edwards, B.A., Koss, M.P., Marks, J.S. (May 1998). “Relationship of Childhood Abuse and Household Dysfunction to Many of the Leading Causes of Death in Adults.” American Journal of Preventive Medicine 14(4): 245-258. DOI: 10.1016/S0749-3797(98)00017-8.
iii Centers for Disease Control and Prevention (CDC). (April 2020). “Preventing Adverse Childhood Experiences.” Available at https://www.cdc.gov/violenceprevention/acestudy/fastfact.html?CDC_AA_refVal=https%3A%2F%2Fwww.cdc.gov%2Fviolenceprevention%2Fchildabuseandneglect%2Faces%2Ffastfact.html
iv Ibid.


