Blog & News
SHADAC Researcher Colin Planalp Talks Trends in the Opioid Crisis with the University of Minnesota
March 25, 2019:In a recent interview with the University of Minnesota, SHADAC researcher Colin Planalp provided an overview of recent trends in the nation's evolving opioid crisis, discussing the growth in opioid overdose deaths since 2000, and how Minnesota’s statistics on opioid overdoses compare with the rest of the country.
Story highlights include:
- From 2000-2011 the national opioid overdose death rate nearly quadrupled from 1.0 to 3.7 deaths per 100,000, driven primarily by overdose deaths from natural and semi-synthetic prescription opioid painkillers.
- In 2011, the growth in the death rate from prescription opioid painkillers began to slow, but overdose deaths from illicit drugs began to rise sharply.
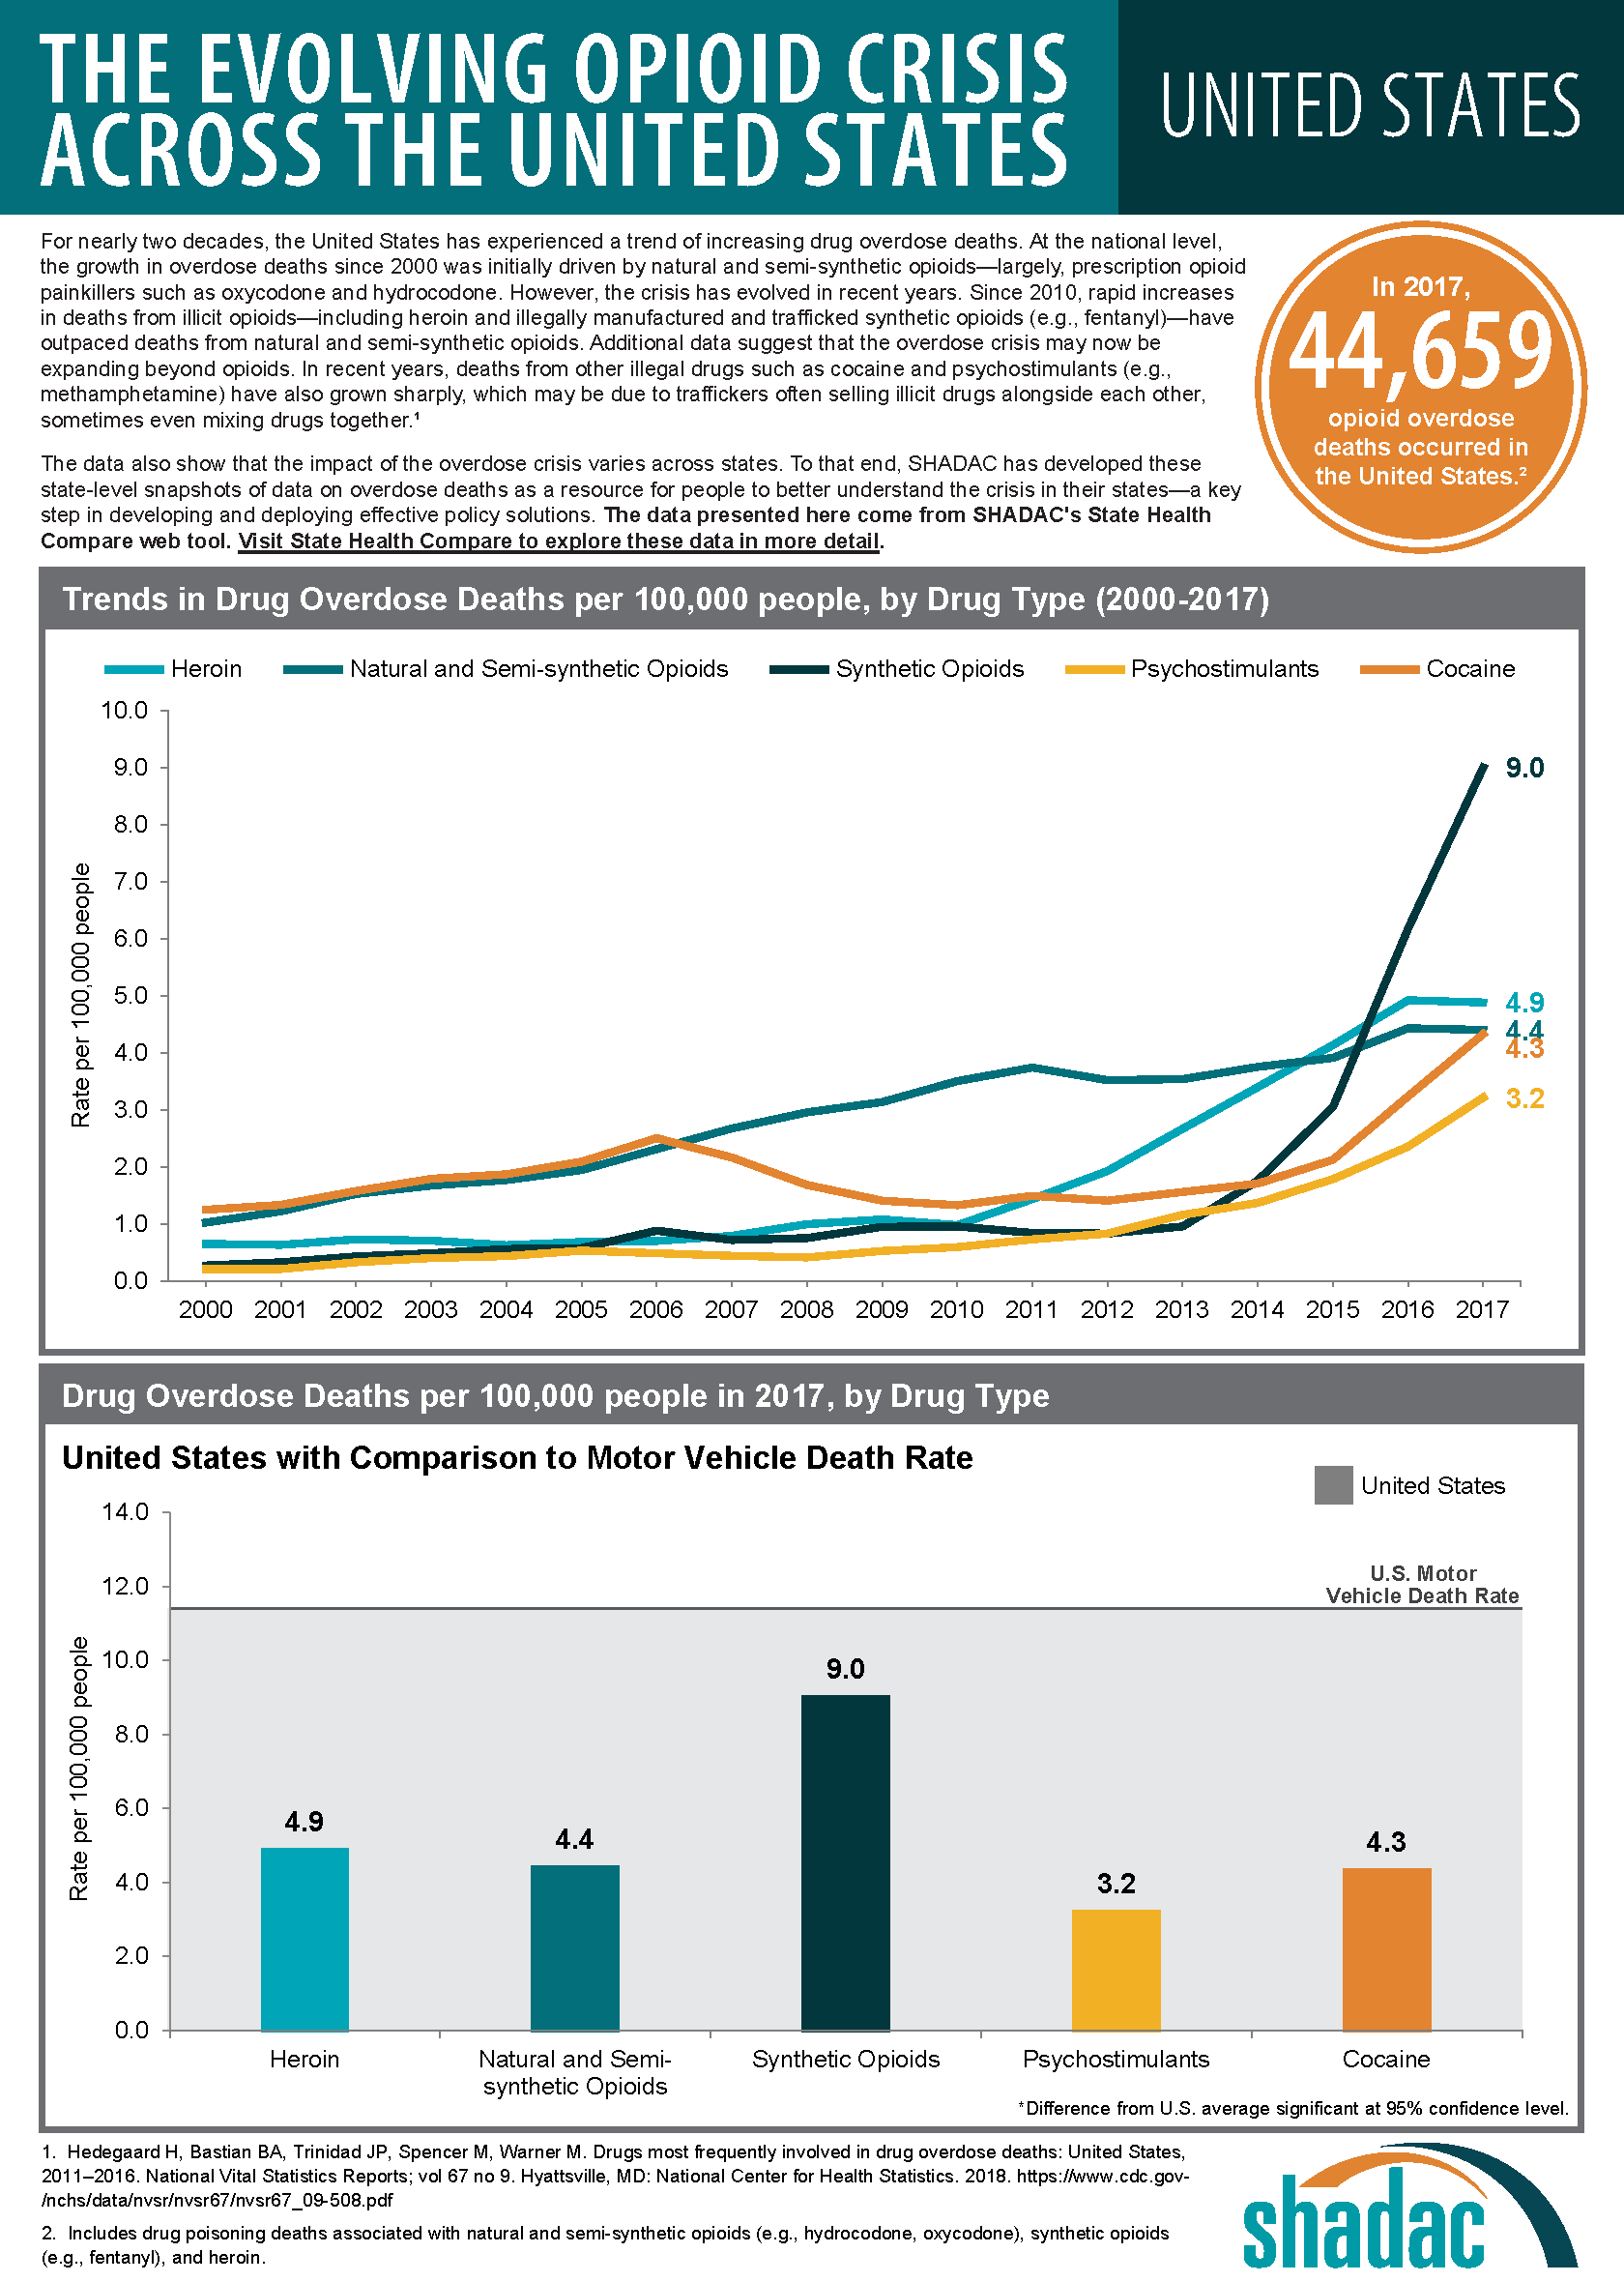
- In 2017, the U.S. death rate from synthetic opioids was 9.0 per 100,000 people — nearly twice the rate from heroin (4.9) and more than twice the rate from prescription opioid painkillers (4.4).
- Minnesota has lower opioid overdose death rates than the national average, but the state has followed the general trend in opioid overdose deaths, with steady growth in death rates from prescription opioids since 2000, and rapid growth in overdose death rates from heroin and synthetic opioids since 2010.
Mr. Planalp also discussed SHADAC's ongoing efforts to track data on overdose deaths, noting that recent data signal a potential expansion of the opioid crisis beyond synthetic, natural, and semi-synthetic opioids to include cocaine and methamphetamine.
Read the full interview here, and for more on the opioid overdose data referenced in the interview, visit SHADAC’s State Health Compare.
Suggested Further Reading
New Data on Drug Overdose Deaths Highlight the Need for State-level Analysis
Blog & News
NHIS: Nationwide Uninsured Rate for January to September 2018 Unchanged from 2017
February 27, 2019:Nationwide, the uninsurance rate among non-elderly adults (ages 18-64) in the first three quarters of 2018 was 13.0%, statistically unchanged from 12.7% in the same period in 2017.
This finding is based on new health insurance coverage estimates for Q1-Q3 2018 from the National Health Interview Survey (NHIS). These estimates were released by the National Center for Health Statistics (NCHS) as part of the NHIS Early Release Program and are the first available coverage estimates for 2018 from a federal survey.
Uninsurance and Public and Private Coverage Rates Remained Stable for Nearly All Groups in 2018
The new NHIS estimates show that uninsurance rates, as well as rates of public and private coverage, were statistically unchanged across age, race/ethnicity, and most income groups between the first three quarters of 2017 and the first three quarters of 2018. Figure 1 shows levels of health insurance coverage by type among non-elderly adults overall across this time period.

Changes in Coverage Type among Some Subgroups
Among non-elderly adults with incomes below 100% of the federal poverty level (FPL), the rate of private coverage fell to 19.9% in the first three quarters of 2018 from 25.6% in the first three quarters of 2017 (Figure 2). The rates of uninsurance and public coverage among this group remained statistically unchanged over the same period.

Non-elderly adults with incomes between 100% and 138% FPL also saw a change in coverage type, with uninsurance among this group increasing from 68.7% in the first three quarters of 2017 to 73.6% in the first three quarters of 2018. The rates of private and public coverage among this group remained statistically unchanged over the same period.
Increase in Uninsurance in the Midwest Region
The rate of uninsurance among non-elderly adults in the Midwest[1] increased from 9.5% in the first three quarters of 2017 to 11.0% in the first three quarters of 2018 (Figure 3). This change was larger among non-elderly adults in the East North Central[2] region, a subset of the Midwest region, where uninsurance increased from 8.9 % to 10.6% over the same period. No other coverage changes occurred in the Midwest region over this period, and no other regions experienced a significant change in coverage type.
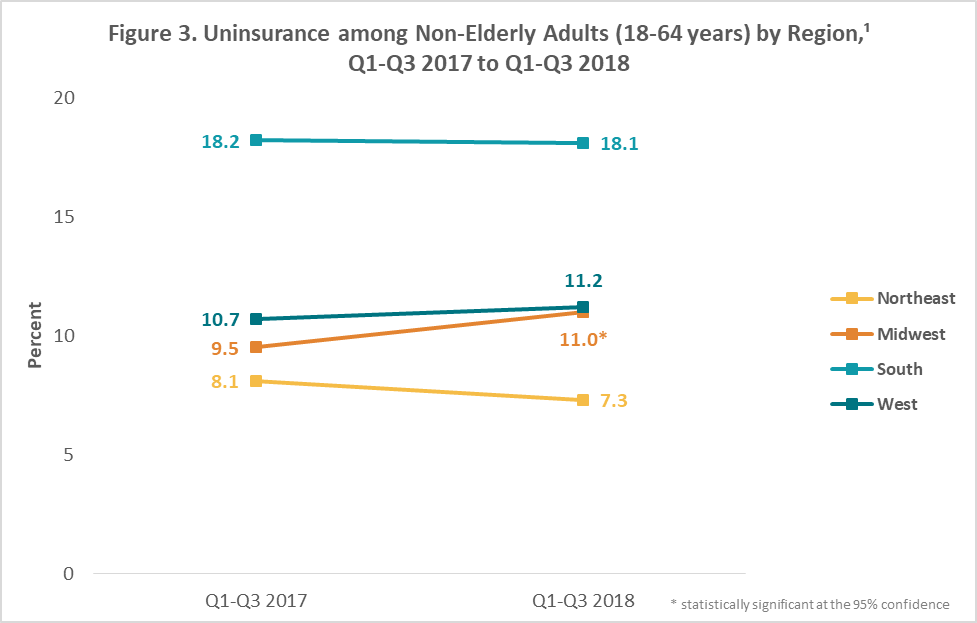
Note: No state-level coverage estimates were released for the first three quarters of 2018, although NCHS released 11 state-level estimates for the same period of 2017 and 38 state-level estimates for the same period of 2016. Detailed Regions were the lowest level of geography for which estimates were released for the January through September 2018 Early Release report.
About the Numbers
The above estimates provide a point-in-time measure of health insurance coverage, indicating the percent of persons with that type of coverage at the time of the interview. The 2018 estimates are for the months of January to September 2018 and are based on a sample of 61,484 persons from the civilian noninstitutionalized population.
Differences described in this post are statistically significant at the 95% confidence level unless otherwise specified.
For more information about the early 2018 NHIS health insurance coverage estimates, read the National Center for Health Statistics brief.
Citation
Terlizzi, EP, Cohen, RA, & Martinez, ME. February 27, 2019. “Health Insurance Coverage: Early Release Estimates from the National Health Interview Survey, January–September 2018.” National Center for Health Statistics: National Health Interview Survey Early Release Program. Available at https://www.cdc.gov/nchs/data/nhis/earlyrelease/Insur201902.pdf.
[1] The Midwest region includes Illinois, Indiana, Iowa, Kansas, Michigan, Minnesota, Missouri, Nebraska, North Dakota, Ohio, South Dakota, and Wisconsin; the Northeast region includes Connecticut, Maine, Massachusetts, New Hampshire, New Jersey, New York, Pennsylvania, Rhode Island, and Vermont; the South region includes Alabama, Arkansas, Delaware, District of Columbia, Florida, Georgia Kentucky, Louisiana, Maryland, Mississippi, North Carolina, Oklahoma, South Carolina, Tennessee, Texas, Virginia, and West Virginia;
and the West region includes Alaska, Arizona, California, Colorado, Hawaii, Idaho, Montana, Nevada, New Mexico, Oregon, Utah, Washington, and Wyoming.
[2] The East North Central region includes Illinois, Indiana, Michigan, Ohio, and Wisconsin.
Blog & News
A State-level Measure of Drug Affordability on State Health Compare: Made Changes to Medical Drugs Because of Cost
February 25, 2019:Americans spend more on prescription medications per capita than residents of any other nation due to higher U.S. drug prices. In 2016, prescription drugs accounted for an estimated 14.1 percent of total national health care costs, or $471 billion. [1],[2] The high prices of prescription drugs have captured current national attention, with both the Trump Administration and congressional lawmakers proposing a number of solutions to the issue.
State Health Compare: Americans Are Making Changes to Their Medical Drugs Due to Cost
|
SHADAC’s State Health Compare measure “Made Changes to Medical Drugs” is produced using the National Health Interview Survey (NHIS), for which State Health Compare is the only source of state-level estimates, providing a unique way to see how the cost of prescriptions and other medical drugs affects Americans’ ability to afford these medications across and within states. |
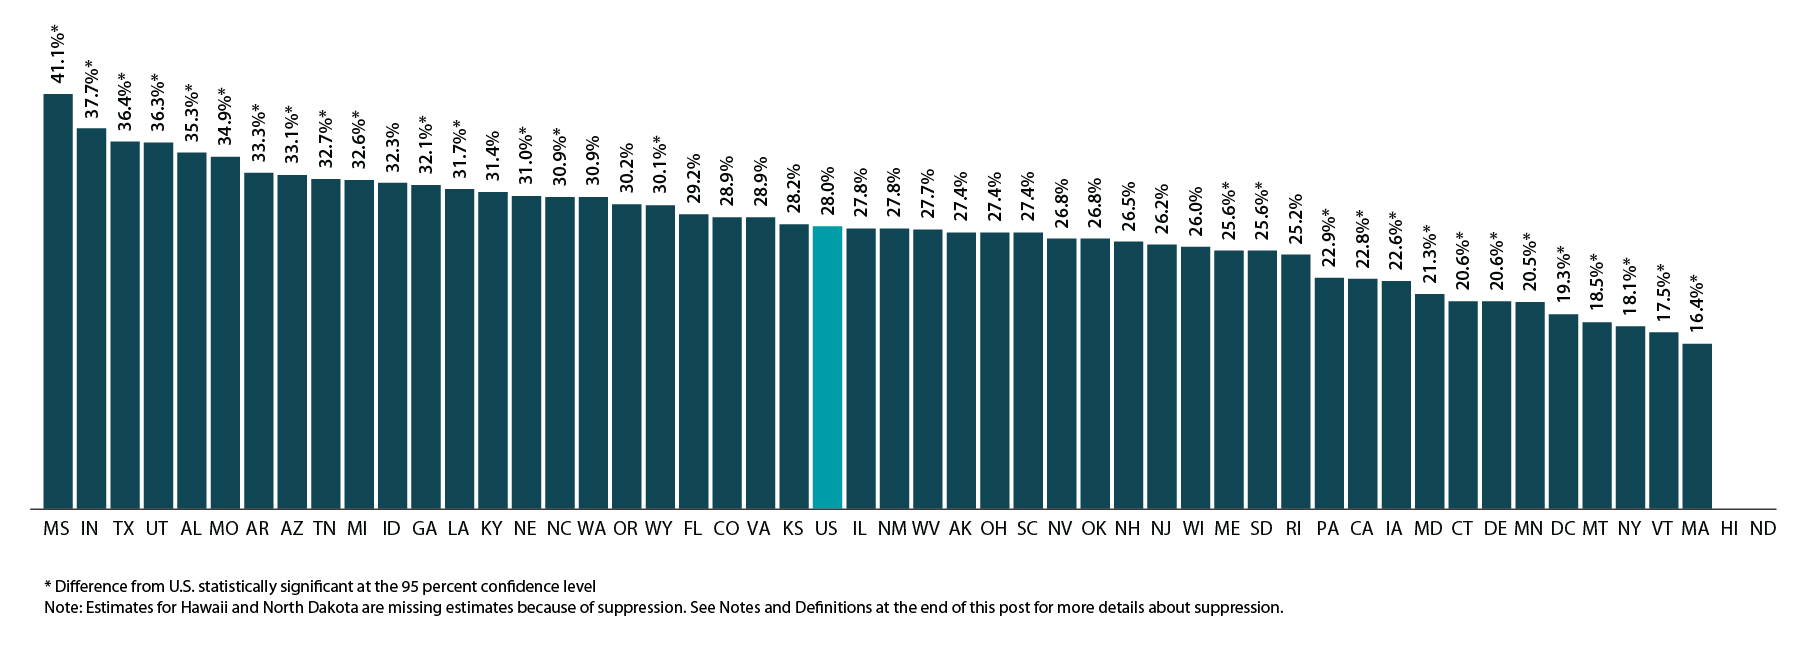
According to estimates from SHADAC’s State Health Compare, many Americans are making changes to their medical drugs in response to rising drug prices. In 2016, 28.0% of non-elderly adults (ages 19-64) said that due to cost they asked their doctor for cheaper medications, delayed refills, took less medication than prescribed, skipped doses, used alternative therapies, and/or bought medications out of the country.
The percentage of the U.S. population that made changes to drugs due to cost has been relatively stable over time at the national level, but there are substantial differences by state and significant disparities exist between age groups and types of insurance coverage.
MADE CHANGES TO MEDICAL DRUGS: HIGHLIGHTED ESTIMATES
There are significant differences by state in cost-related drug changes
As shown in the figure below, there is substantial state variation in the percent of non-elderly adults who report making changes to medical drugs due to cost, ranging from 16.4% in Massachusetts to 41.1% in Mississippi, a gap of 24.7 percentage points.
Percent of Non-elderly Adults Who Made Changes to Medical Drugs Because of Cost by State, 2016
Elderly adults were less likely to make changes to drugs due to cost
At the national level, elderly adults (age 65 and older) were less likely to report having made changes to their medical drugs due to cost relative to non-elderly adults (ages 18 to 64) at 22.7% vs. 28.0%, respectively. This difference may be related to the near-universal coverage of elderly adults through the Medicare program (though Medicare has limited drug coverage) compared to the relatively high rates of uninsurance among the non-elderly adult population. The discrepancy could also be due to differences in the resources that individuals in these two age groups have available to pay for drugs.
At the state level, there are large, statistically significant differences between elderly and non-elderly adults in the percentage of each group that made changes to medical drugs due to cost, as shown in the figure below. These differences range from a high of 13.1 percentage points in New Mexico (27.8% for those ages 19-64 vs. 14.7% for those ages 65+) to a low of 1.2 percentage points in Louisiana (31.7% for those ages 19-64 vs. 30.5% for those ages 65+) and Washington (30.9% for those ages 19-64 vs. 29.7% for those ages 65+).
Percent Who Made Changes to Medical Drugs Because of Cost by State and Age, 2016
Those with health insurance are less likely to have made changes to drugs due to cost
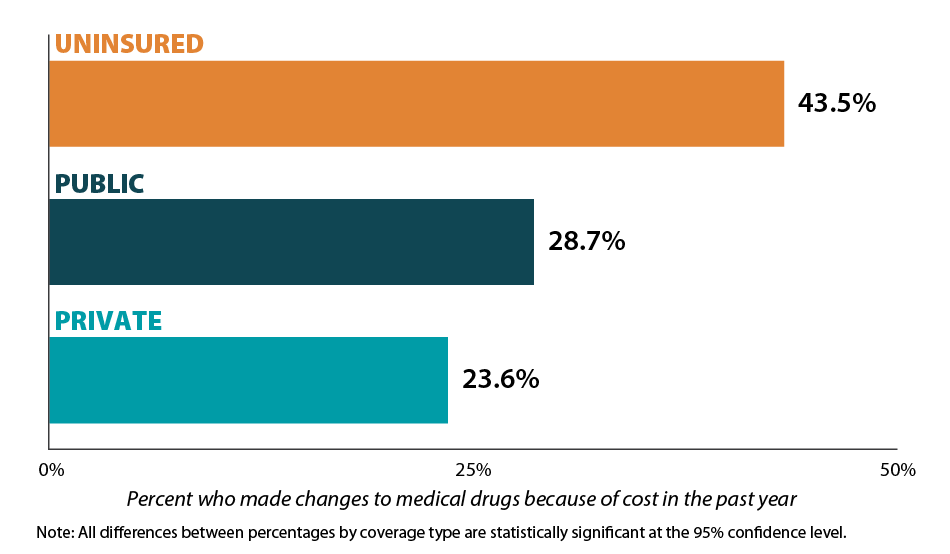
Individuals with health insurance coverage were less likely to have made changes to medical drugs due to cost compared with uninsured individuals in 2016. At the national level, the share of the population that reported making changes to medical drugs due to cost was 23.6% for non-elderly adults with private coverage, 28.7% for non-elderly adults with public coverage, and 43.5% for non-elderly adults with no coverage. This represents a gap of 19.9 percentage points between private coverage and no coverage.[3]
Percent Who Made Changes to Medical Drugs Because of Cost by Coverage Type, 2016
Notes and Definitions
Made Changes to Medical Drugs is defined as the rate of individuals who made changes to medical drugs because of cost during the past twelve months by age for the civilian non-institutionalized population. This includes asking the doctor for cheaper medications, delaying refills, taking less medication than prescribed, skipping dosages, using alternative therapies, and/or buying medications out of the country.
The source of the estimates is SHADAC analysis of NHIS data, National Center for Health Statistics (NCHS). The NHIS sample is drawn from the Integrated Health Interview Survey (IHIS, MN Population Center and SHADAC). Data were analyzed at the University of Minnesota's Census Research Data Center because state identifiers were needed to produce results and these variables were restricted.
Estimates were created using the NHIS survey weights, which are calibrated to the total U.S. Civilian non-institutionalized population for estimates broken down by age, and to the civilian non-institutionalized population age 18 to 64 for estimates broken down by coverage type.
Though SHADAC goes to great effort to produce as many state-level estimates as possible for our measures, due to sample size restrictions many state estimates of this measure are suppressed when broken down by coverage type. Namely, estimates are suppressed if the number of sample cases was too small or the estimate had a relative standard error greater than 30 percent. Among those with private coverage, 46 state estimates are available; among those with public coverage, 7 state estimates are available; and among the uninsured, 2 state estimates are available.
Other State Health Compare estimates that use data from the NHIS
Made Changes to Medical Drugs is one of eight State Health Compare measures that SHADAC produces using data from the NHIS listed below. State Health Compare is the only source for state-level estimates of these measures.
- Made Changes to Medical Drugs
- Trouble Paying Medical Bills
- No Trouble Finding Doctor
- Told that Provider Accepts Insurance
- Had Usual Source of Medical Care
- Had General Doctor or Provider Visit
- Had Emergency Department Visit
- Spent the Night in a Hospital
[1] Roehing, C. May 2018. Projections of the Prescription Drug Share of National Health Expenditures Including Non-Retail. Altarum Report. Available at: https://altarum.org/sites/default/files/uploaded-publication-files/Projections_of_the_Prescription_Drug_Share_of_National_Health_Expenditures_June_2018.pdf
Blog & News
SHADAC Releases 50-State Analysis of the Evolving Opioid Crisis (Infographics)
February 11, 2019:Much of the attention paid to the national opioid crisis in recent years has focused on the national toll of the crisis, such as the more than 44,000 opioid overdose deaths reported nationally in 2017.[1] However, the dynamics of the crisis vary widely across states, both in the prevalence of opioid overdose deaths and the types of opioids associated with those deaths.
To make state-specific information on opioid overdose deaths more easily accessible, SHADAC has used estimates from our State Health Compare online data tool to create a set of two-page infographics for all 50 states and the District of Columbia that include new data on drug overdose deaths for 2017.
Additionally, because of growing concern and evidence that the opioid crisis may be expanding to other non-opioid illicit drugs, we also have included data on drug overdose deaths from two types of drugs that are commonly involved in opioid overdoses: cocaine and psychostimulants (such as methamphetamine). [2],[3]
HIGHLIGHTS
Background: U.S. trends in drug overdose deaths
At the national level, data on opioid overdose deaths show multiple, evolving phases of the overdose epidemic. From 2000 to approximately 2011, the growth in opioid overdose deaths was driven primarily by natural and semi-synthetic opioids (i.e., prescription opioid painkillers); but that death rate has since largely plateaued. Beginning around 2011, deaths from heroin began to increase more rapidly and were responsible for the highest overdose death rates in 2015. Since around 2013, however, deaths from synthetic opioids, such as fentanyl, have grown precipitously, and in 2017 the overdose death rate from synthetic opioids was nearly double the rate for all other drug types.
Around the same time that death rates from heroin and synthetic opioids began to increase, deaths from cocaine and psychostimulants also began to increase. Evidence suggests that this relationship is driven, at least in part, by an increase in deaths that involve multiple drugs. Since 2011, when deaths from heroin began to rise, death rates from cocaine have nearly tripled, from 1.5 per 100,000 people to 4.3 per 100,000 people in 2017; and death rates from psychostimulants have more than quadrupled, from 0.7 per 100,000 people to 3.2 per 100,000 people in 2017.
State variation in overdose deaths
Opioid Overdose Deaths
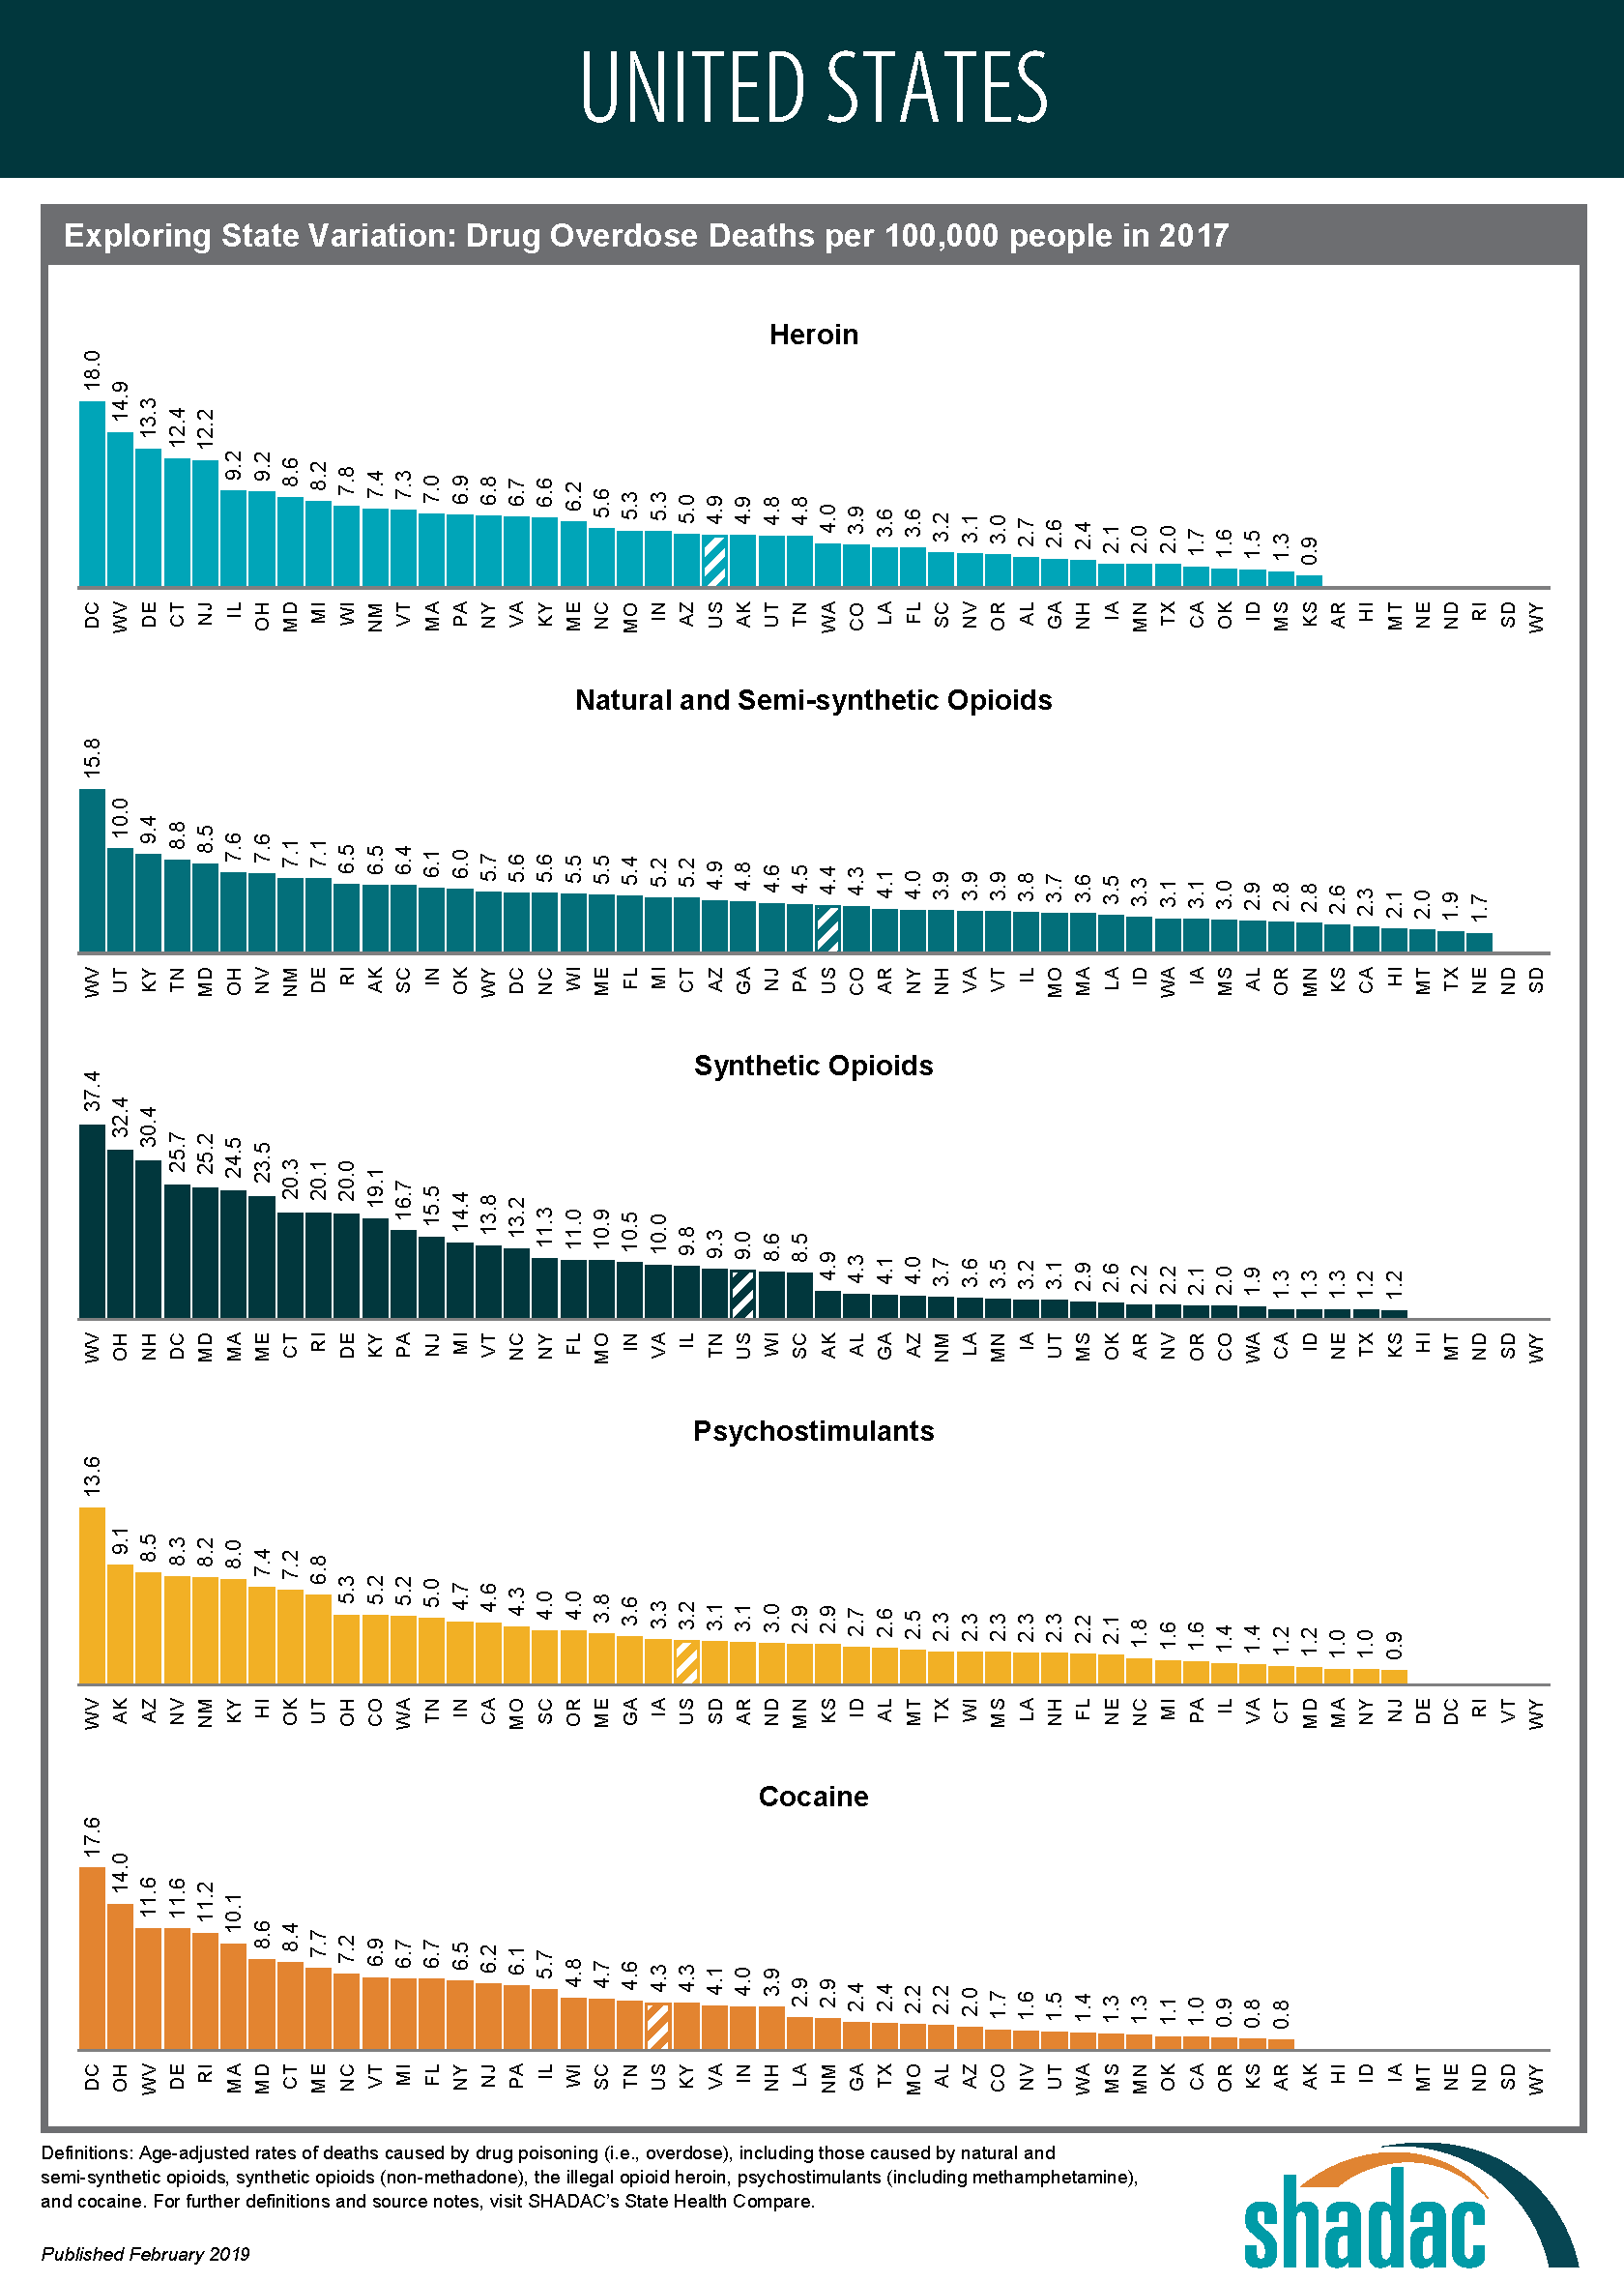
Although most states have experienced measurable increases in opioid overdose deaths since 2000, the scale of the crisis has varied widely across states. For example, West Virginia’s rate of deaths from synthetic opioids in 2017 was more than 30 times the rate of Nebraska and Texas (37.4 deaths versus 1.3 deaths per 100,000 people).
The types of opioids most commonly associated with overdoses also vary across states. For instance, Utah had the second-highest rate of deaths from natural and semi-synthetic opioids in 2017, at 10.0 deaths per 100,000 people; however, contrary to the U.S. trend, the state has experienced relatively little growth in deaths from synthetic opioids, and the state’s 2017 death rate from synthetic opioids (3.1 per 100,000 people), fell well below the U.S. rate of 9.0 per 100,000 people.
Overdose Deaths from Cocaine and Psychostimulants
The scale of overdose deaths from non-opioid illicit drugs also varies widely across states. For example, the 2017 overdose death rate from cocaine in the District of Columbia (17.6 deaths per 100,000 people) was 22 times the rate of Arkansas and Kansas (0.8 deaths per 100,000 people). Similarly, the 2017 overdose death rate from psychostimulants in West Virginia (13.6 deaths per 100,000 people) was more than 15 times the rate of 0.9 deaths per 100,000 people in New Jersey.
Regional Patterns in Drug Overdose Death Rates
Despite the evidence of state variation in drug overdose death rates, further analysis does illustrate some broader patterns:
Heroin and synthetic opioids
Death rates from heroin and synthetic opioids are generally higher east of the Mississippi River, particularly among states in the Northeast, the Appalachian region, and the industrial Midwest.
Natural and semi-synthetic opioids
Higher death rates from natural and semi-synthetic opioids are more geographically dispersed than those from heroin and synthetic opioids. While some states in the eastern U.S. have particularly high rates of deaths from natural and semi-synthetic opioids (e.g., Kentucky, Ohio, and West Virginia), there are other states in the western U.S. that also have similarly high death rates from these drugs (e.g., Utah, New Mexico, and Nevada).
Cocaine
An examination of cocaine death rates reveals a pattern similar to that of death rates from heroin and synthetic opioids, with states east of the Mississippi River exhibiting higher rates of cocaine overdose deaths.
Psychostimulants
Death rate patterns from psychostimulants appear to be almost the opposite of those for heroin and synthetic opioids, with relatively low death rates in the Northeast and particularly high rates of deaths in the western U.S. and the Southeast. Only a group of three state—Kentucky, Ohio, and West Virginia—shows strong overlaps between psychostimulant and heroin and synthetic opioid deaths.
Access the state-level infographics on drug overdose deaths.
Explore the data on drug overdose deaths on State Health Compare.
Further Reading and Resources
New Data on Drug Overdose Death Highlight the Need for State-Level Analysis
SHADAC Blog, December 2018
Exploring the New State-Level Opioid Data on SHADAC’s State Health Compare
SHADAC Webinar (Recording and Presentation Materials), September 2018
The Changing Opioid Epidemic: State Trends, 2000-2016
SHADAC Blog, August 2018
The Changing Opioid Epidemic: National Trends, 2000-2016
SHADAC Blog, July 2018
The Opioid Epidemic: National and State Trends in Opioid-Related Overdose Deaths, 2000-2016
SHADAC Issue Briefs, June 2018
[1] This number includes deaths from natural and semi-synthetic opioids (e.g., prescription opioid painkillers), heroin and synthetic opioids (e.g., fentanyl), but it excludes some opioids with relatively fewer deaths, such as methadone.
[2] Although reports of illicit drugs being tainted with synthetic opioids are relatively common, it is unclear whether deaths involving multiple drugs are typically the result of drugs being intentionally mixed by or unintentionally contaminated through traffickers’ sloppiness, or because individual drug users are concurrently abusing multiple different drugs of their own volition.
[3] U.S. Centers for Disease Control and Prevention. (2018, December 12). Drugs Most Frequently Involved in Drug Overdse Deaths: United States, 2011-2016. National Vital Stastics Report, 67(9), 1-14. Available at: https://www.cdc.gov/nchs/data/nvsr/nvsr67/nvsr67_09-508.pdf
Blog & News
State Health Compare Updated to Include 2017 Opioid-Related Overdose Data and New Data on Overdose Deaths from Other Drugs
January 18, 2019:SHADAC has recently updated our State Health Compare estimates on opioid-related drug overdose deaths to include data from 2017. Data on this measure, which examines natural and semi-synthetic opioids, synthetic opioids, and heroin, are now available for years 1999 to 2017.
We have also added new data on drug overdose deaths associated with cocaine and psychostimulants (e.g., methamphetamine), which have increased in recent years — an increase that evidence suggests may be related to the growing opioid crisis.
Users are able to view estimates for all available data years and for all five drug types at both the national and state level.
Access the updated and new estimates.
Highlights: National Trends, 1999-2017
At the national level, the opioid overdose epidemic has borne out and evolved over multiple phases since 1999. From 1999 through 2014, natural and semi-synthetic opioids (i.e., prescription painkillers) had the highest death rate among opioids. In 2015, heroin overtook prescription painkillers for a brief period with the highest death rate among opioids. But by 2016, deaths from synthetic opioids, such as fentanyl, became the foremost cause of opioid-related overdose death rates nationwide, a trend that continued in 2017.
Among overdose deaths associated with non-opioids, cocaine-related deaths have consistently exceeded those of psychostimulants at the national level since 1999, although the two overdose categories began increasing in tandem around 2013 and have continued upward since then. However, death rates from cocaine and psychostimulants have remained below opioid-related death rates since 2013.
Since 1999:
- Death rates from natural and semi-synthetic opioids (i.e., prescription painkillers) have more than quadrupled, from 1.0 per 100,000 people to 4.4 per 100,000 people in 2017.
- Death rates from synthetic opioids have grown thirty-fold, from 0.3 per 100,000 people to 9.0 per 100,000 people in 2017.
- Death rates from heroin have grown seven-fold from 0.7 per 100,000 people to 4.9 per 100,000 people in 2017.
- Death rates from cocaine have more than tripled, from 1.4 per 100,000 people to 4.3 per 100,000 people in 2017.
- Death rates from psychostimulants have grown by a factor of sixteen, from 0.2 per 100,000 people to 3.2 per 100,000 people in 2017.
Highlights: Regional and State Estimates, 2017
At the state level, both the levels of death rates and the types of drug which were the dominant causes of death varied widely in 2017. For example:
- West Virginia’s rate of deaths from synthetic opioids (e.g., fentanyl) in 2017, at 37.4 per 100,000 people, was the highest in the country and more than 30 times the rates of states such as Nebraska and Texas (1.2 per 100,000 people).
- Utah had the second-highest rates of deaths from natural and semi-synthetic opioids in 2017, at 10.0 deaths per 100,000 people; however, compared to the U.S. trend, the state has experienced relatively little growth in deaths from synthetic opioids.
- Death rates from cocaine, heroin, and synthetic opioids in 2017 were generally higher east of the Mississippi River, particularly among states in the Northeast, Appalachian region, and the industrial Midwest.
- The western U.S. and the Southeast, along with the Appalachian region, had higher rates of overdose deaths in 2017 for psychostimulants compared with the Northeast.
State variations in overdose death rates have prompted a recent shift in focus for both data analysis and public health intervention to the state level.
Explore these updated and additional estimates on State Health Compare.
Further Reading and Resources
New Data on Drug Overdose Death Highlight the Need for State-Level Analysis
The Changing Opioid Epidemic: State Trends, 2000-2016
The Changing Opioid Epidemic: National Trends, 2000-2016
The Opioid Epidemic: National and State Trends in Opioid-Related Overdose Deaths, 2000-2016 (Briefs)


