VISIT STATE HEALTH COMPARE
Publication


Sobering Statistics: Acceleration of Alcohol-Attributable Deaths Across the United States During the COVID-19 Pandemic

Alcohol has long been one of the few legal mind-altering substances in the United States. While legal, messaging around its use – and misuse – has often been mixed. Moderate levels of drinking, such as a glass of wine or beer with dinner, were once recommended as a way to promote better heart health and to help control blood sugar and cholesterol levels.1,2
Lately, however, the public health sphere has become awakened to the fact that even a small amount of alcohol can lead to negative health consequences, increasing risks for a number of chronic diseases and different types of cancer.3 These risks are even more pronounced for women who, biologically, process alcohol differently than men, and face higher odds of developing chronic health conditions, disease, and even increased risk of death from alcohol-induced causes.4,5
Using vital statistics data from the CDC’s WONDER system, a new brief from SHADAC researchers examines the concerning rise in alcohol-attributable deaths among women, which underscore larger patterns of growth seen across the U.S. We also examine differences in alcohol-attributable deaths between demographic groups, including by age, race and ethnicity, and geographic location during the COVID-19 pandemic period (2019-2022).
Key findings from our analysis of alcohol-attributable deaths during this time include:
-
While men have traditionally seen high rates of alcohol-attributable deaths, women saw a 33% increase in alcohol-attributable deaths from 2019 to 2022 – an acceleration over the 28% growth in the rates of their male counterparts.
-
Alcohol-attributable death rates for American Indian and Alaska native people, already at historic highs, surged by over 20 percentage points (from 54.0 deaths per 100,000 people in 2019 to 78.4 per 100,000 people in 2022) – well over the rate for the overall U.S. population (13.5 deaths per 100,000 people).
-
Rates also increased for people living in non-metro (i.e., rural) areas during the pandemic, rising by 36% from 14.5 per 100,000 people in 2019 to 19.6 per 100,000 people in 2022.
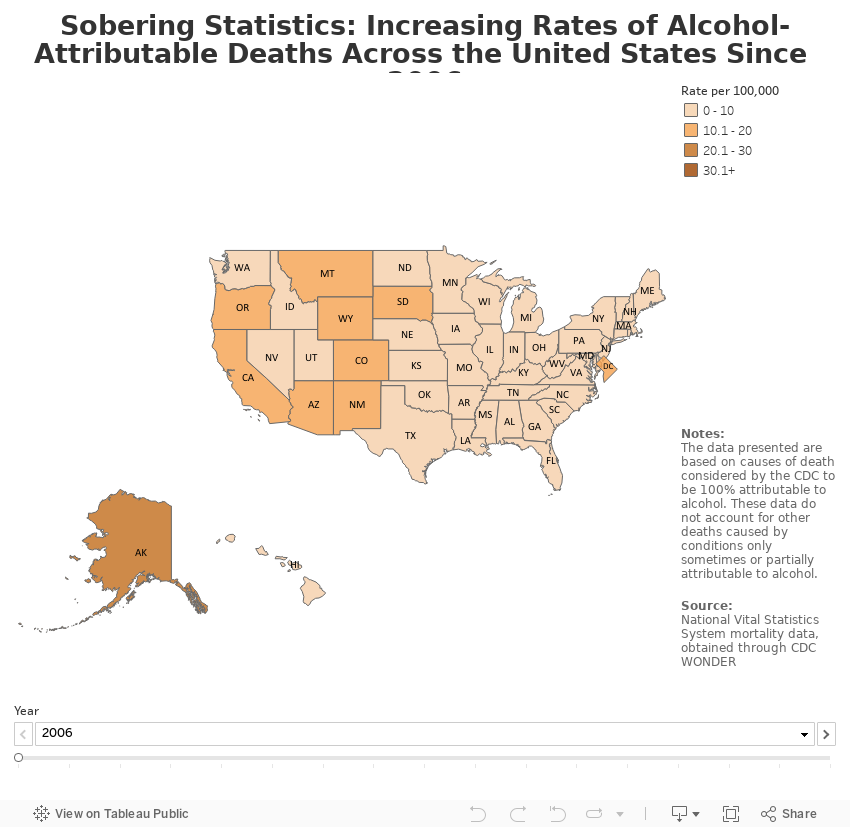
Each of these individual trends make up an alarming larger pattern of accelerating alcohol-attributable death rates reaching all the way back to 2006, the year that the data for alcohol-attributable deaths first revealed any increase. While rates for years prior to 2006 remained generally stable, rates began steadily rising from 2006 onward, growing by nearly 30% from 7.4 alcohol-attributable deaths per 100,000 people to 10.4 per 100,000 people just prior to the COVID-19 pandemic in 2019. During the pandemic, this rate grew again by 30% from 10.4 deaths per 100,000 people to 13.5 death per 100,000 in 2022 in just three years – a worrying acceleration.
To learn more about alcohol-related deaths and our analysis of these trends, read the full brief, "Sobering Statistics: Acceleration of Alcohol-Attributable Deaths Across the United States During the COVID-19 Pandemic".
SHADAC has also built an interactive map that shows rates of alcohol-attributable deaths for the U.S. and the states from 2006 to 2022 for you to explore the data yourself. Start exploring below.
Notes and Citations
1. Callahan, A. (2024, February 17). How Red Wine Lost Its Health Halo. The New York Times. https://www.nytimes.com/2024/02/17/well/eat/red-wine-heart-health.html
2. Richardson, C. (2023, February 10). Is beer healthy? How much should people drink? Medical News Today. https://www.medicalnewstoday.com/articles/is-beer-healthy
3. National Cancer Institute. (2021, July 14). Alcohol and Cancer Risk. National Institutes of Health. https://www.cancer.gov/about-cancer/causes-prevention/risk/alcohol/alcohol-fact-sheet
4. Centers for Disease Control and Prevention (2024, September 19). Sex and Gender Considerations on Alcohol Use and Health. https://www.cdc.gov/alcohol/about-alcohol-use/alcohol-and-gender-considerations.html
5. Zhao, J., Stockwell, T., Naimi, T., Churchill, S., Clay, J., & Sherk, A. (2023, March 31). Association Between Daily Alcohol Intake and Risk of All-Cause Mortality: A Systematic Review and Meta-analyses. JAMA Network Open, 6(3), e236185. doi:10.1001/jamanetworkopen.2023.6185

Blog & News
Food Insecurity in America: New Social Determinants State Health Compare Measure Tracks Percent of Households Experiencing Food Insecurity
December 16, 2024:Social determinants of health are social factors that impact an individual or community’s health. As explained by the Robert Wood Johnson Foundation, “Good health begins where we live, learn, work and play. Stable housing, quality schools, access to good jobs, and neighborhood safety are all important influences, as is culturally competent health care.”
Access to food, nutritious and varied, is also considered a social determinant of health.1 Numerous studies have shown that food insecurity, aka having limited or unstable access to food, is linked to poorer health outcomes, higher chronic disease prevalence, and overall financial hardship.
Newly added to SHADAC’s State Health Compare tool, our ‘Food Insecurity’ measure provides state-level estimates of the prevalence of household-level food insecurity by state and by a number of breakdowns. In this post, we will review a food insecurity definition, the details of SHADAC’s food insecurity measure, and some food insecurity statistics & data highlights from that measure.
What Is Food Insecurity?
As we stated earlier, a general food insecurity definition is when an individual or household has limited or unstable access to food. There are specific definitions, though, that the USDA Economic Research Service follows, which informed SHADAC’s Food Insecurity Measure on State Health Compare.
The USDA Economic Research Service defines a food insecure household as a household that, at times during the year, was “uncertain of having or unable to acquire enough food to meet the needs of all their members because they had insufficient money or other resources for food.”2
Further, a household is designated as ‘low food security’ by the USDA if they reported reduced quality, variety, or desirability of diet with little or no indication of reduced food intake; the USDA designates a household as ‘very low food security’ if they reported multiple indications of disrupted eating patterns and reduced food intake.2
The food insecurity estimates presented on State Health Compare indicate the percentage of households experiencing food insecurity defined as those experiencing either low or very low food security.
SHADAC’s Food Insecurity Measure on State Health Compare
State Health Compare is SHADAC’s online, interactive data tool providing data visualizations, tables, and data sets of state-level health estimates on a variety of measures, including measures on:
- Access to Care (e.g., Had usual source of medical care, broadband internet access, etc.)
- Cost of Care (e.g., People with high medical cost burden, forgone care, etc.)
- Health Outcomes (e.g., suicide deaths, chronic disease prevalence, etc.)
- Social and Economic Factors (e.g., adverse childhood experiences, etc.)
The new “Food Insecurity” measure falls under the ‘Social and Economic Factors’ category. Data for this measure is available for 2011 – 2022, produced using the Current Population Survey Food Security Supplement (CPS-FSS).
We have also added a number of breakdowns to this measure to allow for further analysis and disaggregation. The Food Insecurity measure is available by the following breakdowns, shown in Table 1:
Table 1. Available Breakdowns and Time Frames for Food Insecurity Measure on SHC

Accessible version of Table 1 found in "Accessible Tables" section in Conclusion.
Now that we have gone over the available data and breakdowns for this measure, let’s take a look at a few food insecurity statistics and data highlights straight from State Health Compare.
Food Insecurity in America: Data Highlights from State Health Compare
Nationwide, 11.2% of households experienced food insecurity in 2020-2022. During this same time frame, food insecurity ranged from as high as 16.6% of households in Arkansas, to as low as 6.2% of households in New Hampshire.
Food Insecurity Over Time: Vast Majority of States Have Seen Decreased Food Insecurity Rates
When we examine food insecurity over time, we can see that the vast majority of states have experienced a statistically significant decrease in food insecurity between 2011 – 2013 and 2020 – 2022.
Figure 1. Change in Percentage of Food Insecure Households by State Between 2011 and 2022
Figure 1 shows the changes in food insecurity for the full range of time available on State Health Compare. When comparing the 2020 – 2022 time frame to the 2011 – 2013 time frame, the majority of states (40) saw statistically significant decreases in the percent of households experiencing food insecurity.
The largest decrease was in North Carolina, which was down 6.6 Percentage Points (PP). The smallest statistically significant decrease was in Pennsylvania, which was down 1.8 PP.
South Carolina was the only state to experience an increase in food insecurity between these two time frames (statistically significant or not) with an increase of 0.4 PP.
Food Insecurity by Race / Ethnicity: African-American / Black Households Experienced the Highest Levels of Food Insecurity
As we saw in the previous section, most states had significant decreases in rates of food insecure households over time. However, when we break down this data by race/ethnicity, disparities in food insecurity levels are revealed.
Table 2. Five States and Racial/Ethnic Groups with the Highest and Lowest Percentages of Food Insecurity, 2020 - 2022

Accessible version of Table 2 found in "Accessible Tables" section in Conclusion.
Table 2 shows the five highest and lowest rates of insecurity for any race/ethnicity in the 2018 – 2022 time frame, which reveals that food insecurity varied greatly by race/ethnicity.
Across the country and by race, the lowest rate of food insecurity in 2018-2022 was 1.3% for White individuals in the District of Columbia, while the highest rate was 29.0% for Black individuals in North Dakota. Food insecurity prevalence was generally highest for African American/Black households, with the lowest rate of household level food insecurity for African American/Black households in any state, in Massachusetts at 14.2%, still being higher than the highest rate for White households in any state, in West Virginia at 14.1%.
Food Insecurity by Presence of Children in Household: Those with Children Experienced Higher Levels of Food Insecurity
Figure 2 presents the prevalence of household level food insecurity by presence of child in the household.
Figure 2. Change in Percentage of Food Insecure Households by State and by Presence of Children in Household Between 2020 and 2022
During the 2020 – 2022 time frame, households in almost every state that included children experienced food insecurity at higher rates than households in the same state without children.
The exceptions to this were Colorado, Connecticut, Vermont, and West Virginia, which saw more households without children experiencing food insecurity compared to those with children.
The greatest difference in food insecurity between these two groups (households with and without children) was in Delaware (11.3 PP), while the smallest difference was in Connecticut (0.3 PP).
Conclusion
As we can see just from using State Health Compare, many factors can, and do, influence levels of food insecurity. Household makeup, the state you live in, and current events in time can all impact the stability and availability of food to different populations and families. Continued research into what impacts levels of food insecurity can hopefully help us identify where supports are needed, and what kind of actions would be most effective and efficient at providing people with stable and accessible food, care, and support.
You can get started on this important research yourself by exploring and using State Health Compare. Build data tables, visualizations, and more on a number of health care and public health related measures on our simple and easy to use site.
We’d love to hear what you discover on State Health Compare – tag us on LinkedIn, or send us an email with comments or questions at shadac@umn.edu.
Notes and Citations
1. NAMI, Social Determinants of Health: Food Security
2. USDA ERS - Key Statistics & Graphic
Accessible Tables
Table 1. Available Breakdowns and Time Frames for Food Insecurity Measure on SHC
|
Breakdown |
Subgroups |
Available Time Frames |
|---|---|---|
|
Total |
N/A |
2011 – 2013 2014 – 2016 2017 – 2019 2020 – 2022 |
|
Race/ethnicity |
Hispanic/Latino White African-American/Black Asian/Pacific Islander Other/Multiple Races |
2013 – 2017 2018 – 2022 |
|
Presence of Child in Household |
Child in household No child in household |
2011 – 2013 2014 – 2016 2017 – 2019 2020 – 2022 |
Table 2. Five States and Racial/Ethnic Groups with the Highest and Lowest Percentages of Food Insecurity, 2020 - 2022
Highest Food Insecurity Prevalence by State and Race/Ethnicity
|
State |
Race/Ethnicity |
Food Insecurity Prevalence |
|---|---|---|
|
North Dakota |
African-American / Black |
29.0% |
|
Oklahoma |
African-American / Black |
28.4% |
|
Nebraska |
Hispanic / Latino |
27.5% |
|
Nebraska |
African-American / Black |
27.4% |
|
Michigan |
African-American / Black |
27.4% |
Lowest Food Insecurity Prevalence by State and Race/Ethnicity
|
State |
Race/Ethnicity |
Food Insecurity Prevalence |
|---|---|---|
|
District of Columbia |
White |
1.3% |
|
Texas |
Asian / Pacific Islander |
4.4% |
|
Illinois |
Asian / Pacific Islander |
4.5% |
|
New Jersey |
White |
4.8% |
|
Maryland |
White |
5.4% |
Blog & News

Seven Measures Have Been Retired from State Health Compare
December 10, 2024:To maintain State Health Compare (SHC) as a relevant and current resource for data users, SHADAC regularly evaluates our collection of SHC measures to ensure they inform current health care and health policy discussions. We also want to be able to update measures consistently with recent data.
As a part of this process, SHADAC both adds new measures to State Health Compare and retires existing measures if they can no longer be updated, are no longer relevant to the current moment, are little used by SHC users, or fall outside of SHADAC’s areas of focus.
To that end, SHADAC has retired seven measures from State Health Compare. The measures will continue to live at their same web addresses (URLs), but they will no longer be updated or displayed in the list of SHC measures on the Explore Data page. These seven measures that have been retired are as follows:
Blog & News

Exploring Racial Disparities in Forgone Health Care Using State Health Compare
December 03, 2024:“Forgone care” describes when someone does not use or access health care despite a need for it. While there are a number of reasons why someone might choose to forgo care (e.g., fear of medical procedures or diagnosis, lack of health literacy and/or understanding, limited access to care, cultural beliefs), a very common reason for many is the cost of health care.
Whatever the reason, forgoing or delaying care is correlated with poorer health outcomes, delayed diagnoses, and disruption in care for chronic conditions.1,2 And, unfortunately, disrupted and/or forgone care can actually increase costs for some through further complications, missed preventative treatments, and later diagnoses.
Health care costs are rising in the United States3, and the prices of many other essentials have also gone up since the pandemic.4 As costs and overall pressures on family budgets continue to rise5, it is possible that people will also be more likely to forgo health care.
SHADAC’s State Health Compare tool tracks the percentage of adults who report forgoing care due to cost using data from the Behavioral Risk Factor Surveillance System (BRFSS). In 2023, it’s estimated that 11.6% of adults could not get medical care when they needed it due to cost.
While 11.6% represents how many of all adults reported forgoing care due to cost in 2023, we can look deeper at the phenomenon of forgone care by disaggregating the data and looking at how different factors, like insurance coverage type, sexual orientation, and race / ethnicity, impact rates of forgone care.
Looking at how forgone care due to cost appears for different groups and communities can help us identify disparities that may not be clear from the aggregated data, understand how structural and/or systemic racism might impact health care decisions and outcomes, and help policymakers and others target efforts to make care more accessible.
In this blog post, we are going to explore racial disparities in forgone health care due to cost. Using SHADAC’s State Health Compare tool, we will examine forgone care data broken down by race and ethnicity. Then, we will explore racial disparities in forgone care at the state level.
National Levels of Forgone Care Higher Among Hispanic/Latino, Black, and Other/Multiple Race Adults Compared to White Adults
Using State Health Compare, we examined national levels of forgone care over time for all available race/ethnicity breakdowns: Hispanic/Latino, Black, White, and Other/Multiple Races between 2011 and 2023.
Figure 1. Percent of Adults Who Could Not Get Medical Care When Needed Due to Cost by Race/Ethnicity
Figure 1 shows that each racial / ethnic group’s forgone care follows a similar trendline. Despite similar trends, White adults consistently report the lowest rates of forgone care due to cost. While rates of forgone care due to cost have decreased for all groups compared to 2011, the racial disparities are clear and persistent.
In 2023, rates of foregone care for Black adults (12.7%) and Hispanic/Latino adults (20.1%) were statistically significantly higher than the overall rate (11.6%) and the rate for Whites (8.6%). Since 2021, the percentage of Hispanic / Latino adults who forgo care due to cost has been at least 10 percentage points (PP) higher than White adults.
Forgone Care Due to Cost Differs by State, Ranges Widen for Hispanic/Latino and Black Adults
There is considerable variation across states in the rates of forgone care by race and ethnicity. As Figure 2 shows, state by state rates of forgone care due to cost range from 4.8% of White adults in Hawaii to 30.4% of Hispanic/Latino adults in Georgia .
Figure 2 also highlights the extent to which the range of forgone care across states differs by race and ethnicity, with Hispanic/Latino adults having higher rates consistently across states. For example, the highest rate among Hispanic/Latino adults (Georgia, 30.4%), is more than double the highest rate for White adults (Tennessee, 13.6%). Similarly, the lowest rate among Hispanic/Latinos (Hawaii, 9.2%) is close to double the lowest rate for White adults (Hawaii, 4.8%).
Figure 2. Forgone Care Due to Cost for Black, Hispanic, and White Adults by State

Low Rates of Forgone Care Overall Mask Racial Disparities
Figure 3 ranks the fifty states and D.C. by overall rates of forgone care. As shown, Hawaii, Vermont, Massachusetts, Iowa, and New Hampshire have some of the lowest rates of foregone care in the country.
Figure 3. Forgone Care Due to Cost for All Adults by State
What happens when we breakdown by race / ethnicity?
Figure 4. Forgone Care Due to Cost By State and By Race / Ethnicity

*Significant difference from White
When we disaggregate the data in states with low overall rates of forgone care, racial disparities are revealed.
Let’s take Massachusetts as an example since that is a state where we have data for each group. In Massachusetts, the only group that has a rate equal to or less than the overall rate is White adults at 5.0%. All of the other racial / ethnic groups with available data have rates that are significantly higher than White adults, with Black adults having more than double (10.7%) and Hispanic/Latino adults having almost triple (14.8%) the rate of forgone care compared to White adults.
Health Equity Considerations & Conclusion
Racial disparities in health care can come in a number of forms; as seen in this blog, there are important disparities in forgone care among adults by race and ethnicity. These disparities appear in most states, even states with low overall rates of forgone care, and the disparities are even more stark in certain states. Low overall rates of forgone care can mask these racial disparities – disaggregating data and looking at differences between groups is crucial for identifying and closing gaps & health disparities.
In some circumstances in this blog , we used White as the comparison group to test for statistically significant differences across racial and ethnic groups. This was because White adults had the lowest rates of forgone care, and are, generally, the most structurally advantaged compared to the other groups.
However, we want to acknowledge that this method is not always appropriate; as Whitfield et al remarks in a study on comparing racial groups: “There is an assumption of differences, but different from what?” Continuously using White groups as the basis of comparison can perpetuate the false narrative that White is a “standard” that racial/ethnic minorities differ from, which serves to ‘other’ those minority groups instead of treating each as distinct, and varied, groups with different social, cultural, and systemic/structural influences.6
There are also equity issues related to data availability — states are much more likely to have insufficient data for Black, Hispanic/Latino, and people who identify as other/multiple races. Excluding PA and KY (both states did not have sufficient data to be included in the 2023 BRFSS public data file and are not included in the national data), data is not available for:
- Other/Multiple Race adults in two states (NC and RI)
- Hispanic/Latino adults in three states (MS, WV, and VT)
- Black adults in 11 states (HI, ID, MT, ND, NH, NM, OR, SD, WY, UT, and VT)
Improving data collection for those of minority groups on surveys like the BRFSS could help to highlight important differences between states and groups that are not visible with the current data.
Finally, we acknowledge that grouping responses in to “Other/Multiple Races” may obscure important disparities within this diverse group. Efforts are being made to improve demographic data collection, like the newly revised standards from the OMB on federal race/ethnicity data collection; improving sample size and data collection methodology are important steps towards centering health equity, making critical disparities visible to researchers, policymakers, and community members.
Continue to explore this and more data on our interactive online data tool, State Health Compare.
Notes
All statistically significant differences were based on two-sided t-tests at the 95% level of confidence, indicating that these changes were likely to reflect true changes in the population given the available data. Lack of statistically significant changes does not indicate certainty that there was no true population change, but rather that any true population change was not detectable with the available data.
These results represent rates of adults that forgo needed medical care due to cost for the civilian non-institutionalized population who are 18 years and over.
Citations
1. https://jamanetwork.com/journals/jamanetworkopen/fullarticle/2775366
2. https://pmc.ncbi.nlm.nih.gov/articles/PMC8683898/
5. https://www.census.gov/newsroom/press-releases/2024/renter-households-cost-burdened-race.html
Publication
Changing Dynamics in the Opioid Crisis Since the COVID-19 Pandemic
Soaring rates of fatal fentanyl, methamphetamine, and cocaine overdoses have worsened and spread to previously insulated groups, including teenagers and the elderly
It has been more than a decade since the U.S. Centers for Disease Control and Prevention (CDC) declared a national opioid “epidemic,” also known as the opioid crisis. In that time, hundreds of thousands of people have died, with the impact rippling out amongst friends, family, and communities: One in three U.S. adults know someone who has died of an overdose.1
Despite knowledge of this crisis and efforts to reduce fatal overdoses and impacts of substance use disorder, we have seen the opioid epidemic continually worsen and evolve. Evidence suggests that increased regulations on prescription opioids pushed many to illicit alternatives.2 The COVID-19 pandemic coincided with a huge increase in overdose deaths. Fentanyl, a once lesser-known contributor to the epidemic, has skyrocketed in its impact. Once insulated groups, like adolescents and the elderly, have seen overdose rates rise.


In this new brief from SHADAC, we examine changes in drug overdose death rates, and the types of drugs that cause these fatal overdoses, during the pandemic period (2019-2022). We also look at the history of the opioid epidemic: its beginnings, factors that influenced its evolution, and what it looks like now.
With this brief focusing on the four most common causes of drug overdoses — fentanyl, prescription opioids, methamphetamine, and cocaine — just some of the findings from this pandemic period include:
- Fatal overdoses from fentanyl increased 99%
- Fatal overdoses from methamphetamine increased 108%, and
- Fatal overdoses from cocaine increased 69%
While overdose death rates generally increased across all the measured racial and ethnic groups, “we […] found evidence of dramatic and growing disparities across racial and ethnic groups in rates of fatal overdoses, with the crisis increasingly harming American Indian and Alaska Native people and Black people during the pandemic era,” lead author and Senior Researcher Colin Planalp says.
In this brief, we explore these findings and more, including looking deeper at the impacts of the opioid crisis on different communities, demographics, and states. Click here to read the brief in full. The appendix for this piece is available here.
[1] Kennedy-Hendricks, A., Ettman, C. K., Gollust, S. E., Bandara, S. N., Abdalla, S. M., Castrucci, B. C., & Galea, S. (2024). Experience of Personal Loss Due to Drug Overdose Among US Adults. JAMA health forum, 5(5), e241262. https://pubmed.ncbi.nlm.nih.gov/38819798/
[2] Pitt, A.L., Humphreys, K., & Brandeau, M.L. (2018). Modeling Health Benefits and Harms of Public Policy Responses to the US Opioid Epidemic. American Journal of Public Health, 108(10), 1394-1400. https://ajph.aphapublications.org/doi/pdfplus/10.2105/AJPH.2018.304590