VISIT STATE HEALTH COMPARE
Blog & News
Hest, Robert
Stewart, Andrea


CPS ASEC: 2023 National Health Insurance Coverage Estimates Remain Steady for Adults but Rise for Children
September 25, 2024:
This post is a part of our Survey Data Season series where we examine data from various surveys that are released annually from the summer through early fall. Find all of the Survey Data Season series posts on our Survey Data Season 2024 page here.
Today, September 10, 2024, the U.S. Census Bureau released an initial report containing data on health insurance coverage across the United States in 2023, drawn from the Current Population Survey Annual Social and Economic Supplement (CPS ASEC). This latest issue in the long-running line of Current Population Reports did not include any state-level estimates, as the Census Bureau plans to release those data from the American Community Survey (ACS) on Thursday, September 12, 2024.
The following blog post explores changes in national-level coverage rates by demographic characteristics such as age, employment, race and ethnicity, immigration status, poverty status, and Medicaid expansion status.
Uninsured Rates Across the Nation in 2023

Overall, data from the “Health Insurance Coverage in the United States” report highlights good news for 2023: the share of the total population without health insurance coverage remained statistically unchanged from 2022 at 8.0%, representing 26.4 million people. Nonelderly adults (age 19-64) similarly did not see any statistically significant change in their uninsurance rate from 2022 (10.8%) to 2023 (10.9%).
However, the report does note that the rate of uninsurance among children (age 0-18) rose significantly to 5.8% in 2023 from 5.4% in 2022.
The overarching stability of uninsured rates in 2023 for the total U.S. population held mostly true when looking across demographic groups, as well. The data show no significant changes for uninsurance among nonelderly adults and children for all measured racial and ethnic groups and by immigration status.
There were some slight changes in uninsurance by region, with both nonelderly adults and children in the Midwest seeing rate increases from 7.2% to 8.1% for the former and from 3.3% to 4.6% for the latter. Children in the West also experienced increasing uninsured rates from 4.2% in 2022 to 5.1% in 2023.
Changes in Uninsurance by Medicaid Expansion Status and Poverty Level
The one subcategory to experience any larger changes in 2023 was uninsurance for individuals in states that have or have not expanded Medicaid.
The rate of uninsurance among nonelderly adults in Medicaid expansion states rose to 8.9% in 2023 from 8.4% in 2022. The rate among those in nonexpansion states remained statistically unchanged at 15.5%. Among children, the rate of uninsurance rose to 4.6% in expansion states (from 4.1%) and was unchanged in nonexpansion states at 8.3%.
Rate of Uninsurance for Nonelderly Adults in Expansion States by Income Level
The rate of uninsurance among nonelderly adults in expansion states with incomes between 100% and 399% of the poverty level rose to 13.3% in 2023 from 12.4% in 2022. The rate of uninsurance among nonelderly adults in expansion states was unchanged among those with incomes below 100% of the poverty level (18.7%) and among those at or above 400% of the poverty level (3.5%).
Rate of Uninsurance for Nonelderly Adults in Nonexpansion States By Income Level
The rate of uninsurance among nonelderly adults in nonexpansion states with incomes below 100% of the poverty level fell to 32.5% in 2023 from 37.9% in 2022. The rate of uninsurance among nonelderly adults in nonexpansion states was unchanged among those with incomes between 100% and 399% of the poverty level (21.4%) and at or above 400% of the poverty level (5.4%).
Public and Private Coverage Across the Nation in 2023
Among all persons, overall rates of public coverage and private coverage in 2023 remained unchanged at 36.4% and 65.4%, respectively. Much like uninsured rates, rates of public and private coverage remained steady across demographic groups by race and ethnicity, immigration status, and even mostly across Medicaid expansion status.
The only exception of note was in expansion states, which saw a decrease in rates of private coverage, falling 0.7 percentage points to 65.9% in 2023. (The rate of public coverage remained unchanged at 37.8%.)
Changes in Employment-Based, Medicaid, and Medicare Coverage
However, there was more change in coverage when looking at specific types of private and public coverage.
Within private coverage types, the rate of employment-based coverage fell 0.7 percentage points to 53.7% in 2023 while the rate of direct purchase and Marketplace coverage each increased to 10.2% (0.3 percentage point increase) and 4.0% (0.4 percentage point increase), respectively.
Within public coverage types, the rate of Medicare coverage increased 0.2 percentage points to 18.9% while the rate of Medicaid coverage was unchanged at 18.9%.

Image Text: Health Insurance Coverage by Employment Status for Nonelderly Adults in 2023: Among nonelderly adults who worked full-time, year-round, the rate of uninsurance increased to 8.9% in 2023 from 8.4% in 2022. However, the rate of uninsurance actually decreased to 12.9% from 13.8% among those who worked less than full-time, year-round. Rates were unchanged among those who did not work (14.7%) and among all workers (10.0%). There was no change in rates of either private or public coverage among all workers; those who worked full-time, year-round; those who worked less than full-time, year-round; and those who did not work.
COVID-19 Public Health Emergency, Medicaid Unwinding, and Related Impacts
Concluding the Continuous Coverage Requirement and the Medicaid Unwinding
The continuous coverage requirement that prevented states from terminating individuals’ Medicaid coverage during the COVID-19 pandemic ended on March 31, 2023. The resumption of Medicaid eligibility redeterminations and renewals (and potential disenrollments), a process commonly referred to as the “unwinding,” began on April 1, 2023 and has since ended on June 30, 2024.
Each state was given a 14-month period to navigate returning to normal operations while also meeting reporting requirements set by the Centers for Medicare & Medicaid Services (CMS), such as submitting monthly “Unwinding Data Reports,” in order to publicly share coverage transitions and outcomes data during this time. Though the unwinding period has come to a close, a May 30, 2024, State Health Official (SHO) letter announced that CMS will extend these requirements for the foreseeable future. Beginning on July 1, 2024, all states are expected to continue to submit certain metrics contained in the Unwinding Data Report, now referred to as an “Eligibility Processing Report,” on an ongoing basis.
For more information on the post-unwinding period and reporting process, see a recent blog written by SHADAC researchers for State Health & Value Strategies:
Unwinding Ends, but States’ Reporting of Medicaid Renewal Data Continues (SHVS Cross-Post)
It is important to note that full-year 2023 estimates from all surveys, including the CPS and ACS, will not be fully reflective of a Medicaid unwinding process that began mid-year. However, provisional data from sources like the Census Bureau’s Household Pulse Survey, can give us an indicator of coverage trends during this time.
If you are interested in learning more, SHADAC researchers have compiled a clear, concise, and informative data resource that can be found here:
CPS ASEC Data Collection - Response Rates and Nonresponse Bias
Continuing a trend that began in 2020 during the COVID-19 pandemic, Census Bureau researchers once again noted an issue of lower response rates for the CPS ASEC this year (67.2% in March 2024 compared to 81.5% in March 2019). While a newly published CPS companion blog from Census points out that low response rates in and of themselves are not inherently problematic, issues can arise when certain types of respondents are overrepresented in the data as compared to nonrespondents.
For example, starting in 2020, the CPS ASEC began to see more respondents with reported higher earnings than in years prior, and Census researchers have found that differences in median earnings between respondents and nonrespondents were statistically significant in each year since 2019 (2020-2024). This difference has the potential to, in turn, affect overall income and poverty estimates.
The Census Bureau has continued to monitor these issues since they first arose during the COVID-19 pandemic, and has begun to develop a number of methods to address them, including combining data from different sources to produce improved estimates of the income distribution as well as creating and employing an alternative weighting scheme.
Related Releases and Materials
ACS 2023: After Two Years of Decline, Uninsured Rates Increased for Children; Public and Private Coverage Rates See Variations Across the States
As previously mentioned, the Census Bureau released 2023 estimates from the American Community Survey (ACS) - including coverage rates at the state level - on Thursday, September 12, 2024. SHADAC has now created and released a blog post analyzing the new ACS data.
You can check for other updates on our Survey Data Season 2024 Resource Page.
Upcoming Webinar: U.S. Census Bureau Data Explained: Breaking Down 2023 Health Insurance Coverage Estimates from the ACS & CPS - featuring a Q&A with a Census Bureau Expert
On Thursday, September 26th at 1:00 PM CST, SHADAC will host a webinar covering the release of new Census data on health insurance coverage estimates for 2023. The estimates come from two key federal surveys conducted by the U.S. Census Bureau: The American Community Survey (ACS) and the Current Population Survey (CPS).
SHADAC researchers and presenters Robert Hest and Andrea Stewart will discuss the 2023 health insurance data at national and state levels, as well as by coverage type, and a range of other demographic categories (age, geography, poverty level, and more).
In addition, SHADAC will walk through how to access the data and examples of how to use it to answer research questions. We are also pleased to once again welcome a special guest from the Census Bureau, Sharon Stern, who will join us to answer questions from attendees after the presentation.

Notes
- All changes are tested at the 90% confidence level.
- All estimates come from the 2023 and 2024 Current Population Survey Annual Social and Economic Supplements, which provide data for years 2022 and 2023, respectively.
- Uninsured estimates represent individuals with no health insurance coverage for the entire calendar year.
- Estimates of health insurance coverage type represent individuals with that type of coverage at any point during the calendar year. Types of health insurance coverage are not mutually exclusive.
Blog & News
Walsh, Elliot
Liu, Grace
Social Vulnerability Index in Minnesota: Community and Uninsured Profile Interactive Map Updated with SVI, MNsure Regions, and More
July 02, 2024:SHADAC has made some exciting updates to our resource, “Minnesota’s Community and Uninsured Profile.” This profile, created with funding from the Blue Cross and Blue Shield of Minnesota Foundation, was designed to provide accessible information to policymakers and community members alike on Minnesota uninsured people and populations.
Along with updating the profile with 2022 American Community Survey data, researchers have also updated and added to the interactive map of Minnesota that allows users to visually explore the information & data, including information on Minnesotan communities' social vulnerability index. Our hope is that this update will make it even easier for people to:
- Explore the varied communities in the state
- Evaluate community needs
- Monitor equity initiatives, and
- Inform strategic planning
Let’s take a look at the major updates we’ve made to both the profile and its accompanying interactive map:
1. Social Vulnerability Index (SVI) Added to Interactive Map at the Zip Code Level
 SHADAC Researchers have added Social Vulnerability Index (SVI) ratings to the Minnesota Community and Uninsured Profile Interactive Map. What is SVI, though, and what does it mean for communities in Minnesota and beyond?
Social Vulnerability is defined by the Centers for Disease Control and Prevention (CDC) as, “the demographic and socioeconomic factors (such as poverty, lack of access to transportation, and crowded housing) that adversely affect communities that encounter hazards and other community-level stressors.” In short, it represents how vulnerable a community is to stressors, whether that’s a natural stressor (like a tornado or hurricane, for example) or human-caused (like a chemical spill, for example).
The Social Vulnerability Index (SVI) quantifies an area’s social vulnerability, assigning a numerical value that allows for comparison of different locations (counties, zip codes, etc.) to understand how different communities may respond to or be affected by hazards and stressors.
The index measures vulnerability based on four overall factors: socioeconomic status (including insurance status, educational status, housing costs, employment, poverty level), household characteristics (like age composition, English language proficiency, etc.), racial & ethnic minority status, and housing type & transportation (like multi-unit structures, mobile homes, access or lack of access to vehicle, public transit, overcrowding, etc.).
This SVI information now lives on the BCBS Minnesota Community and Uninsured Profile’s Interactive Map – users can click on each zip code area on the map revealing that area’s SVI along with other data such as rate of uninsured, population, and more. Find the map here or click on the image of the map.
2. Every Geographic Layer Now Clickable with Basic Stats
Before the latest update, users were only able to click on Zip Code Tabulation Areas (ZCTAs). Now, researchers have made it possible for users to click on various geographic layers. Along with ZCTAs, users can now click to get basic data (population, number of uninsured, and rate of uninsured) by:
- County
- Economic development region
- House district
- Senate district
- MNsure region
- And more
This allows users to view data in a larger variety of ways and view increasingly specific data in a more easily accessible way.
3. Toggle Other Relevant Factors
Researchers also updated the feature allowing users to toggle relevant indicators on the map such as:
- Native American reservation locations & names
- Hospitals
- Schools
- County seat
- And more
These relevant factors can have large impacts on that area’s overall community makeup and social vulnerability. For example, a geographic area that is close in proximity to multiple hospitals may be less socially vulnerable than a rural area that has no hospitals close by.
4. Profile Updated with Latest Available Data
Along with these key updates to the profile’s accompanying interactive map, researchers also recently updated the profile itself with 2022 American Community Survey data. Learn more about the data update in this blog post.
Start Using the Interactive Map to Learn About Minnesota’s Varied Communities
Understanding communities’ needs begins with understanding those communities and the people within them.
The Minnesota Community and Uninsured Profile was created to help people better understand the many diverse communities within the state. It provides users with important data and information that is accessible, specific, and relevant. Its accompanying interactive map puts that data and information into a clear visual space, helping users understand how geographic location impacts communities and their needs throughout the state.
Ready to learn more about the diversity of Minnesotan communities? Start exploring the interactive map here, and check out the full profile at this link.
Blog & News

Revised Childhood Vaccinations Measure on State Health Compare Shows Vaccination Rates Vary by State, Race/Ethnicity, and Insurance Coverage
January 30, 2024:Introduction
Childhood Vaccinations are an effective way to protect infants and young children from harmful diseases that can cause serious illness or death. Children are commonly vaccinated against a number of diseases, including chickenpox (Varicella), polio, hepatitis A and B, and measles, mumps, and rubella (MMR).
Despite the well-documented safety and efficacy of the vaccines, along with the endorsement of child vaccinations by the Centers for Disease Control and Prevention (CDC) and other public health authorities, rates of child vaccination lag in some portions of the United States. Monitoring trends in child vaccination rates can help explain why such gaps exist and inform efforts to improve child vaccination rates in the U.S.
A revised child vaccination measure on SHADAC’s State Health Compare (SHC) now presents annual, state-level vaccination rates for children aged 35 months, specifically the percent of those children who received the full series of recommended vaccines using data from the National Immunization Survey (NIS-Child) by survey year. This measure also presents these state-level rates by race and ethnicity, health insurance coverage type, and poverty level. In this blog post, SHADAC researchers highlight key findings from this new child vaccinations measure by race and ethnicity and type of health insurance coverage.
The Share of Children Receiving Recommended Vaccinations Has Been Relatively Stable, Though Large Variation Exists Across States
Nationally between 2017 and 2021, the share of children aged 35 months who had received the full schedule of recommended vaccinations remained relatively stable, remaining between 70% and 73% nationwide.
National Child Vaccination Rates, 2017–2021
However, while stable nationally, there was substantial state variation in the share of children who had received recommended vaccinations. For example, in 2021, the national child vaccination rate sat at 72.1%, but state-level rates ranged from as low as 56.6% in West Virginia to as high as 87.9% in Iowa. Also in 2021, six states (CT, IA, MD, MA, ND, and VT) had child vaccination rates of 80% or greater while West Virginia was the only state with a vaccination rate below 60%.
Top Five and Bottom Five State Child Vaccination Rates, 2021
| Top Five States | Iowa | 87.9% |
|---|---|---|
| Massachusetts | 85.4% | |
| Connecticut | 84.0% | |
| Vermont | 82.1% | |
| North Dakota | 81.3% | |
| United States | 72.1% | |
| Bottom Five States | West Virginia | 56.6% |
| Alaska | 61.3% | |
| Louisiana | 62.0% | |
| Arizona | 62.2% | |
| Georgia | 63.3% | |
Black Children, Hispanic/Latino Children, and Children of Other or Multiple Races Were Less Likely to Have Received Recommended Vaccinations Compared to White Children
Nationally, there were significant gaps in the share of children who had received the recommended vaccines by age 35 months by race and ethnicity.1
Non-Hispanic White children had the highest rate of vaccination at 75.5%, followed by children of multiple races or some other race (non-Hispanic) at 72.8%, Hispanic/Latino children (any race) at 69.9%, and, finally, African-American/Black children at 66.5%.
National Child Vaccination Rates by Race and Ethnicity, 2019–2021
There were also large gaps in rates of child vaccinations by race and ethnicity at the state level in 2019–2021, as shown in the table below. For example, in Michigan, African-American/Black children were nearly 30 percentage points less likely to have received the full schedule of recommended vaccinations compared to White children (49.8% vs. 79.3%). In the District of Columbia, Hispanic/Latino children were more than 20 percentage points less likely to have received the recommended vaccinations compared to White children (62.1% vs. 82.5%). And in North Dakota, children of some other race or multiple races were 20 percentage points less likely to have received the recommended vaccinations compared to White children (60.1% vs. 80.1%).
States with statistically significant gaps in child vaccination rates by race and ethnicity, 2019–2021
| State | White | African-American / Black | Hispanic / Latino | Other / Multiple Races |
|---|---|---|---|---|
| United States | 75.5% | 66.5%* | 69.9%* | 72.8%* |
| Dist. of Columbia | 82.5% | 68.1%* | 62.1%* | 70.8% |
| Georgia | 75.2% | 57.8%* | 69.8% | 70.8% |
| Illinois | 79.3% | 61.3%* | 66.9%* | 75.9% |
| Indiana | 73.1% | 66.0% | 59.1%* | 70.4% |
| Louisiana | 70.1% | 58.5%* | 69.3% | 71.9% |
| Maryland | 84.5% | 75.7%* | 71.4%* | 77.7% |
| Michigan | 79.3% | 49.8%* | 76.7% | 72.8% |
| Nevada | 76.4% | 55.8%* | 73.2% | 72.7% |
| New Jersey | 76.1% | N/A | 59.6%* | 72.2% |
| New Mexico | 76.6% | N/A | 67.7%* | 72.6% |
| New York | 69.8% | 69.0% | 67.0% | 79.5%* |
| North Dakota | 80.1% | N/A | N/A | 60.1%* |
| Oklahoma | 75.2% | N/A | 71.1% | 59.5%* |
| Rhode Island | 81.7% | N/A | 70.6%* | 83.1% |
| Tennessee | 75.9% | 49.4%* | 59.9%* | 76.6% |
| Texas | 71.0% | 61.7%* | 72.2% | 70.1% |
|
* Statistically significant difference (95% confidence level) in state estimate compared to Whites Source: SHADAC analysis of 2019–2021 NIS-Child microdata N/A indicates that data were not available or were suppressed due to statistical unreliability or small sample size |
||||
Health Insurance Coverage Matters for Rates of Child Vaccinations
Nationally, during the years 2020 through 2021, there were substantial gaps in the share of children who had received the recommended vaccinations by source of health insurance coverage. Children with private coverage alone (e.g., employer-sponsored or direct-purchase coverage) had the highest rate of vaccination coverage at 80.3%. Children with some other insurance (Children's Health Insurance Plan [CHIP] coverage, Indian Health Service [IHS] coverage, military, or some other form of insurance alone or in combination with private insurance) had a vaccination rate of 70.7%. Children with any Medicaid coverage (alone or in combination with other coverage) had a vaccination rate of 66.2%, 14 percentage points lower than private coverage. Children with no health insurance coverage (i.e., uninsured) had by far the lowest vaccination rate at 50.0%, which is more than 30 percentage points lower than children with private coverage alone.
National Child Vaccination Rates by Coverage Type, 2020–2021
That national pattern holds across the states, though due to small sample sizes, there are few available state-level estimates for children with other insurance and uninsured children. The chart below compares rates of vaccinations for children with private coverage alone and children with any Medicaid coverage. Rates of vaccinations among children with Medicaid were lowest in Alaska at 53.1% and highest in Connecticut at 81.1%. Child vaccination rates among children with Medicaid were at or below 60%in five states—AK, CO, KS, LA, and NJ—and were at or above 80% in just two states—Connecticut and Iowa. Rates of vaccinations among children with private coverage alone ranged from the lowest at 74.2% in Minnesota to the highest at 90.3% in Iowa.
In 35 states, children with any Medicaid coverage were less likely to have received recommended vaccinations compared to children with private coverage alone. Colorado had the largest percentage point gap between children with private coverage alone and any Medicaid coverage at 23.4 (82.4% vs. 59.0%), while Nebraska had the smallest gap at 1.5 percentage points (not statistically significant, 79.8% vs. 78.3%).
Data and Methods
Estimates of child vaccination rates represent the share of children aged 35 months who have received all recommended vaccinations, including the full series of DtaP, poliovirus, measles-containing, Hib, HepB, varicella, and PCV vaccines, which together provide protection against diphtheria, pertussis, tetanus, poliovirus, measles, mumps, rubella, hepatitis b, haemophilus influenza b, chicken pox, and pneumococcal infections.
Data in this post come from SHADAC’s revised Child Vaccinations measure on State Health Compare, which are based on our analysis of National Immunization Survey-Child (NIS-Child) microdata produced by the Centers for Disease Control and Prevention.
Three years of data were pooled to produce estimates by race and ethnicity; two years of data were pooled to produce estimates by coverage type. In both cases, this was done to increase sample sizes at the state level for smaller populations and to increase the number of statistically reliable state estimates. Estimates represent an average for these periods.
Note that the data source used in this analysis (NIS-Child) does not make data by more detailed race and ethnicity categories available. It is likely that these available categories conceal important differences within the aggregate groups, particularly the “some other race / multiple races” category. This group is likely to be primarily composed of children of different racial and ethnic groups in different states. Further, estimates were not available for all states for all racial and ethnic groups due to small sample sizes, even when pooling multiple data years.
Unless otherwise specified, all differences described in this analysis are statistically significant at the 95% level of significance.
1 Race lacks a genetic basis—it is socially constructed based on skin color and “apparent” physical differences. While race is socially created, it does have real social meaning and implications for health and well-being, including access to important health care services, such as vaccinations.
Publication
ACS 5-year Estimates: State and County Uninsured
Following the release of 2022 single-year estimates of health insurance coverage, household income, and poverty levels, the U.S. Census Bureau has now made available 5-year American Community Survey data files. These ACS 5 Year estimates are generated by pooling together five years of American Community Survey (ACS) data to produce estimates for areas and subgroups with smaller populations.
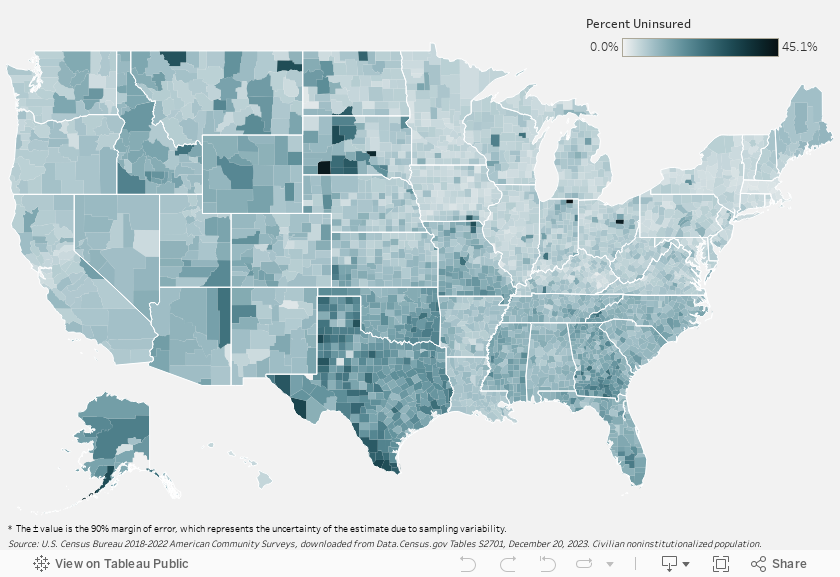
The interactive map provided below offers users the opportunity to explore health insurance coverage estimates, specifically the percentage of uninsured individuals for each state and all counties for the pooled years 2018-2022.* These data can be accessed via the Census Bureau’s data.census.gov tool. Click on a county in the map below to view state/county data tables. Counties are easily searchable through bookmarks in each state file.
2018-2022 American Community Survey (ACS) 5-Year Estimates: Percent Uninsured, Total Civilian Noninstitutionalized Population by County
Click here to view estimates for Puerto Rico by municipio.
Click here to view a 50-state table of estimates.
About the American Community Survey and ACS Data
The ACS is a household survey that began in 2005 and produces annually updated data on a variety of population characteristics, including health insurance coverage. In total, the ACS surveys approximately three million US households each year. An important feature of the ACS is that it includes a large enough sample for state‐level and sub‐state estimates. The Census Bureau provides ACS 1 year estimates and ACS 5 year estimates.
The Census Bureau publishes 1-year estimates for areas with populations of 65,000 or more and 5-year estimates (covering 60 months) for all statistical, legal, and administrative entities.
The ACS began asking survey respondents about health insurance coverage during the 2008 calendar year. Specifically, the survey asks respondents about current coverage for each person in the respondent’s household. A person is categorized as “insured” if he or she has coverage at the point in time at which the survey is administered.
*The U.S. Census Bureau has extensively cautioned against the use of single-year 2020 ACS estimates due to disruptions caused by the COVID-19 pandemic (e.g., limited means of data collection, such as shutdowns of mail operations, switches to telephone-first methodologies, etc., leading to low response rates and nonresponse bias). However, the Census Bureau believes that course corrections to address nonresponse bias, and the larger sample resulting from pooled data mean that the “data are fit for public release, government and business uses, and understanding the social and economic characteristics of the U.S. population and economy.”[1]
How Are These Estimates Different from the Estimates that SHADAC Publishes Using Census Bureau Micro-Data Files?
Two definitions used by the Census Bureau to generate the tabulations above differ from those that SHADAC uses to generate tabulations for State Health Compare. The definitional differences are as follows:
Family
The Census Bureau defines a family as “all related people in a household.”
SHADAC defines a family using a measure called the “Health Insurance Unit” (HIU), which includes all individuals who would likely be considered a family unit in determining eligibility for either private or public coverage.
To learn more about the 2020 update of SHADAC's Health Insurance Unit (HIU) see our HIU resource page, which houses two issue briefs: The first describes the SHADAC HIU, its purpose, the most recent update, and improvements to HIU data inputs; and the second outlines the impacts of using the SHADAC HIU in analysis so that researchers can assess whether the SHADAC HIU is suitable for their research and what the potential impacts of its use might be. The page also provides a link to STATA and SAS codes to aid in the use of the HIU variable.
Family Income
The Census Bureau determines family income as a percentage of the Federal Poverty Level (FPL), which is a definition of poverty used primarily for statistical purposes. For example, FPL is used to estimate the number of Americans living in poverty each year.
SHADAC determines family income as a percentage of the U.S. Department of Health and Human Services’ Federal Poverty Guideline (FPG), which is a measure used for administrative purposes. For example, FPG is used to determine eligibility for federal programs such as Medicaid and CHIP, as well as the Supplemental Nutrition Assistance Program (SNAP).
Check out our blog post from April 2023 to learn more about the difference between FPL and FPG.
Related ACS Materials:
Blog: 2022 ACS Tables: State and County Uninsured Rates, with Comparison Year 2021
[1] U.S. Census Bureau. (2022, February 7). Census Bureau Update on 2016–2020 American Community Survey (ACS) 5-Year Estimates [Press Release CB22-RTQ.01]. https://www.census.gov/newsroom/press-releases/2022/acs-5-year-estimates-update.html
Blog & News
Hest, Robert
Theis, Lindsey
Stewart, Andrea
CPS ASEC: 2022 National Health Insurance Coverage Estimates Show Falling Rates of Uninsurance and Direct-Purchase Coverage (Infographic)
September 12, 2023:
Related Releases and Materials
|
The U.S. Census Bureau has released an initial report detailing the state of health insurance coverage in the United States for 2022.
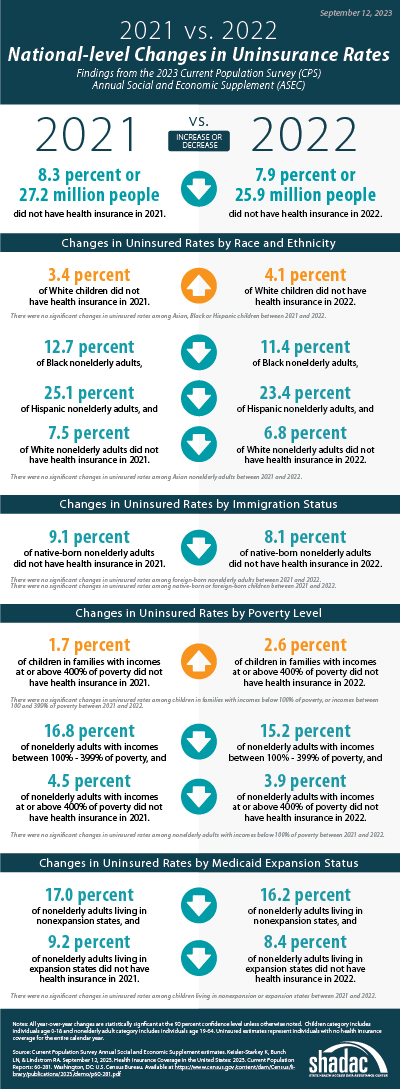
Drawing on data from the Current Population Survey Annual Social and Economic Supplement (CPS ASEC), the report highlights good news overall as the percentage of the population without health insurance coverage at any point in 2022 fell to 7.9% from 8.3% in 2021—a decrease of 0.4 percentage points or approximately 1.3 million people (25.9 million in 2022 vs. 27.2 million in 2021).
The following blog post explores changes in national-level coverage rates by demographic characteristics - such as age, employment, race and ethnicity, immigration status, poverty status, and Medicaid expansion status - for nonelderly adults (age 19-64) and for children (age 0-18). While neither group saw an overall significant change in uninsured rates, both experienced shifts across demographic subgroups.
Additionally of note, though not within the scope of this blog to explore further, elderly adults (age 65+) saw a significant increase in Medicare rates, which the Census Bureau notes is due to a larger elderly population overall, not a larger share of those adults having Medicare. The continued growth of an aging population will continue to have ramifications for a number of health-related measures, including health insurance coverage rates, and bears following in future research.
Changes in Uninsurance by Age (Nonelderly Adults age 19-64, and Children age 0-18) and Characteristics
 Among nonelderly adults, the overall rate of uninsurance fell to 10.8% in 2022, a 0.8 percentage point (PP) decrease from 2021.
Comparatively, the uninsured rate among children remained statistically unchanged from 2021 (5.0%) at 5.4% in 2022.
Race and ethnicity
In 2022, rates of uninsurance fell among nonelderly Black, Hispanic, and White adults, declining to 11.4%, 23.4%, and 6.8% (versus 12.7%, 25.1%, and 7.5%), respectively. Rates of uninsurance among nonelderly Asian adults were unchanged at 7.4%.
Similarly, while uninsurance rates remained stable for children of several racial and ethnic groups in 2022 - 4.1% for Asian children, 4.7% for Black children, and 8.6% for Hispanic children - the rate of uninsurance rose significantly among White children, increasing to 4.1% in 2022 from 3.4% in 2021.
Immigration status
The rate of uninsurance among native-born nonelderly adults fell to 8.2% in 2022 from 9.1% in 2021, while the uninsurance rate among foreign-born adults remained statistically unchanged at 22.1% in 2022 compared to 22.8% in 2021.
Rates of uninsurance were unchanged among native-born children at 4.7% in 2022 and among foreign-born children at 20.6% in 2022.
Poverty level
When examining coverage by poverty level, rates of uninsurance were unchanged at 24.2% among nonelderly adults with incomes below 100% poverty, decreased to 15.2% from 16.8% for those between 100%-399% poverty, and decreased to 3.9% from 4.5% for those living at or above 400% poverty.
In 2022, rates of uninsurance were unchanged for children in the two lower poverty level categories—8.9% for those in families with incomes below 100% poverty and 6.1% for those living in families with incomes between 100%-399% poverty. However, uninsured rates rose to 2.6% among children in families with incomes at or above 400% of poverty, an increase of 0.9 PP from 2021.
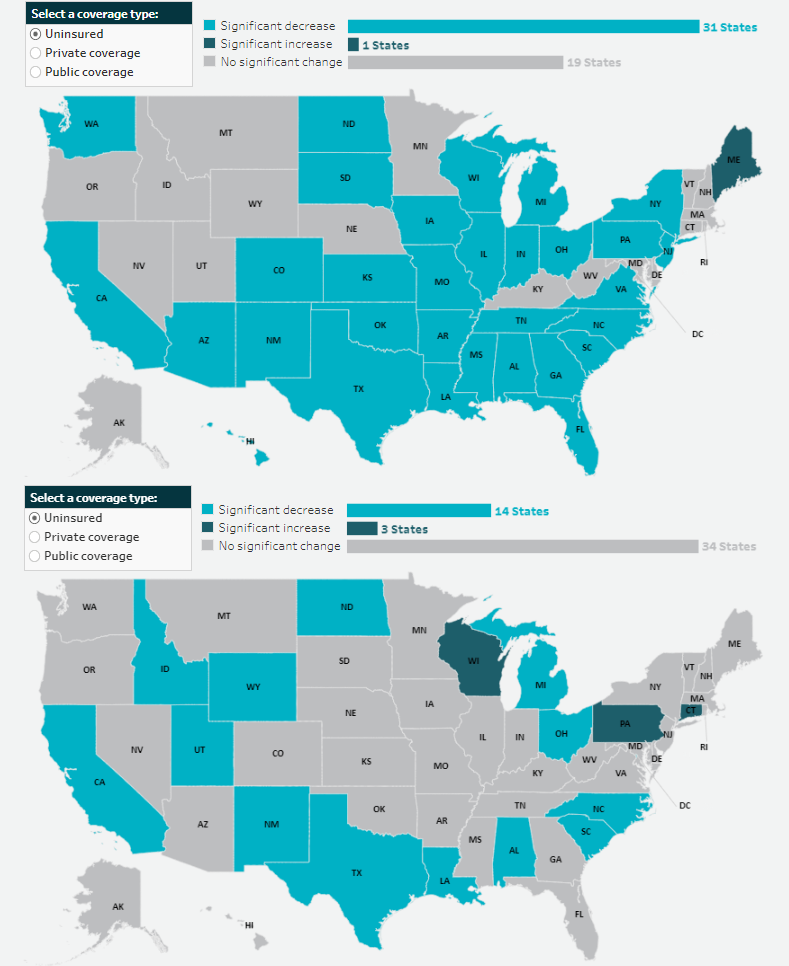
Medicaid expansion status
As of January 1, 2022, 38 states and the District of Columbia have chosen to act on the option provided by the Affordable Care Act (ACA) and expand Medicaid eligibility requirements, with the additions of Missouri and Oklahoma last year. Comparing rates of uninsurance by expansion and nonexpansion states revealed divergent trends for nonelderly adults and children.
In 2022, the uninsured rate fell to 8.4% in 2022 from 9.2% in 2021 for nonelderly adults living in expansion states and fell to 16.2% in 2022 from 17.0% in 2021 for those in nonexpansion states.
However, children in expansion and nonexpansion states saw no significant change in uninsured rates for 2022 compared to 2021 at 4.1% and 8.1%, respectively.
Notable Public and Private Coverage Changes
Among nonelderly adults, rates of public coverage and private coverage were unchanged at 19.1% and 72.9%, respectively. Rates of employer-based coverage increased to 63.5% in 2022 among nonelderly adults, up 0.6 PP from 2021. Rates of Medicare coverage fell to 3.6% among nonelderly adults in 2022, down from 3.8% in 2021.
By Race and Ethnicity (Total Population)
Rates of private and public coverage were statistically unchanged among Asian (72.2% and 27.8%, respectively) and Hispanic individuals (49.4% and 37.7%, respectively).
Among Black persons, the percentage with private coverage rose to 56.6% in 2022, up from 55.1% in 2021, and the percentage with public coverage fell to 41.2% in 2022, down from 42.7% in 2021.
Among White individuals, the percentage with private coverage fell to 72.3% in 2022, down from 73.2% in 2021, and the percentage with public coverage rose to 35.4% in 2022, up from 34.6% in 2021.
Immigration Status (Total Population)
Rates of private and public coverage were unchanged among the native-born population at 67.6% and 36.7%, respectively. Among the foreign-born population, the percent with private coverage was unchanged at 54.4% while the percentage with public coverage rose to 32.8% in 2022 from 31.7% in 2021.
Medicaid Expansion Status (Total Population)
In expansion states, the share with private coverage fell to 66.6% in 2022 from 67.1% in 2021 while the share with public coverage rose to 37.6% in 2022 from 36.9% in 2021. In nonexpansion states, the share of the population with private coverage and public coverage were unchanged at 63.6% and 32.9%, respectively.
Employment Status (Nonelderly Adults)
Public coverage rose among working nonelderly adults in 2022 to 12.6% from 11.8% in 2021 while the share with private coverage was stable at 80.0%. Public coverage rose among those who worked full-time year round and those who worked less than full-time, year round, rising to 8.9% and 23.5%, respectively. Private coverage was unchanged among these groups at 84.8% and 66.0%, respectively. Private and public coverage were unchanged among those who did not work, at 47.5% and 42.6%, respectively.
More on the insurance coverage changes among working-age adults can be found in a topically focused blog released today by the Census Bureau.
Notes
All changes are tested at the 90% confidence level.
All estimates come from the 2022 and 2023 Current Population Survey Annual Social and Economic Supplements, which provide data for years 2021 and 2022, respectively.
Uninsured estimates represent individuals with no health insurance coverage for the entire calendar year.
Estimates of health insurance coverage type represent individuals with that type of coverage at any point during the calendar year. Types of health insurance coverage are not mutually exclusive.
COVID-19 Public Health Emergency Impacts
Continuous Coverage Requirement
The continuous coverage requirement that prevented states from terminating individuals’ Medicaid coverage during the pandemic ended on March 31, 2023. The resumption of Medicaid eligibility redeterminations and renewals (and potential disenrollments), a process commonly referred to as the “unwinding,” began on April 1, 2023, and each state has a year to navigate a return to normal operations while also meeting reporting requirements set by CMS for publicly sharing coverage transitions and outcomes data during this time. While the health insurance estimates released by the US Census Bureau for 2022 precede the beginning of the unwinding process, the data will provide an essential baseline for understanding how health insurance coverage is distributed across the U.S. and among the states prior to the unwinding, as well as marker to measure the impacts of this seismic coverage transition as potentially millions of individuals, both adults and children, are poised to lose Medicaid and must either find another form of coverage (e.g., state-based marketplace or employer-sponsored insurance [ESI]), or risk becoming uninsured.
Several resources have been compiled by SHADAC to track the unwinding process in a variety of avenues, falling under several broader categories:
Guidance for States
- Using Surveys to Monitor Coverage Transitions During the Unwinding of the Medicaid Continuous Coverage Requirement
- Best Practices for Publicly Reporting State Unwinding Data
Health Insurance Coverage Data Tracking
- State-Based Marketplace Transition Data During the Unwinding
- State Dashboards to Monitor the Unwinding of the Medicaid Continuous Coverage Requirement
- Tracking Health Insurance Coverage During the Unwinding: Monthly Data from the Household Pulse Survey
Data Collection and Dissemination - Nonresponse Bias
While Census Bureau researchers have not cited any concerns with CPS ASEC data collection or release processes, an ongoing issue of persistently lower response rates and resultant nonresponse bias has been documented for the past few years, coinciding with the beginning of the COVID-19 pandemic. In March 2023 (the point in time that the CPS is administered), the response rate fell to its lowest point yet, at 68.9%, compared to a pre-pandemic rate of 82% (March 2019). This lower response rate particularly affects the CPS measures of income, and since 2020, the Census Bureau has been working to address the bias in higher reported earnings using new weighting methods to create adjusted income and poverty estimates. More detail on this methodology can be found in a companion blog released today by Census Bureau researchers.