Blog & News
Now Available on State Health Compare: Special 2020-Only Health Insurance Coverage Measure and 2020 Updates to Several BRFSS Measures
October 6, 2021:As has been previously noted, estimates for our Health Insurance Coverage Type measure will this year come from the U.S. Census Bureau’s Current Population Survey (CPS) Annual Social and Economic Supplement (ASEC), rather than the American Community Survey (ACS), due to a number of impacts on survey data and data collections efforts attributed to the COVID-19 pandemic.
In light of this, SHADAC has created a separate Health Insurance Coverage measure for 2020 data only on our State Health Compare site. Estimates for 2020 have been created specifically for that year, and should not be compared to other years of data, which come from the ACS. For more on the differences between the ACS and the CPS, see our recent blog that discusses key divergences and considerations for users of this data.
Health Insurance Coverage Type (2020)
Data for this measure show the percentage of the United States population that had a specific type of health insurance coverage (e.g., public, private, Medicaid, Medicare, etc.) at any point during the 2020 year. Estimates for uninsurance, however, represent the percent who were uninsured all year. Breakdowns for each type of coverage, as well as age and health status, are available for this measure.
State Health Compare also contains several other measures that come from the CPS ASEC, relating to cost of care.
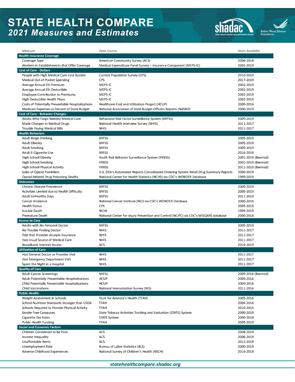
Measures that have been updated from the CPS ASEC include:
People with High Medical Care Cost Burden^
This measure counts the portion of individuals who are part of families whose out-of-pocket spending on health care accounted for more than 10 percent of their annual income. Breakdowns for this measure are available for race/ethnicity, income levels, and also employer insurance coverage. Estimates are available for three clusters of years: 2010-2012, 2013-2017, and 2017-2020.
Medical Out-of-Pocket Spending
This measure provides an estimate of the average out-of-pocket costs of health care, or costs that are not covered by health insurance but paid for out of an individual’s own resources. These costs include premiums and medical expenses not covered by their medical plan, such as copays for doctor and dentist visits, diagnostic tests, prescription medicine, glasses and contacts, and medical supplies, among others. Data are available for years 2017-2020 and can be broken down by employer health insurance coverage.
Estimates for a majority of measures from several categories (Access to Care, Cost of Care, Health Behaviors, and Health Outcomes) have now been updated from the Behavior Risk Factor Surveillance System (BRFSS), which surveys adults 18+ regarding health-related risk behaviors, chronic health conditions, and use of preventive services, and is conducted by the Centers for Disease Control and Prevention.
Measures that have been updated from the BRFSS include:
Adults Who Forgo Needed Medical Care*
The measure indicates the percent of adults (18+) in each state who could not get needed medical care due to cost. Breakdowns by education level, race/ethnicity, and also now for chronic health status, are available for all states from 2005 through 2010 and 2011 through 2020.
Adults With No Personal Doctor*
This measure presents the percent of adults without a personal doctor and is now available for all states from 2005 through 2010 and 2011 through 2020. Breakdowns by education level and race/ethnicity are also available.
Chronic Disease Prevalence*
Data for this measure captures the percent of adults who reported having one or more common chronic conditions such as diabetes, cardiovascular disease, heart attack, stroke, and asthma, in each state. Estimates are now available for all states from 2005 through 2010 and 2011 through 2019.
Adult Cancer Screening*
Estimates for this measure, which are now available for all states from 2005 through 2010 and 2011 through 2020, show the percentage of adults who have received the recommended cancer screenings.
Adult Unhealthy Days
There are a multitude of options for this measure, which shows the average number of days when an adult's physical health or mental health was not good during the past 30 days. Users can view estimates solely by reported mentally unhealthy days, physically unhealthy days, or a combination of both (which is capped at a total of 30 days). Estimates for each version of this measure are available for 2011 to 2020 and possible breakdowns include age, insurance coverage type, household income categories, disability status, education levels, and race/ethnicity.
Activities Limited due to Health Difficulty*
This measure reports the average number of days (in the last 30 days) for which an adult indicated their activity were limited stemming from either mental or physical health difficulties. Data is available for all states from 2005 through 2010 and 2011 through 2020, and can now be broken down by education level and race/ethnicity.
Adult Binge Drinking*
This measure indicates the percent of adults who have consumed at least four drinks (women) or five (men) or more on one occasion during the past 30 days. Now available for all states from 2005 through 2010 and 2011 through 2020, the measure includes breakdowns by education level and race/ethnicity.
Adult Smoking*
This measure indicates the percent of adults over 18 years of age who have smoked 100 or more cigarettes in their lifetime as well those who currently smoke at least some days or every day. Estimates are available for all states from 2005 through 2010 and 2011 through 2020, with breakdowns offered by education level and race/ethnicity.
Notes: For the measure marked with a “^”: This indicates a break in series for the CPS ASEC due to a redesign of the survey (2013) as well as the redesign of their processing system (2017). All measures marked with an “*”: This indicates a break in series due to the BRFSS implementing cell phone sampling and an advanced weighting method in 2011.


