VISIT STATE HEALTH COMPARE
Blog & News


NHIS: Early Release Estimates for January-June 2021 Show Continued Significant Changes in Public and Private Coverage across All Groups
November 22, 2021:A report of health insurance coverage estimates for the first half of 2021 (January to June) from the National Health Interview Survey (NHIS) has just been released by the National Center for Health Statistics (NCHS) as part of the NHIS Early Release Program.
Comparing the 2021 estimates to the same time period in 2020 showed broadly similar overall trends by coverage type:
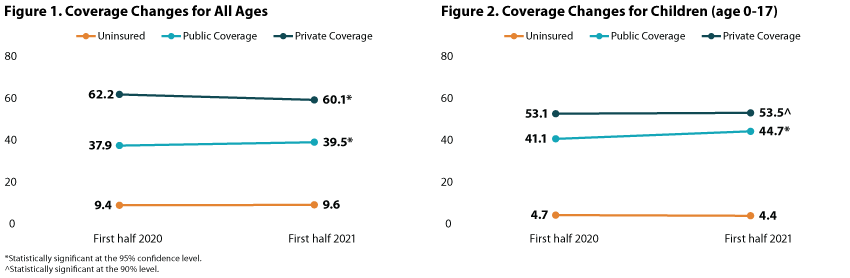
- The rate of individuals without health insurance coverage was statistically unchanged for those of all ages (9.6 percent) as well as for children age 0-17 (4.4 percent).
- The rate of individuals with public coverage increased for those of all ages to 39.5 percent from 37.9 percent, and to 44.7 percent from 41.1 percent for children age 0-17.
- The rate of individuals with private coverage decreased to 60.1 percent from 62.2 percent for those of all ages and dropped to 53.1% from 53.5% for children (age 0-17)—though this change was only statistically significant at the 90% confidence level.
Analysis of coverage trends for specific subpopulations, however, revealed larger differences among nonelderly respondents (age 0-64).
Findings by race/ethnicity
Large disparities in rates of uninsurance persisted from 2020 to 2021, with Hispanic/Latino individuals being more than twice as likely to be uninsured compared with all nonelderly individuals (23.6 percent versus 11.4 percent). Additionally, the share of nonelderly Hispanic/Latino people who were uninsured increased to 23.6 percent from 19.7 percent.
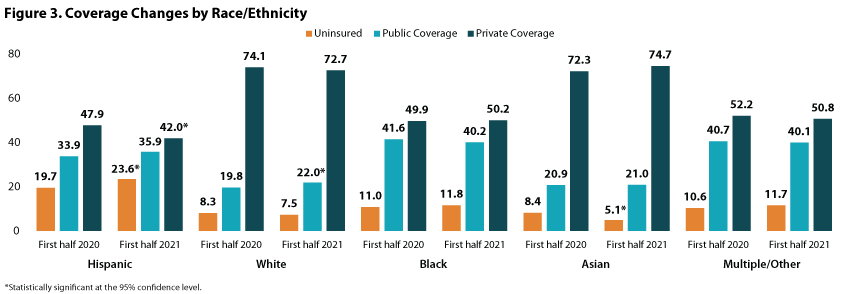
Examining uninsured rates for individuals of other races/ethnicities showed that uninsurance decreased to 5.1 percent from 8.4 percent for nonelderly Asian individuals, but was stable among White individuals, Black individuals, and persons who reported as Multiple/Other race at 7.5 percent, 11.8 percent, and 11.7 percent, respectively.
Looking at public coverage in the first half of 2021, the share of nonelderly White persons who had public coverage increased to 22.0 percent from 19.8 percent in the first half of 2020 while remaining stable among: Hispanic/Latino people (35.9 percent), Black people (40.2 percent), Asian people (21.0 percent), and those of Multiple/Other race (35.4 percent).
Conversely, the share of Hispanic/Latino nonelderly individuals with private coverage fell to 42.0percent in the first half of 2021 from 47.9 percent in the same time period of 2020. Rates of private coverage, however, were stable among White individuals (72.7 percent), Black individuals (50.2 percent), Asian individuals (74.7 percent), and individuals of Multiple/Other race (50.8 percent).
Findings by Medicaid Expansion status
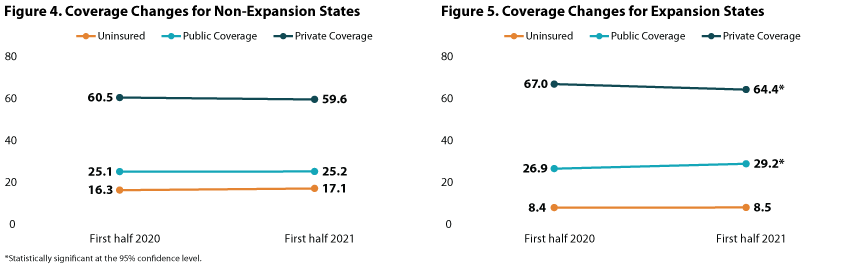
For January-June 2021, nonelderly individuals (age 0-64) living in non-expansion states were more than twice as likely to be uninsured than those living in expansion states at 17.1 percent vs. 8.5 percent—though these rates were both stable when compared with rates from January-June 2020.
In expansion states, rates of public coverage increased to 29.2 percent (from 26.9 percent) while rates of private coverage conversely decreased to 64.4 percent (from 67.0 percent). Rates of both public and private coverage remained stable in non-expansion states at 25.2 percent and 59.6 percent, respectively.
Impact of COVID-19 on NHIS 2020 and 2021 data
Though NCHS notes that data collection efforts for the 2020 NHIS were disrupted by the COVID-19 pandemic and, subsequently, estimates for April-December 2020 may have been impacted by nonresponse bias, normal survey collection and follow-up operations resumed in full by September 2020. All subsequent estimates presented in this early release report for January-June 2021 meet NCHS standards of reliability as specified in “National Center for Health Statistics data presentation standards for proportions.”1
Notes
All differences described in this analysis are statistically significant at the 95% confidence level, unless otherwise indicated.
Estimates are representative of the civilian noninstitutionalized U.S. population, and comparisons presented here are between NHIS data for January-June 2021 and January-June 2020.
1 Cohen, R.A., Martinez, M.E., Cha, A.E., & Terlizzi, E.P. (November 2021). Health insurance coverage: Early release of estimates from the National Health Interview Survey, January–June 2021. National Center for Health Statistics (NCHS). https://www.cdc.gov/nchs/data/nhis/earlyrelease/insur202111.pdf
Blog & News

2021 NHIS Early Release: Stable uninsured rate paired with increase in public coverage and decrease in private coverage
October 14, 2021:The National Center for Health Statistics (NCHS) has released quarterly estimates of health insurance coverage from January 2020-March 2021 from the National Health Interview Survey (NHIS) as part of the NHIS Early Release Program. These are some of the first estimates of health insurance coverage during 2021 from a major, federal government survey. This post compares uninsurance, private coverage, and public coverage rates in the first quarter of 2021 (Q1 2021) to those rates in the first quarter of 2020 (Q1 2020) and focuses on coverage by age group and federal poverty level (FPL).
Uninsured rates were stable among all age groups; Public and private coverage saw significant changes among all age groups
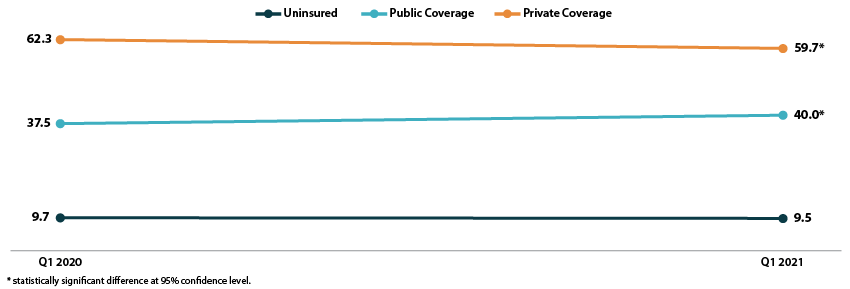
The uninsured rate remained stable in the first quarter of 2021, at an overall 9.5 percent for all ages, 11.3 percent for the non-elderly (age 0-64), 4.6 percent for children (age 0-17), and 13.8 percent for non-elderly adults (age 18-64).
All age groups except non-elderly adults saw increases in rates of public coverage. Public coverage increased 2.5 percentage points (PP) among all ages and for the non-elderly, increasing to 40.0 percent and 28.3 percent, respectively. Children saw an increase of 4.7 PP, rising to 45.6 percent with public coverage in Q1 2021.
Rates of private coverage fell 2.6 PP to 59.7 percent in Q1 2021 for those of all ages. Rates of private coverage were statistically unchanged for other specified age groups.
Figure 1. Health insurance coverage by type (all ages), Q1 2020 vs. Q1 2021
Coverage largely unchanged by poverty level
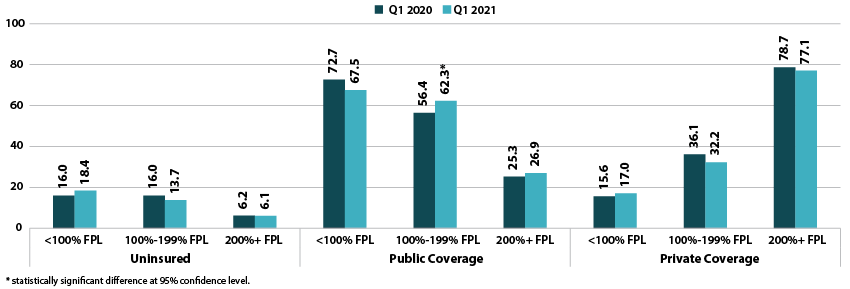
Rates of uninsurance were stable by poverty level in the first quarter of 2021. For those with incomes below 100% FPL, 18.4 percent were uninsured in Q1 2021. In other categories, 13.7 percent of those with incomes at 100%-199% FPL were uninsured, and 6.1 percent of those with incomes at or above 200% FPL were uninsured.
Rates of public coverage were statistically unchanged for those with incomes below 100% FPL (67.5 percent) and for those with incomes at or above 200% FPL (26.9 percent). Those with incomes 100%-199% FPL saw a 5.9 PP increase in rates of public coverage, rising to 62.3 percent in Q1 2021.
Rates of private coverage were stable by poverty level. Those with incomes below 100% FPL had a private coverage rate of 17.0 percent, those with incomes 100%-199% FPL had a private coverage rate of 32.2 percent, and those with incomes at or above 200% FPL had a private coverage rate of 77.1 percent.
Figure 2. Health insurance coverage by type by poverty level (all ages), Q1 2020 vs. Q1 2021
A note on changes to the NHIS data collection methodology
In response to the COVID-19 pandemic, the NHIS changed to a telephone-only and then telephone-first with in-person follow up data collection methodologies beginning on March 19, 2020. Though this did not affect the Q1 2020 estimates, NCHS’s analysis indicates that the change to telephone-only data collection led to an “over-representation of affluent households,” which may have affected the Q1 2021 estimates. More information on changes to federal survey methodology due to the COVID-19 pandemic is available in the SHADAC brief, Changes in Federal Surveys Due to and During COVID-19.
Blog & News

2020 NHIS: State vs National Estimates of Health Insurance Coverage (Infographic)
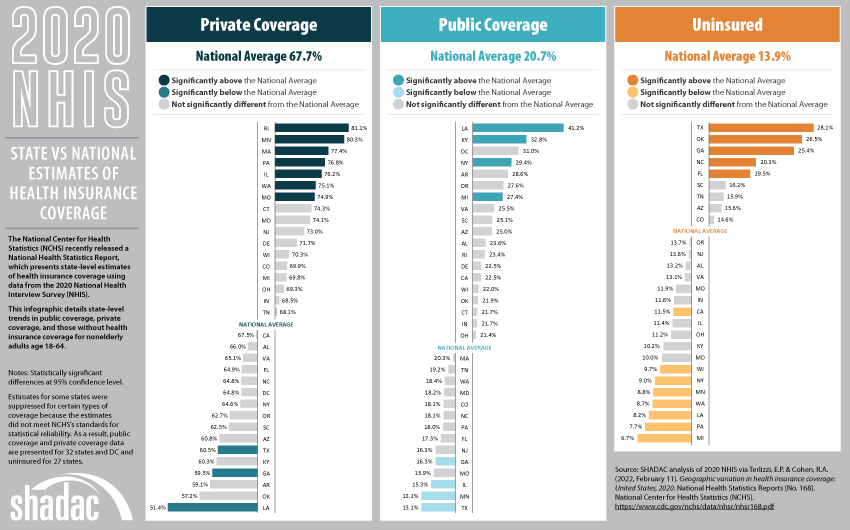
February 15, 2021:The National Center for Health Statistics (NCHS) recently released a National Health Statistics Report, which presents state-level estimates of health insurance coverage using data from the 2020 National Health Interview Survey (NHIS).
The report provides estimates by subcategories of state Medicaid expansion status, urbanization level, and expanded region based on data from all 50 states and the District of Columbia (D.C.). However, estimates for some states were suppressed for certain types of coverage and certain age groups because the estimates did not meet NCHS’s standards for statistical reliability. As a result, data are presented for 32 states and D.C. for people under age 65, adults age 18-64, and in just 16 states for children age 0-17.
Based on these estimates, SHADAC has created an infographic that details state-level trends in public coverage, private coverage, and those without health insurance coverage for nonelderly adults age 18-64. While rates of private coverage, public coverage, and uninsurance for this age group were unchanged at the national level from 2019 to 2020 (67.5% to 67.7%, 20.4% to 20.7%, and 14.5% to 13.9%, respectively), rates at the state level varied much more widely between years.
Click on the infographic below to learn more about the state-level estimates.
Blog & News
NHIS: Early Release Estimates Show Unchanged Coverage Rates during First Half of 2020, although NCHS Reports Evidence of Nonresponse Bias due to COVID-19
February 15, 2021:The National Center for Health Statistics (NCHS) has just published health insurance coverage estimates for the first half of 2020 (January to June) from the National Health Interview Survey (NHIS) as part of the NHIS Early Release Program. These estimates are some of the first available coverage estimates for 2020 from a federal survey and among the first estimates to cover the beginning of the coronavirus (COVID-19) pandemic in the United States.
Topline Estimates from January-June 2020
At a high level, the new estimates show no significant changes in coverage type or uninsured rate when compared to the same period of time in 2019. Among nonelderly adults (ages 18 to 64) surveyed between January and June 2020, 13.4% were uninsured at the time of interview, 20.8% had public coverage, and 67.9% had private coverage. These rates were 14.7%, 20.4%, and 66.8%, respectively, from January to June 2019.
Nonresponse Bias Report for April-June, 2020 (Q2)
NCHS released a report to accompany the January-June 2020 estimates that presents a preliminary analysis of a drop in response rates in Q2 2020 (April-June).
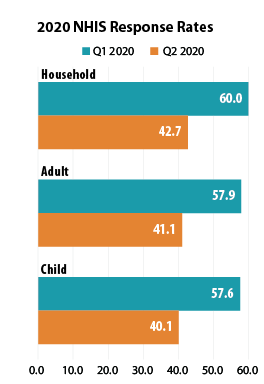 NHIS data collection, which is typically conducted by making personal visits to respondents’ homes, was significantly impacted by the COVID-19 pandemic beginning in Q2 2020: Personal visits were suspended beginning on March 19, 2020, and data was collected by telephone instead. As a result of the shift to telephone-only interviewing, the sample household response rate declined from 60.0% in Q1 (January-March) to 42.7% in Q2; the adult response rate fell from 57.9% to 41.1%; and the child response rate dropped from 57.6% to 40.1%.
NCHS researchers compared the characteristics of Q2 respondents to the characteristics of respondents from Q1 to determine whether the smaller Q2 sample was systematically biased in any way and found that lower-income and renter households were underrepresented in the Q2 sample. This points to potential nonresponse bias and to the possibility that the actual uninsured rates for Q2 2020 were higher than the NHIS early release estimates indicate, as lower-income and renter households tend to have higher rates of uninsurance than do middle- and higher-income households and home-owning households.
SHADAC will continue to monitor all subsequent early data releases for 2020 from the NHIS survey, and will provide updates on any new methodology reports such as the investigation into nonresponse bias for Q2 2020 provided by NCHS.
Notes about the Estimates
The above estimates provide a point-in-time measure of health insurance coverage, indicating the percent of persons with that type of coverage at the time of the interview.
All changes described compare January-June 2020 to January-June 2019, and are statistically significant at the 95% confidence level unless otherwise specified.
Citations
Cohen, R.A., Terlizzi, E.P., Cha, A.E., & Martinez, M.E. (2021). Health insurance coverage: Early release of estimates from the National Health Interview Survey, January–June 2020. National Center for Health Statistics (NCHS). https://www.cdc.gov/nchs/data/nhis/earlyrelease/insur202102-508.pdf
Dahlhamer, J.M., Bramlett, M.D., Maitland, A., & Blumberg, S.J. Preliminary evaluation of nonresponse bias due to the COVID-19 pandemic on National Health Interview Survey estimates, April-June 2020. National Center for Health Statistics (NCHS). https://www.cdc.gov/nchs/data/nhis/earlyrelease/nonresponse202102-508.pdf?ACSTrackingID=USCDC_374-DM49266&ACSTrackingLabel=NHIS%20Early%20Release%3A%20Non-response%20Bias&deliveryName=USCDC_374-DM49266
Publication
Comparing Federal Government Surveys That Count the Uninsured: 2020
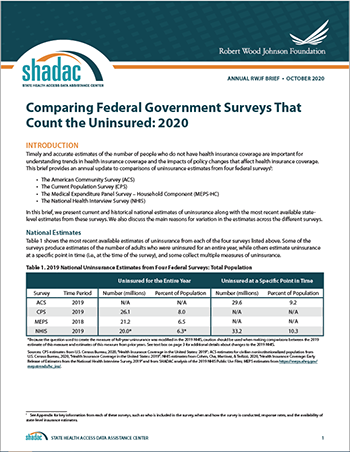 With the release of new insurance coverage estimates from surveys conducted by the U.S. Census Bureau, the Agency for Healthcare Research and Quality (AHRQ), and the Centers for Disease Control and Prevention (CDC), SHADAC has updated our annual “Comparing Federal Government Surveys that Count the Uninsured” brief.
The brief provides an annual update to comparisons of uninsurance estimates from four federal surveys:
- The American Community Survey (ACS)
- The Current Population Survey (CPS)
- The Medical Expenditure Panel Survey - Household Component (MEPS-HC)
- The National Health Interview Survey (NHIS)
In this brief, SHADAC presents current and historical national estimates of uninsurance along with the most recent available state-level estimates from these surveys. We also discuss the main reasons for variation in the estimates across the different surveys as well as possible reasons for incomparability of estimates across and within the surveys.
Download a PDF of the Comparing Federal Government Surveys Brief.
Last year’s brief with data from 2019, and certain 2018 data, can be accessed here.