VISIT STATE HEALTH COMPARE
Blog & News


Key Resources and 2022 Updates: SHADAC's Health Insurance Unit
October 2022:Updated April 2023
In the years following the passage of the Patient Protection and Affordable Care Act (ACA), SHADAC developed and introduced its Health Insurance Unit, or “HIU,” a tool to aid in defining family interrelationships in federal population surveys for the purpose of analyzing health insurance coverage.
Since the inception of this tool, SHADAC has regularly produced updated HIU variables, including in fall 2022 following the release of the 2021 American Community Survey (ACS) and 2022 Current Population Survey Annual Social and Economic Supplement (CPS ASEC). These variables were recently made available via IPUMS-CPS (October 19, 2022) and IPUMS-USA (March 10, 2023). These HIU variables use the updated HIU methodology introduced in 2020 and incorporate the latest years of survey data and federal poverty guidelines, as relevant.
What is the SHADAC HIU?
First released in 2012, one of the goals of the SHADAC HIU is to establish a common definition of a “family unit” to help ensure consistent and comparative research across major national surveys when analyzing health insurance coverage.
Most federal surveys define a “family” differently from the way it is defined by most private and public insurance programs. For instance, the definition of "family" or "household" in U.S. Census Bureau surveys includes all related members of a household, no matter the degree of relationship, and does not necessarily align with dependent coverage or public program eligibility.
The SHADAC HIU attempts to more closely align with a definition of family used for private and public health insurance coverage eligibility. The SHADAC HIU uses a narrower definition of family that looks at specific interrelationships between individuals within a household and excludes all non-dependent relatives (grandparents, adult siblings, aunts/uncles, etc.) who may be household members but are unlikely to be considered as part of the “family unit” as defined for the purposes of determining eligibility for health insurance.
The SHADAC HIU, then, is defined as an economic unit that consists of those members of a household who would likely be eligible as a group for family health insurance coverage, or whose resources (i.e., income) would be considered in determining eligibility for public coverage.
Related Resources
- Defining Family for Studies of Health Insurance Coverage (August 2021): A brief that outlines the impacts of using the SHADAC HIU in analysis—specifically, analysis showing how the population distribution of family income changes using three different definitions of family: all members in the same household (Census definition), the definition used by the IPUMS (described below), and the SHADAC HIU (described in detail in a companion brief). Researchers can use this brief to assess whether the SHADAC HIU is suitable for their analysis and what the potential impacts of its use might be.
- Stata Code (January 2021): Technical documentation of statistical code in STATA to help researchers to employ the SHADAC HIU in their own analysis using ACS microdata downloaded from IPUMS USA.
Publication
Comparing Federal Government Surveys That Count the Uninsured: 2022

With the release of new insurance coverage estimates from surveys conducted by the U.S. Census Bureau, the Agency for Healthcare Research and Quality (AHRQ), and the Centers for Disease Control and Prevention (CDC), SHADAC has updated our annual “Comparing Federal Government Surveys that Count the Uninsured” brief.
The brief provides an annual update to comparisons of uninsurance estimates from four federal surveys:
- The American Community Survey (ACS)
- The Current Population Survey (CPS)
- The Medical Expenditure Panel Survey - Household Component (MEPS-HC)
- The National Health Interview Survey (NHIS)
In this brief, SHADAC presents current and historical national estimates of uninsurance along with the most recent available state-level estimates from these surveys (where possible). We also discuss the main reasons for variation in the estimates across the different surveys as well as possible reasons for incomparability of estimates across and within the surveys.
Download a PDF of the Comparing Federal Government Surveys Brief.
Last year’s brief with data from the 2020 collection year, and certain 2019 collection-year data, can be accessed here.
Blog & News
CPS ASEC: 2021 National Health Insurance Coverage Estimates Show Falling Uninsured and Private Coverage Rates Across Population Demographics (Infographic)
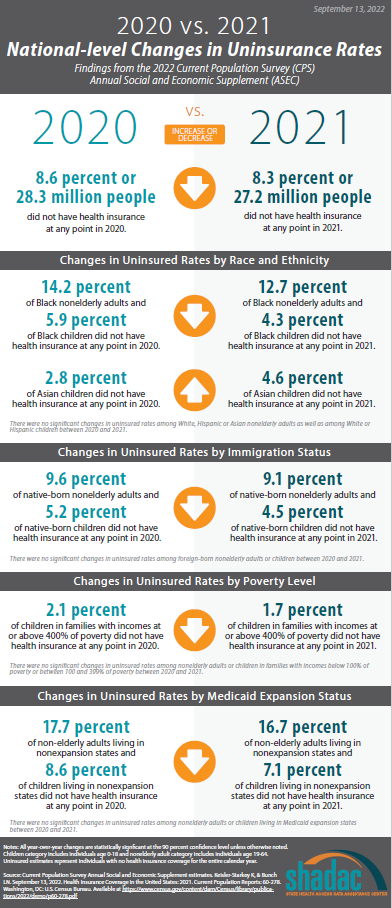
September 13, 2022:The U.S. Census Bureau has released an initial report detailing the state of health insurance coverage in the United States for 2021. Drawing on data from the Current Population Survey Annual Social and Economic Supplement (CPS ASEC), the report highlights good news overall as the percentage of the population without health insurance coverage at any point in 2021 fell to 8.3% from 8.6% in 2020—a decrease of 0.4 percentage points (PP) or approximately 1.1 million people (27.2 million in 2021 vs. 28.3 million in 2020).
While this year marks a return to a more standard release of health insurance coverage estimates after COVID-related factors impacted the release of 2020 from the CPS and, to a larger degree, the American Community Survey (ACS), the report did not include any state-level estimates from the ACS, as have been provided in past years. Instead, the Census Bureau plans to release all data relating to the ACS on Thursday, September 15, 2022.
The CPS ASEC does provide important breakdowns of available health insurance coverage estimates at the national level, including by age, race and ethnicity, immigration status, marital status, geographic region, employment, poverty status, and Medicaid expansion status.
The following blog and infographic explore changes in coverage rates by demographic for nonelderly adults (age 19-64) and for children (age 0-18), who experienced a greater number of changes in insurance coverage both overall and across categories than their adult counterparts.
Changes in Uninsurance by Age and Characteristics
Among nonelderly adults (age 19-64), the overall rate of uninsurance remained statistically unchanged from the previous year, reported at 11.6% in 2021 compared to 11.9% in 2020.
Comparatively, children (age 0-18) had an uninsured rate of 5.0% in 2021, a decrease from 5.6% the previous year.
 Race and ethnicity
While uninsurance rates also remained unchanged across a number of racial and ethnic groups in 2021—7.5% for White adults, 7.7% for Asian adults, and 25.1% for Hispanic adults—the rate of uninsurance fell significantly among Black nonelderly adults, decreasing to 12.7% in 2021 from 14.2% in 2020.
Similarly, while uninsurance rates remained stable for children of several racial and ethnic groups in 2021—3.4% for White children and 8.6% for Hispanic children—the rate of uninsurance dropped significantly among Black children, falling to 4.3% in 2021 from 5.9% in 2020. Asian children, however, saw an increase in rates of uninsurance, rising to 4.6% in 2021 from 2.8% in 2020.
Immigration status
The rate of uninsurance among native-born nonelderly adults fell to 9.1% in 2021 from 9.6% in 2020, while the uninsurance rate among foreign-born adults remained statistically unchanged at 22.8% in 2021 compared to 22.9% in 2020.
Rates of uninsurance also fell among native-born children, decreasing to 4.5% in 2021 from 5.2% in 2020, while again, the uninsurance rate for foreign-born children was statistically unchanged at 18.6% in 2021.
Poverty level
When examining coverage by poverty level, rates of uninsurance among nonelderly adults were broadly unchanged for each measurable category: 24.0% among those with incomes below 100% poverty, 16.7% for those between 100%-399% poverty, and 4.5% for those living at or above 400% poverty.
In 2021, rates of uninsurance were unchanged for children in the two lower poverty level categories—8.3% for those in families with incomes below 100% poverty and 6.4% for those living in families with incomes between 100%-399% poverty. However, uninsured rates fell to 1.7% among children in families with incomes at or above 400% of poverty, a decrease of 0.4 PP from 2020.
Medicaid expansion status
As of January 1, 2021, 36 states and the District of Columbia have chosen to act on the option provided by the Affordable Care Act (ACA) and expand Medicaid eligibility requirements. Comparing rates of uninsurance by expansion and nonexpansion states revealed parallel trends for both nonelderly adults and children.
In 2021, the overall uninsured rate remained statistically unchanged from 2020 (9.0% in both years) for adults living in expansion states. However, uninsurance dropped from 17.7% in 2020 to 16.7% in 2021 for adults living in nonexpansion states.
Similarly, children in expansion states saw no change in uninsured rates for 2021 compared to 2020 (4.0% in both years). And again, uninsurance fell in nonexpansion states, falling to 7.1% in 2021 from 8.6% in 2020.
Other Notable Coverage Changes
Public and private coverage
Other notable overarching trends included a higher percentage of the population with public coverage, increasing 1.2 PP to 35.7% in 2021 from 34.5% in 2020, and a consequent decrease in the percentage of the population with private coverage, measuring at 66.0% in 2021, a decrease of 0.6 PP from 2020 (66.5%). The largest drivers of public and private coverage changes were a 0.9 PP increase in Medicaid coverage (18.9% in 2021, up from 17.9% in 2020) and a 0.2 PP drop in employment-based coverage (54.3% in 2021, down from 54.6% in 2020).
Poverty level
Of particular note in the report was a consistent correlation between poverty level for both adults and children and changes in rates of public and private insurance coverage between 2020 and 2021.
Rates of public coverage rose among adults in all poverty categories, increasing 2.4 PP to 51.8% among those with incomes below 100% of poverty, 0.8 PP to 25.4% for those between 100%-399% of poverty, and 0.5 PP to 5.7% among those living at or above 400% of poverty.
Rates of public coverage also increased by 2.0 PP to 44.2% among children in families with incomes between 100%-399% and by 1.2 PP to 7.2% for children in families at or above 400% of poverty. Rates of public coverage were unchanged among children below 100% of poverty (79.7%).
Looking at private coverage changes, uninsurance rates remained unchanged among adults in all poverty categories at 27.1%, 61.8%, and 91.8% for those with incomes below 100% of poverty, between 100%-399% of poverty, and at or above 400% of poverty, respectively.
Similarly, rates of private coverage were largely unchanged among children in families with incomes below 100% of poverty and those in families at or above 400% of poverty at 15.5% and 93.2%, respectively. Rates of private coverage did decrease in one category: children in families with incomes between 100%-399% of poverty, dropping by 1.5 PP to 53.4% in 2021.
Employment
Overall, rates of uninsurance fell amongst workers, decreasing to 10.7% in 2021 from 11.2% in 2020, driven by a decrease in adults who worked less than full-time year-round (15.1% in 2021 vs. 16.4% in 2020). Among those who worked full-time year-round, uninsurance did increase to 9.1% in 2021 from 8.4% in 2020, and among those who did not work in 2021, the rate of uninsurance remained unchanged at 14.8%.
Related Releases and Products
As previously mentioned, the Census Bureau will be releasing the full roster of 2021 estimates from the American Community Survey (ACS) on Thursday, September 15. SHADAC will be monitoring this release and providing updates, along with several blog posts analyzing the estimates, as soon as they are available.
In a follow-up to several blogs and reports released in 2021 that detailed the effects of COVID-19 on the 2020 CPS and ACS health insurance coverage data estimates, a new blog from the Census Bureau looks at the continuing impact of the pandemic on survey data collection and release processes and nonresponse bias.
Though data collection operations were mostly able to resume as normal, lower-than-usual response rates persisted into 2022, measuring at 72% compared to 76% in 2021. Prior to the pandemic (2018 and earlier), the CPS enjoyed some of the highest response rates across a number of federal surveys, consistently recording percentages in the high 80s and low 90s.
Additionally, the blog notes the continued presence of measurable nonresponse bias, particularly in categories of income statistics and poverty rates. While the CPS standard weighting methodology (described fully in the ASEC technical documentation) was able to account for differences in survey estimates and administrative data prior to 2019, figures in the blog show that both standard and even alternative weights employed by the Census Bureau have not been able to fully adjust for differences between respondents and nonrespondents since 2020, highlighting the fact that certain pandemic-era challenges still persist.
Notes
All changes are statistically significant at the 90 percent confidence level.
All estimates come from the 2021 and 2022 Current Population Survey Annual Social and Economic Supplement, which provide data for years 2020 and 2021, respectively.
Both the 2020 and 2021 estimates use 2020 Census-based population controls, meaning that estimates for 2020 listed in the current report may not always match those listed in the report published in September 2021, which used 2010 Census-based population controls.
Uninsured estimates represent individuals with no health insurance coverage for the entire calendar year.
Estimates of health insurance coverage type represent individuals with that type of coverage at any point during the calendar year. Types of health insurance coverage are not mutually exclusive.
Blog & News

Understanding the Undercount of Medicaid Enrollees in the 2020 Current Population Survey Health Insurance Coverage Data
April 6, 2022:Studies have long shown that surveys underestimate the number of people enrolled in Medicaid, and that the extent of this “undercount” varies across surveys and states. SHADAC researchers have made significant contributions in this area, and the extent to which the Current Population Survey Annual Social and Economic Supplement (CPS ASEC) undercounts Medicaid is one of the reasons we typically rely on the American Community Survey (ACS) to track state-level health insurance coverage. However, as the COVID-19 pandemic and ensuing disruptions to data collection for this survey resulted in considerable nonresponse bias in the 2020 ACS and led to the decision to release 2020 ACS data in an experimental-only format, SHADAC has chosen to produce 2020 state-level estimates of coverage using the CPS as a stand-in for the ACS for this year only.1
It is important for users to understand the Medicaid undercount in the CPS when interpreting coverage estimates. In this blog post, we briefly review the research regarding the Medicaid undercount in the CPS, and provide estimates of how it varies across states in 2020. We also discuss the impact of assigning single coverage for those with multiple sources (known as the insurance “hierarchy”) on the Medicaid undercount in the CPS, and other limitations of the data that contribute to the undercount.
Medicaid Undercount
The “Medicaid undercount” refers to the discrepancies that exist between survey estimates of enrollment in Medicaid and the number of enrollees that are actually reported in state and national administrative data—a pattern in which the former estimate is consistently reported lower than the latter. Studies on the subject have shown that nearly all surveys undercount Medicaid/CHIP enrollment relative to administrative sources, but the magnitude of the undercount range can vary broadly between major federal surveys (e.g., the American Community Survey, the Current Population Survey, the Medical Expenditure Panel Survey, etc.).
Previous studies have estimated the Medicaid undercount in the CPS at approximately 30 percent. Research on the Medicaid undercount relies on linking survey data to administrative records to identify whether respondents who were enrolled in Medicaid according to state administrative data reported having Medicaid when surveyed, a process which provides researchers with the best information about the undercount. However, published estimates for 2020 do not exist. Therefore, in order to provide an approximation of the undercount in the 2020 CPS, we compared the weighted count of the population with Medicaid in the CPS to the actual count of Medicaid enrollees based on data from the Centers for Medicare & Medicaid Services (CMS).
Table 1 shows the results of this comparison by state, measuring SHADAC’s estimate of the number of people with Medicaid as a primary source of coverage against the count of Medicaid enrollees from CMS. The undercount varies considerably by state, from just 3 percent in Wyoming to 57 percent in Hawaii.
Reasons for the Medicaid Undercount
Research has shown that the undercount is driven primarily by reporting error; in other words, by people who are enrolled in Medicaid reporting either that they have no insurance or reporting some other type of insurance. As Table 1 demonstrates, the size of the undercount also varies across states. This variation can result from a variety of factors, including how the characteristics of those enrolled in Medicaid differ across states. For example, studies have shown that adults, those with higher incomes, and those with shorter spells of Medicaid coverage are less likely to report having Medicaid when responding to surveys.
There is also reason to consider that the undercount in 2020 may be more severe due to the pandemic. According to recent research, the pandemic resulted in nonresponse bias in the CPS, including the underrepresentation of communities reporting lower incomes, which is likely to mean fewer people reporting Medicaid coverage. It is also likely that the provisions of the public health emergency that provide continuous coverage for those enrolled in Medicaid will result in a larger discrepancy between survey estimates and enrollment, because people that would otherwise become disenrolled due to redetermination of eligibility or for administrative reasons would remain covered.
Impact of Implementing an Insurance “Hierarchy”
Although reporting error is an important driver of the Medicaid undercount in survey data, there are also analytic choices that can impact the extent to which survey respondents are attributed to Medicaid coverage. One of these is the approach of assigning people who report multiple coverage types to just one type of coverage using what is known as an insurance “hierarchy.” SHADAC routinely imposes a primary source of coverage hierarchy when reporting national, state, and sub-state estimates of health insurance coverage. The goal of SHADAC’s coverage hierarchy is to identify survey respondents who report multiple sources of health insurance and determine which source is likely to: (a) be a comprehensive health insurance plan, that (b) serves as the respondent’s primary payer (i.e., the insurance plan that pays first). Despite the analytic soundness of this goal, SHADAC’s hierarchy usually has the effect of increasing the apparent size of the Medicaid undercount.
SHADAC uses separate coverage hierarchies for children (age < 19) and adults (age 19+), as shown in Table 2. The reason for using separate hierarchies by for children and adults is that Medicare is considered the primary source of coverage for adults age 19 and older, as it is the primary payer for covered medical services. For example, if an eligible adult is covered by Medicare either due to age (65+) or disability and is also covered by Medicaid, the primary payer would still be Medicare. Children age 18 and younger are not eligible for Medicare (except in one rare and specific instance), and therefore Employer/Military coverage is considered primary, as many children draw on this source of coverage as dependents of an adult parent or caregiver. Medicaid is considered the payer of last resort in most cases for people who have both Medicaid and some other form of coverage, which is why it is assigned after Medicare and Employer for adults and after Employer coverage for children. More information about SHADAC’s insurance hierarchy is available here.
Table 3 below compares the Medicaid undercount in the CPS with and without application of the SHADAC insurance hierarchy. In the “non-hierarchy” estimates, anyone with Medicaid (regardless of whether they are also covered by another type of insurance) is “counted” as having Medicaid. Not surprisingly, this results in a smaller undercount; in the U.S., the difference between the CPS and CMS data drops from 41 percent to 28 percent. Similar to the undercount estimates with application of the hierarchy, the extent of the change to non-hierarchy data varies across states, from 24 percentage points in Maine to 4 percentage points in Maryland. This variation is due to the difference in the share of people reporting Medicaid and some other coverage type in the CPS. It is also important to note that eliminating the insurance hierarchy does not eliminate the problem of the Medicaid undercount in the CPS overall, or in the vast majority of states.
It is also important to note that the CPS presents unique challenges related both to implementing an insurance hierarchy and the Medicaid undercount. This is primarily due to the reference period of coverage collected in CPS. The CPS gathers information about insurance status over the entire previous year; for instance, if a respondent had separate, non-concurrent spells of Medicaid and employer insurance in the previous year, that respondent would be shown to have both types of coverage in the previous year. With the application of SHADAC’s insurance hierarchy, this person would be assigned to employer-sponsored insurance (ESI) alone, despite having both ESI and Medicaid as primary sources of coverage in the previous year. This is different from the ACS, which captures information about coverage at the time of interview, and therefore all respondents with multiple sources of coverage hold those coverages concurrently.
It is also important to note that there are pros and cons to applying an insurance hierarchy, and the decision to do so or not depends on the research question at hand. A hierarchy may not be appropriate when looking at respondents with a specific source of coverage when the status of that type of coverage as primary versus supplementary is not relevant to the analysis. (e.g., if the question is about understanding the health status of everyone enrolled in Medicaid, regardless of the duration or supplementary status of that coverage). Also, no single hierarchy will be appropriate for every analysis. Rather, analysts can and should alter the priority of coverage types in the hierarchy according to their specific research question. A study focusing on changes in the rates of public coverage over time, for instance, would likely put public coverage types first in the hierarchy before forms of private coverage such as ESI or direct purchase coverage.
Looking Ahead
The CPS has historically undercounted the Medicaid population for a variety of reasons. This issue of undercount does not mean that the CPS is not useful for understanding coverage, but it is important for users to understand this limitation and its causes. SHADAC is available to provide technical assistance to analysts looking to make decisions about how and whether to use the CPS, based on the specific research question of interest.
We are also optimistic that the American Community Survey (ACS) will once again serve as a reliable source of coverage information in 2021, and plan to revert to this data source for providing state-level estimates of coverage. Although Census researchers remain uncertain on whether or not the pandemic may again have impacts on the ACS in the coming year, the fundamental data collection issues (i.e., temporary suspension of mail operations and in-person interviews) that resulted in significant nonresponse bias during the height of the pandemic were not factors for the data collected in 2021.
1 The 2021 CPS was also subject to pandemic-related nonresponse bias, though likely to a lesser extent than the 2020 ACS.
Blog & News
Current Population Survey (CPS) will Serve as Primary Source of 2020 State-level Data on Health Insurance
September 22, 2021:| RECENT CPS ANALYSIS | |
|
CPS Shows 2020 National Uninsured Rate Stable, Rising in Three States
|
|


On September 14, the U.S. Census Bureau released 2020 health insurance estimates from the Current Population Survey (CPS). These data will serve as one of the only sources of 2020 state-level health insurance as the Census Bureau will not be releasing its typical 1-year estimates from the 2020 American Community Survey (ACS) due to impacts of the COVID pandemic that resulted in substantially lower response rates and nonresponse bias.
SHADAC typically relies on the ACS to study state and sub-state (e.g., state coverage by race) health insurance trends and posts detailed state estimates on State Health Compare. However, because the ACS data are not being released this year, we recommend that analysts instead use the CPS and have posted 2020 estimates from the CPS on State Health Compare for analysts and policymakers that need 2020 state-level information on coverage. This blog provides an overview of important differences between the two surveys for those using CPS estimates in place of the ACS this year.
Key differences between CPS and ACS
There are some critical differences between the CPS and ACS, and it is important to understand these differences when interpreting results.
Sample size
Perhaps one of the most critical differences between the ACS and the CPS for analysts and policymakers interested in estimates at the state, and more granular levels of geography or subpopulations, is sample size. The ACS has significantly more sample than the CPS; over 2 million households in 2019 compared to just over 94,000 in the CPS. Sample size is the primary reason that SHADAC typically uses the ACS to produce estimates of coverage for State Health Compare. As we note in our blog outlining results from the CPS, relying on the CPS means that we are unable to produce as many subpopulation estimates within states as we do with the ACS. In addition to limiting the estimates that can be produced, the smaller sample size of the CPS also results in less precision, even for estimates that the sample size does support.
Conceptual differences in the definition of the uninsured
The CPS estimates presented above and on State Health Compare reflect insurance status of respondents for the entire calendar year of 2020. In contrast, the ACS collects information at a “point in time” when the survey was conducted. As a result, estimates of uninsurance in the CPS are lower than the ACS, because people who had coverage at some point in the prior calendar year are not considered uninsured. The ACS, on the other hand, captures a cross-section of people who are uninsured at the time the survey was conducted, some of whom were not uninsured for the entire year. These differences are important, but it is also helpful to note that the surveys have historically demonstrated similar national trends over time, and the patterns across states are consistent in that states with low uninsurance levels have low levels in both surveys, and states with high levels have high levels in both surveys, and so on. For more detailed comparisons across surveys in prior years, see SHADAC’s “Comparing Federal Government Surveys That Count the Uninsured” brief.
Reference period
As discussed above, the CPS asks about coverage for the entire previous calendar year. The survey is fielded in February through April of each year, with respondents being asked to report their coverage for a time period as long as 16 months prior to the interview. The ACS collects information about current coverage only. Differences in the length of time for which respondents are being asked to recall their insurance coverage status can result in differences in measurement error across the surveys.
Breadth of Related Measures
Another important difference between the two surveys is the breadth of related content. The ACS’ main focus is broad demographic information, with just one question on health insurance. While the rich demographic information supports examination of the uninsured and the exploration of coverage by individual characteristics (e.g., social determinants of health) it has limited health policy applications. The CPS, on the other hand, contains a range of measures that are broadly relevant to health policy, such as medical out of pocket spending, health status, and eligibility for employer coverage. This means that the survey can be used to answer more complex research questions about the interactions between coverage and these related outcomes than could be supported through analysis of the ACS. The CPS also collects much more detailed information on income and employment than the CPS.
Looking Ahead
The CPS provides a good alternative for those that usually rely on state-level estimates of coverage from the ACS for analysis and planning. However, the data source does have some limitations, particularly for those seeking more granular estimates by geography and subpopulations within states. SHADAC is available to provide technical assistance to states that are seeking additional guidance on potential data sources to leverage for answering these questions in 2020. We will also be tracking the Census Bureau’s release of the 2020 1-year experimental ACS data, which are expected by November 30 of this year.
References
U.S. Census Bureau. (2016, May 16). Fact sheet: differences between the American Community Survey (ACS) and the Annual Social and Economic Supplement to the Current Population Survey (CPS ASEC). https://www.census.gov/topics/income-poverty/guidance/data-sources/acs-vs-cps.html
State Health Access Data Assistance Center (SHADAC). (October 2020). Comparing federal government surveys that count the uninsured: 2020. https://www.shadac.org/publications/comparing-federal-government-surveys-count-uninsured-2020
Stewart, A. (2021, July 30). Census Bureau announces major changes to 2020 American Community Survey (ACS) data release. State Health Access Data Assistance Center (SHADAC). https://www.shadac.org/news/changes-to-2020-acs-data-release-US-Census
Stewart, A. (2021, August 27). New SHADAC brief looks at changes in federal surveys during COVID pandemic. State Health Access Data Assistance Center (SHADAC). https://www.shadac.org/news/new-shadac-brief-looks-changes-federal-surveys-during-covid-pandemic