Blog & News
U.S. Census Bureau Analytic Report Shows Significant Non-Response Bias in the 2020 American Community Survey
November 11, 2021:The U.S. Census Bureau recently released an analytical report that details and evaluates the impact of the COVID-19 pandemic on data collection and data quality in the 2020 American Community Survey (ACS) and provides evidence supporting its decision to release the 2020 ACS 1-Year estimates and public use microdata on an “experimental,” rather than official basis. This blog post highlights evidence from the report that the pandemic-related disruptions to data collection resulted in measurable non-response bias in the 2020 ACS, causing the survey to over-represent economically advantaged populations.
The analytical report examines trends in a number of measures that are thought to be reasonably stable from year to year or which can be validated against external data sources. The measures evaluated include:
- Building structure type,
- Medicaid coverage,
- educational attainment,
- non-citizen population, and
- median household income.
This post will highlight trends from a selection of these measures: Medicaid coverage, non-citizen population, and educational attainment.
Medicaid Coverage
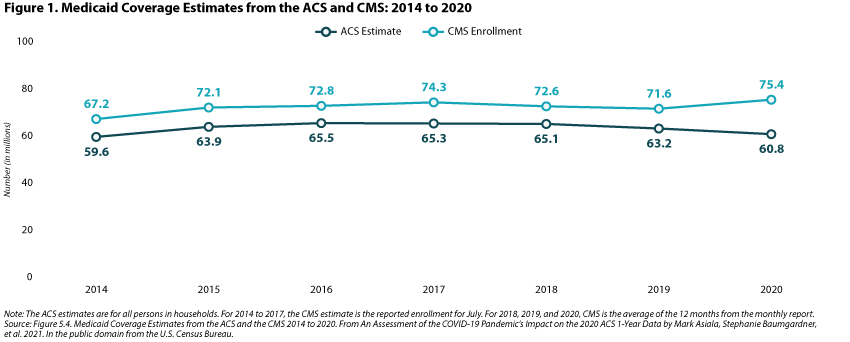
Figure 1 below compares Medicaid coverage (millions of persons covered) information from the ACS to enrollment data from the Centers for Medicare and Medicaid Services (CMS). Though ACS data have consistently under-estimated the number of individuals covered by Medicaid relative to administrative data, the figure shows how trends in enrollment have been parallel in the past. However, in 2020, these trends diverged, with CMS enrollment data showing an increase in Medicaid coverage (consistent with previous experience that Medicaid coverage increases during economic downturns) and ACS data showing a decrease in Medicaid coverage. This divergence is evidence that households that responded to the ACS were more socioeconomically advantaged than in previous years, and therefore were less likely to report having Medicaid coverage.
Non-Citizen Population
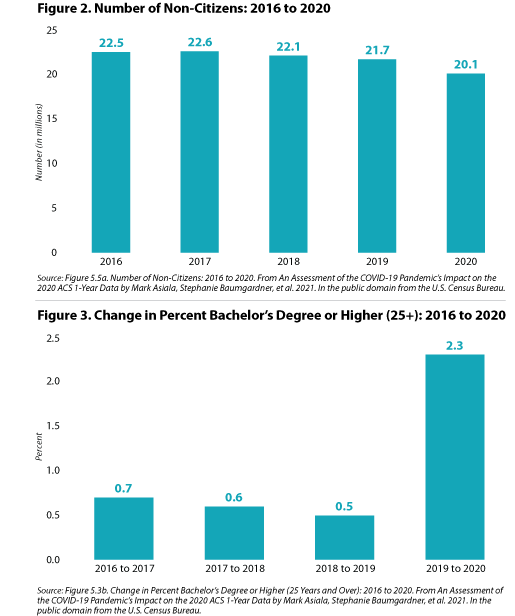
Results in figure 2 show that the number of non-citizens has been largely stable year to year from 2016 through 2019, but the number of non-citizens decreased substantially in 2020, falling by 1.6 million persons. The report’s authors propose that this decrease, though potentially due in part to changes in international migration, is likely due to non-response bias since “foreign born—and non-citizens in particular—disproportionately respond to the ACS via in-person response follow-up methods,” which were substantially cut back in 2020 due to the COVID pandemic.
Educational Attainment
The share of the population age 25 years and over with a bachelor’s degree or higher was relatively stable year-over-year from 2016 through 2019, changing by less than one percentage point. However, from 2019 to 2020, the percent of the population with a bachelor’s degree increased by 2.3 percentage points, which, if accurate, would translate to an increase of about 6 million people with a bachelor’s degree or higher between 2019 and 2020. In previous years, the ACS has shown a year-over-year increase of approximately 2 million in the number of bachelor’s degrees (figure 3).
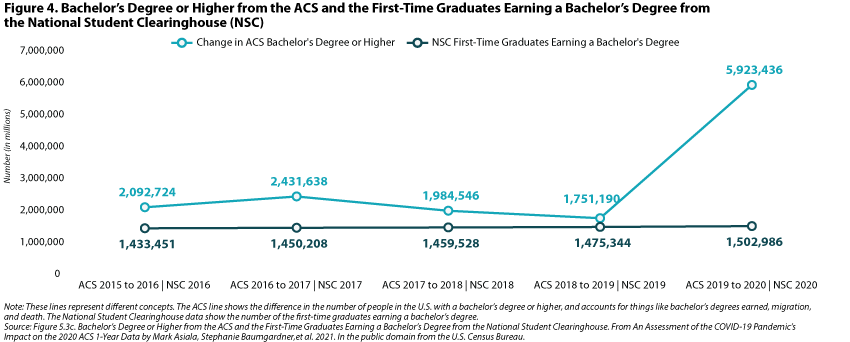
Below, figure 4 compares the year-over-year change in the number of bachelor’s degrees in the ACS to administrative data from the National Student Clearinghouse (NSC), an organization that provides enrollment and degree verification. Contrary to the ACS estimates, the NSC data do not show a large increase in the number of bachelor’s degrees in 2020. This is another piece of evidence demonstrating that the 2020 ACS data had measurable non-response bias that also over-represented a more highly educated population.
Conclusion
The measures presented here and in the Census Bureau’s analytic report on the 2020 ACS provide fairly clear evidence that the data collected in the 2020 ACS over-represent a more socioeconomically and educationally advantaged population, an issue that is the product of pandemic-related disruptions to data collection as well as resulting non-response bias. Because of these demonstrable data quality issues, the Census Bureau has chosen to release a limited set of 2020 ACS 1-Year estimates and the public-use microdata sample (PUMS) as “experimental” data products, which will be available later this month.
We commend Census for its transparency in providing this level of detailed evidence of the complications with the 2020 ACS and for making the 2020 ACS data available in an experimental format at least, rather than withholding them entirely from public release. Though the lack of reliable 2020 ACS data creates a critical information gap for a range of data users, given this evidence and the "gold standard" nature of ACS data, it is clear that the Census Bureau acted prudently in not releasing the 2020 ACS as usual.
Related Resources
Census Bureau Announces Major Changes to 2020 American Community Survey (ACS) Data Release (SHADAC Blog)
Changes in Federal Surveys Due to and During COVID-19 (SHADAC Brief)
Current Population Survey (CPS) will Serve as Primary Source of 2020 State-level Data on Health Insurance (SHADAC Blog)
Publication
Minnesota's Uninsured Population by Legislative District
Our research team at SHADAC has continued its partnership with the Blue Cross Blue Shield Foundation of Minnesota to refresh a tool that provides critical information on the uninsured populations in Minnesota at the legislative district level.
Legislative District Infographics (2015-2019 data)
Using the United States Census Bureau's 2015-2019 American Community Survey, 5-year estimates, this unique set of infographics highlight and categorize uninsured rates using color-coded state maps and graphics that provide a deeper look into the socioeconomic data (such as race, ethnicity, income, and age) of each Minnesota House and Senate district. The state legislative maps are color-coded according to four levels of need for coverage assistance: Needs Most Assistance (uninsured rate of 6.9% or more); Needs Significant Assistance (uninsured rates between 4.6%-6.8%); Needs Some Assistance (uninsured rates between 2.4%-4.5%); Needs Less Assistance (under 2.3%). These infographics are designed to provide clear and concise snapshots of coverage needs to raise awareness and assist policymakers and health insurance navigators in developing strategies to reach the remaining uninsured in the state of Minnesota.
Click on an individual house or senate district in the PDF to the right to access a two-page infographic that contains detailed socioeconomic data about that respective district. If you need help determining a legislative district of interest, click the "Find a Legislative District" in the header of the accompanying PDF.
Interactive Map (2015-2019 data)
 This map is designed to be used alongside the profile and contains data from the 5-year estimates within the United States Census Bureau's 2015-2019 American Community Survey. Use the “Find address or place” search box at the bottom of the map and then click on the magnifying glass.
Click the image to the right to explore the interactive map.
We would greatly appreciate your feedback on the community and uninsured profile. Share your suggestions with us here.
Publication
Factors associated with accurate reporting of public and private health insurance type (HSR)
This Journal article was originally published on August 26, 2021, in Health Services Research.
Introduction
This article authored by SHADAC Investigator Dr. Kathleen T. Call, and colleagues from the U.S. Census Bureau Angela R. Fertig and Joanne Pascale, explores factors associated with accurate reporting of private and public health insurance coverage. It moves beyond the usual focus on Medicaid reporting accuracy to examine reporting accuracy for private insurance; because the study occurred after the implementation of the Affordable Care Act (ACA) Marketplace enrollees are included. Additionally, we contrast factors associated with reporting accuracy for two federal surveys commonly used to measure health insurance coverage: the American Community Survey (ACS) and the redesigned Current Population Survey's Annual Social and Economic Supplement (CPS). Results from this study can inform data editing and modeling routines that account for measurement error.
Principal findings
Reporting accuracy across treatment and coverage type is high (77%–84%). As with past research, accurate reporting of public insurance is higher for people with characteristics consistent with eligibility for public insurance for both survey treatments. For the ACS treatment, reports of direct purchase insurance are more accurate for enrollees who receive a premium subsidy.
Read the full article in Health Services Research or download it here.
Blog & News
Census Bureau Announces Major Changes to 2020 American Community Survey (ACS) Data Release
July 30, 2021:*Update (November 30, 2021): On November 30, the U.S. Census Bureau announced the official release of the 2020 ACS 1-year "experimental" estimates, along with the Public Use Microdata Sample (PUMS) file and a working paper.
On July 29, the U.S. Census Bureau announced during a special webinar that due to impacts of the COVID-19 pandemic on the American Community Survey (ACS), the 2020 1-Year estimates will not be released as usual in September, nor will 2020 ACS data be included in related products (e.g., the CPS Health Insurance Report). This change comes as the pandemic resulted in substantially lower response rates and non-response bias that could affect the accuracy of estimates. Instead of the usual data products, the Census Bureau plans to release a set of 2020 ACS “Experimental” 1-year estimates for a more limited set of geographies, scheduled to be available in November 2021.
Resources available from the Census Bureau include:
- Slides from the webinar
- A press release detailing the impacts of COVID on the ACS data
- Revised release schedule and explanation of the experimental estimates
- A short informational guide to understanding how your work may be impacted by the change in the 2020 ACS data
SHADAC will continue to closely monitor future announcements and data releases related to the ACS, and we will assess whether and how any 2020 ACS data products can be used to produce state-level health insurance coverage and related estimates. We will also assess if and which other data sources may be useful for producing the coverage estimates we typically get from the ACS.
Archived Updates
September 22, 2021: The Census Bureau has released national estimates of health insurance coverage from the Current Population Survey (CPS), which they recommend for use this year instead of data from the ACS. SHADAC has published two separate blogs using the CPS, with the first post detailing how the CPS will serve as the primary data source for health insurance coverage this year and how it differs from the ACS and the second blog providing an overview of national-level insurance coverage trends and public and private insurance coverage data from the CPS.
October 6, 2021: Using estimates from the CPS, SHADAC researchers have produced a special, 2020-only Health Insurance Coverage measure for all 50 states on State Health Compare.
October 27, 2021: A new analytic report further detailing the impact of the COVID-19 pandemic on the 2020 ACS 1-year data has been published by the Census Bureau. The report details several different data category responses that confirm initial concerns of over-representation of more economically advantaged respondents.
November 10, 2021: The Census Bureau announced that, in an effort to preserve data quality in the estimates from the ACS, the 2016-2020 5-year data will now be released in March 2022 rather than as initially planned in December 2021.
November 17, 2021: The Census Bureau confirmed that the 2020 ACS 1-year "experimental" estimates will be released on November 30, 2021, along with the Public Use Microdata Sample (PUMS) file and a working paper. Census will also be hosting a webinar accompanying the release in order to explain and answer questions about the estimates.
Publication
Comparing Federal Government Surveys That Count the Uninsured: 2020
 With the release of new insurance coverage estimates from surveys conducted by the U.S. Census Bureau, the Agency for Healthcare Research and Quality (AHRQ), and the Centers for Disease Control and Prevention (CDC), SHADAC has updated our annual “Comparing Federal Government Surveys that Count the Uninsured” brief.
The brief provides an annual update to comparisons of uninsurance estimates from four federal surveys:
- The American Community Survey (ACS)
- The Current Population Survey (CPS)
- The Medical Expenditure Panel Survey - Household Component (MEPS-HC)
- The National Health Interview Survey (NHIS)
In this brief, SHADAC presents current and historical national estimates of uninsurance along with the most recent available state-level estimates from these surveys. We also discuss the main reasons for variation in the estimates across the different surveys as well as possible reasons for incomparability of estimates across and within the surveys.
Download a PDF of the Comparing Federal Government Surveys Brief.
Last year’s brief with data from 2019, and certain 2018 data, can be accessed here.


