April 19, 2021
In the midst of the opioid epidemic, the United States has been quietly experiencing another mounting public health crisis as deaths involving alcohol have grown to historic highs. After years of stability, the rate of alcohol-related deaths began to increase in 2007 and has increased significantly almost every year since, growing by 49 percent to 10.4 deaths per 100,000 people in 2019. Of the 414,000 alcohol-involved deaths that occurred nationwide during the 2006 to 2019 time period, 88,000 would not have occurred if alcohol-involved deaths had held steady at 2006 rates.
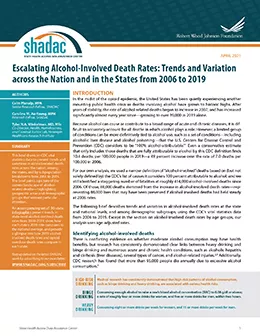
In an effort to shed light on the growing issue of alcohol-involved deaths, SHADAC researchers have produced an issue brief that describes trends and variation in alcohol-involved death rates at the state and national levels, and among demographic subgroups, using vital statistics data from the Centers for Disease Control and Prevention for 2006 to 2019.
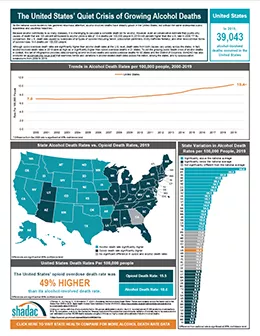
To accompany the issue brief, SHADAC also developed infographics for all 50 states and the District of Columbia. These infographics present trends in state-level alcohol-involved death rates from 2000-2019, show how each state's 2019 rate compares to the national average, and provide a glimpse into how 2019 alcohol-involved death rates and opioid overdose death rates compare in each state.
State alcohol-involved deaths per 100,000 people, 2019
Click on a state below view its infographic.
Quick infographic links: the United States, the District of Columbia, and All States.
Related Reading:
U.S. Alcohol-Related Deaths Grew Nearly 50% in Two Decades: SHADAC Briefs Examine the Numbers among Subgroups and States (SHADAC Blog)
Overdose Crisis in Transition: Changing National and State Trends in a Widening Drug Death Epidemic (SHADAC Briefs)
50-State Analysis of Drug Overdose Trends: The Evolving Opioid Crisis Across the States (Infographics)


