The COVID-19 pandemic has altered long-standing patterns of life and work in the United States and internationally. The pandemic, along with the associated policy response, led to (at least temporary) changes in Americans’ primary source of health insurance coverage, with more Americans enrolled in public coverage and fewer in private. Despite these shifts, employer-sponsored health insurance (ESI) remains the largest single source of coverage for most Americans, with 62.2 million private-sector workers enrolled in ESI in 2021. This report considers how trends in ESI coverage and cost have evolved over the past three years, since the pre-pandemic baseline (2019), since the first year of the pandemic (2020), and in 2021, as the country emerges from pandemic-related restrictions and economic dislocation. These analyses use estimates from the Medical Expenditure Panel Survey-Insurance Component (MEPS-IC), recently produced by the Agency for Healthcare Research and Quality (AHRQ).
This narrative also provides an overview of the 2021 MEPS-IC private-sector ESI estimates, covering changes in market composition, ESI access, and cost. Because changes in the labor market caused by COVID-19 likely had a large influence on measures of ESI access in 2020, the analysis of ESI access will compare 2021 estimates against a pre-pandemic baseline of 2019. However, the pandemic likely had a smaller impact on long-running cost trends, so the analysis of ESI costs will compare 2021 estimates against 2020.
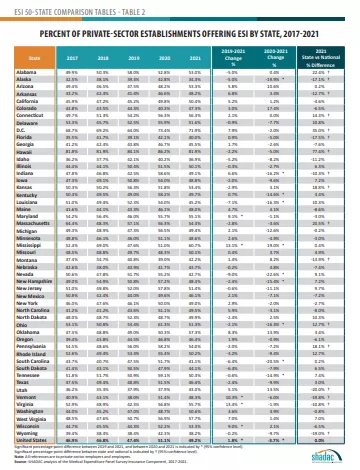
Accompanying this narrative are detailed 50-state comparison tables that allow for easy cross-state analysis of ESI trends from 2017 to 2021, significant changes in ESI rates from 2019 to 2021 and 2020 to 2021, and state vs national average comparisons for 2021 estimates.
For more detailed information on ESI findings from SHADAC, see the following products:
- Printable version of this ESI Report Narrative
- Companion Blog and Infographic highlighting key findings in ESI coverage at the national level
- 50-State Comparison Tables including 2017-2021 ESI estimates
- 2020 ESI Blog covering pandemic-era trends


