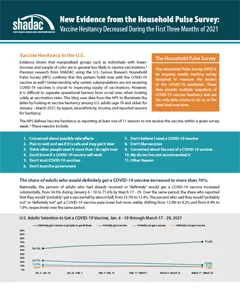
Evidence shows that marginalized groups such as individuals with lower-incomes and people of color are in general less likely to receive vaccinations.i Previous research from SHADAC using the U.S. Census Bureau’s Household Pulse Survey (HPS) confirms that this pattern holds true with the COVID-19 vaccine as well.ii] Understanding why certain subpopulations are not receiving COVID-19 vaccines is crucial to improving equity of vaccinations. However, it is difficult to separate operational barriers from social ones when looking solely at vaccination rates. This blog uses data from the HPS to illuminate the latter by looking at vaccine hesitancy among U.S. adults (age 18 and older) for January – March 2021, by region, race/ethnicity, income, and reported reasons for hesitancy.
|
The HPS is an ongoing weekly tracking survey designed to measure the impact of the COVID-19 pandemic. |
The HPS defines vaccine hesitancy as reporting at least one of 11 reasons to not receive the vaccine within a given survey week.iii These reasons include:
| 1) Concerned about possible side effects 2) Plan to wait and see if it is safe and may get it later 3) Think other people need it more than I do right now 4) Don't know if a COVID-19 vaccine will work |
5) Don't trust COVID-19 vaccines
6) Don't trust the government
7) Don't believe I need a COVID-19 vaccine
8) Don't like vaccines
|
9) Concerned about the cost of a COVID-19 vaccine 10) My doctor has not recommended it 11) Other Reason |
The share of adults who would definitely get a COVID-19 vaccine increased to more than 70%.
Nationally, the percent of adults who had already received or “definitely” would get a COVID-19 vaccine increased substantially, from 54.5% during January 6 - 18 to 71.6% by March 17 - 29. Over the same period, the share who reported that they would “probably” get a vaccine fell by almost half, from 23.7% to 12.4%. The percent who said they would “probably not” or “definitely not” get a COVID-19 vaccine were lower but more stable, shifting from 12.9% to 8.2% and from 8.9% to 7.8%, respectively over the same period.
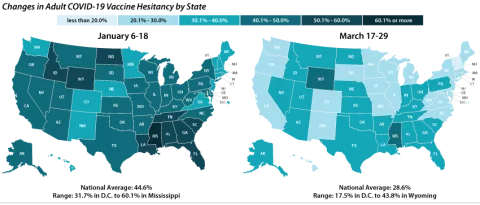
Vaccine hesitancy varied dramatically by state, but nearly all states saw decreases.
Nationally, 28.6% of adults reported one or more reason for not getting a COVID-19 vaccine during March 17 – 29, and this varied across the states, from 17.5% in the District of Columbia to 43.8% in Wyoming. One in three adults cited one or more reasons for not getting a COVID-19 vaccine in 13 states.
The national rate of adult vaccine hesitancy decreased by 16.0 percentage points (PP) between January 6-18 and March 17-29 (44.6% to 28.6%). All states but Nebraska saw decreases in rates of COVID-19 vaccine hesitancy over the same period.
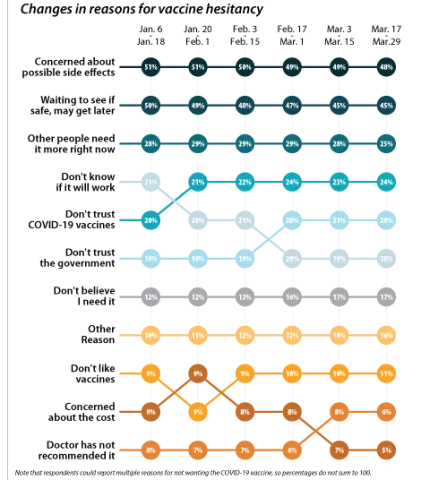
Concerns over possible side effects and safety were the top two reported reasons for vaccine hesitancy.
Of the 28.6% of respondents who reported vaccine hesitancy during the March 17-29 period, 47.8% cited concerns about possible side effects of the vaccine and 43.7% cited wanting to wait to see if the vaccine was safe. As a proportion of all reasons cited by the hesitant population, these two have decreased slightly over the first three months of the year, but still remain the top two reasons for vaccine hesitancy overall. The next most cited reason during the same survey period was “I think other people need it more than I do right now” at 25.0%. These rankings hold within subpopulations such as region, race, and income. The average number of reasons for hesitancy reported was 2.3 per respondent.
While concerns about potential side effects, safety, priority, and efficacy have been decreasing, distrust of the COVID-19 vaccines and distrust of the government, along with not believing that “I need a COVID-19 vaccine” have all increased as stated reasons for vaccine hesitancy. This could be cause for concern, since these reasons for hesitancy may not fade as individuals see more people in their communities getting safely vaccinated.
Disparities in vaccine hesitancy rates improved over time, but leveled out amongst certain demographics.
A similar story emerges when looking at hesitancy across demographic and socioeconomic factors; hesitancy has improved over time, but with distinctions across subpopulations. For example, hesitancy rates among Black adults have decreased from 64.7% to 36.9% but remain much higher than among other racial/ethnic groups.
Similar to vaccination rates, we find disparities in hesitancy across income categories with rates decreasing as income increases. These disparities have slightly closed over time as there has been a greater reduction in hesitancy rates for those making less than $50,000 than those making more than $50,000. However, there’s still a stark difference across groups as those with incomes between $25,000 and $34,999 continued to be more than twice as likely as those with incomes of $200,000 or greater to report vaccine hesitancy.
As shown by previous analysis, groups with fewer connections to the health care system, such as those without health insurance coverage will likely be some of the hardest to reach with COVID-19 vaccinations. This concern is borne out in rates of hesitancy by insurance status. Though rates of hesitancy have fallen for both those with and without health insurance coverage, the uninsured remain more likely to report hesitancy (43.6%) compared to those with employer-sponsored (ESI)/Military, Direct Purchase, or Medicare coverage. Adults with Medicaid were also more likely to report vaccine hesitancy (47.3%) compared with adults with ESI/Military, Direct Purchase, or Medicare coverage.
Notes:
All changes and differences in this post are statistically significant at the 95% confidence level unless otherwise noted.
Related Reading
SHADAC Brief: Anticipating COVID-19 Vaccination Challenges through Flu Vaccination Patterns
SHADAC Blog Series: Measuring Coronavirus Impacts with the Census Bureau's New Household Pulse Survey: Utilizing the Data and Understanding the Methodology
50-State Infographics: A State-level Look at Flu Vaccination Rates among Key Population Subgroups
i Planalp, C. & Hest, R. (2021). Anticipating COVID-19 Vaccination Challenges through Flu Vaccination Patterns. State Health Access Data Assistance Center (SHADAC). https://www.shadac.org/publications/anticipating-covid-19-vaccination-challenges-through-flu-vaccination-patterns
ii State Health Access Data Assistance Center (SHADAC). (2021). Measuring Coronavirus Impacts with the Census Bureau's New Household Pulse Survey: Utilizing the Data and Understanding the Methodology. https://www.shadac.org/Household-Pulse-SurveyMethods
iii The following respondents are given 11 reasons to select from for why they would not “definitely” get a COVID-19 vaccine: respondents who…
a. Had not received a COVID-19 vaccine and reported that they would not “definitely get a vaccine” once it was available to them;
b. Or had gotten one dose of a two-dose COVID-19 but did not plan to get the second dose.
Vaccine Hesitancy Decreased During the First Three Months of the Year (Household Pulse Survey)


