In the midst of the opioid epidemic, the United States has been quietly experiencing another mounting public health crisis as deaths involving alcohol have grown to historic highs. After years of stability, the rate of alcohol-related deaths began to increase in 2007 and has increased significantly almost every year since according to vital statistics data from the U.S. Centers for Disease Control and Prevention (CDC).
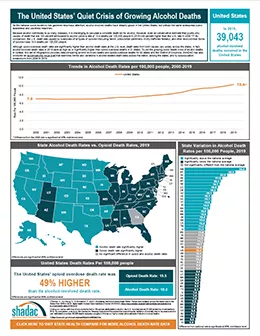
Because alcohol contributes to so many diseases, it is challenging to calculate a complete death toll for alcohol. However, even a conservative estimate that counts only causes of death that are 100 percent attributable to alcohol yields a rate of 10.4 deaths per 100,000 people in 2019—49 percent higher than the U.S. rate in 2006—representing over 39,00 deaths nationwide.
This trend in alcohol-related death rates predates the COVID-19 pandemic, during which time research indicates that there have been concerning changes in alcohol use..i,ii, iii For instance, some states have reported increased alcohol sales, and surveys have found increases in alcohol consumption and high-risk drinking behaviors, such as heavy drinking and binge drinking.iv,v,vi,vii According to a SHADAC COVID-19 survey conducted in April 2020, 15.4% of adults nationwide reported increased alcohol consumption due to the stress of COVID, with numbers up across demographic categories of race, age, gender, and educational attainment. While experts will look to alcohol-related death rates as one important indicator of the behavioral health impact of COVID-19, data on alcohol-related deaths for 2020 will not be available until next year at the earliest. In the meantime, new vital statistics data from 2019, estimates of which can be found on the SHADAC’s State Health Compare, provide an updated baseline to help understand potential changes during and since the COVID-19 crisis.
A new SHADAC brief draws on CDC vital statistics data to present trends and variations in alcohol-related death rates across the nation, among the states, and by subpopulation breakdowns from 2006 to 2019. The brief paints a picture of the current landscape of alcohol-related deaths—highlighting geographic areas and demographic groups that warrant particular attention.
To accompany the issue brief, SHADAC also developed infographics for all 50 states and the District of Columbia. These infographics present trends in state-level alcohol-involved death rates from 2000-2019, show how each state's 2019 rate compares to the national average, and provide a glimpse into how 2019 alcohol-involved death rates and opioid overdose death rates compare in each state.
Below are a few highlighted findings from the issue brief.
National and State Alcohol-Related Death Rates Trending Upward Since 2006
After years of stability, deaths from total alcohol-involved causes increased significantly beginning in 2007 and continued to grow through 2019, which is the most recent year for which data are available. Since 2006, death rates from total alcohol-related causes grew significantly in 11 out of 13 years, increasing by 49% overall between 2006 and 2019.
U.S. alcohol-involved death rates, 2000-2019
From 2006 to 2019, death rates from total alcohol-involved causes increased significantly in nearly all states, with 48 states seeing increases during this time. Only two states (Alaska and Hawaii) had statistically unchanged rates, while the District of Columbia saw a statistically significant decline in alcohol-involved death rates.
Wide State Variation in Alcohol-Involved Death Rates, with Rates Higher in the Western U.S.
Although almost all states experienced statistically significant increases in alcohol-involved deaths since 2006, there was a wide variation in death rates across the states. For instance, in 2019, New Mexico had the highest death rate from alcohol-involved causes, at 34.3 deaths per 100,000 people, which was almost six times the lowest rate of 5.9 deaths per 100,000 people in Hawaii.
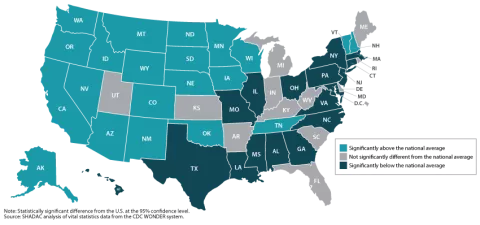
A map of state alcohol-involved death rates compared to the U.S. rate illustrates a regional pattern, with the highest death rates largely found in the western portion of the country. Of the 21 states with alcohol-involved death rates that were significantly higher than the U.S. rate of 10.4 deaths per 100,000 people in 2019, all but three (New Hampshire, Tennessee, and Vermont) were found west of the Mississippi River. Additionally, only four states west of the Mississippi (Hawaii, Louisiana, Missouri, and Texas) had alcohol-involved death rates that were significantly lower than the U.S. rate.
State alcohol-involved death rates per 100,000 compared to the U.S. rate, 2019
National Alcohol-Involved Death Rates Varied Widely by Race/Ethnicity, but All Groups Saw Increases
Between 2006 and 2019, all racial and ethnic groups that we examined experienced statistically significant increases in their alcohol-involved death rates. However, there was still wide variation in alcohol-involved death rate patterns between them.
In 2019, American Indian and Alaska Native people had the highest total alcohol-involved death rate, at 50.5 deaths per 100,000 people, which was significantly above the overall population rate of 10.4 deaths per 100,000 people. The 2019 rate for American Indian and Alaska Native people was also 64 percent higher than their 2006 rate of 30.8 deaths per 100,000 people, representing the largest increase among racial and ethnic groups.
White people had the second-highest alcohol-involved death rate in 2019, at 11.1 deaths per 100,000 people, which was significantly higher than the overall population rate. Their rate has increased 61 percent since 2006 (when the rate was 6.9 deaths per 100,000 people), which was the second largest increase among racial and ethnic groups.
U.S. alcohol-involved death rates by race/ethnicity, 2006 and 2019
For further analysis, including an examination of national alcohol-related death rates by age, sex, and urbanization, see the full SHADAC issue brief.
About the Data
SHADAC accesses vital statistics data from the Centers for Disease Control and Prevention, National Center for Health Statistics, via the CDC Wonder Database.
Except where otherwise indicated, rates of suicide deaths presented here are age-adjusted. Rates and standard errors were obtained from the CDC Wonder Database using ICD-10 cause of death codes for a limited set of health conditions considered by the CDC to be 100 percent attributable to alcohol as the primary cause of death. viii Additionally, we only include deaths in which an alcohol-attributable cause was listed as the “underlying cause of death” (i.e., the direct cause), rather than including deaths in which an alcohol-attributable cause was listed as a “multiple causes of death” (i.e., a contributing cause).
Explore the Data
Alcohol-involved death rate data from the CDC WONDER Database can be accessed on SHADAC’s State Health Compare. Data are available for the years 2000 to 2019 for the U.S. and all 50 states and the District of Columbia, and can be analyzed by age, sex, race/ethnicity, and metropolitan status.
i Grossman, E.R., Benjamin-Neelon, S.E., & Sonnenschein, S. (2020). “Alcohol Consumption during the Covid-19 Pandemic; A Cross-Sectional Survey of US Adults.” Int J Environ Res Public Health 17(24): 9189. Doi: https://dx.doi.org/10.3390%2Fijerph17249189
ii Pollard, M.S., Tucker, J.S., & Green, H.D. (2020). “Changes in Adult Alcohol Use and Consequences During the COVID-19 Pandemic in the US.” JAMA Netw Open 3(9): :e2022942. doi:10.1001/jamanetworkopen.2020.22942
iii American Psychological Association. (2021). “One year later, a new wave of pandemic health concerns.” American Psychological Association. Available at https://www.apa.org/news/press/releases/stress/2021/one-year-pandemic-stress
iv https://pubs.niaaa.nih.gov/publications/surveillance-covid-19/COVSALES.htm#fig1
v https://jamanetwork.com/journals/jamanetworkopen/fullarticle/2770975
vi https://www.ncbi.nlm.nih.gov/pmc/articles/PMC7763183/
vii https://www.tandfonline.com/doi/full/10.1080/00952990.2020.1832508
viii https://www.cdc.gov/alcohol/ardi/alcohol-related-icd-codes.html


