Housing affordability continues to be a challenge in many states, especially those with rising housing costs and large low-income populations. It is important to understand how renters’ experiences with housing affordability vary across metropolitan statuses as well as how this relationship varies by state.
The Unaffordable Rents measure currently available on SHADAC’s State Health Compare is an indicator of housing affordability that measures the percent of rental households that spent more than 30 percent of their household’s monthly income on rent at the state and national level. This measure is now available to be broken down by households’ metropolitan status, a significant determinate of housing affordability.
Households' metropolitan status is determined at the public use microdata area (PUMA) level. Households are classified as metropolitan (“metro”) if their PUMA lies entirely inside a metropolitan statistical area (MSA) and are classified as non-metropolitan (“non-metro”) if their PUMA lies entirely outside an MSA. Households are classified as indeterminate metropolitan status (“indeterminate”) if their PUMA lies partially inside an MSA.
Analysis of the this data by SHADAC researchers reveals that while the majority of the nation’s rental households are located in metropolitan areas, nearly three in ten households in non-metropolitan and indeterminate metropolitan areas rent rather than own their homes—highlighting the disparities between characteristics of populations most affected by housing affordability issues.
Unaffordable rents by metro status stable over time
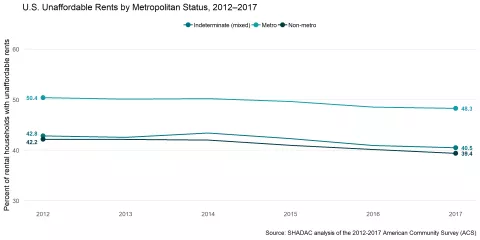
The share of rental households with unaffordable rents has been relatively stable across all metropolitan statuses between 2012 and 2017, though several states experienced small but statistically significant decreases in rates of unaffordable rents across metro statuses.
State variation in unaffordable rents by metro status
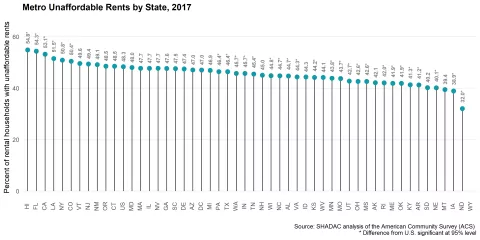
Looking at the state level, substantial variation is present in the share of metro rental households with unaffordable rents in 2017, ranging from 32.0% in North Dakota to 54.8% in Hawaii. In 23 states the share of metro households with unaffordable rents was below the national average; the share of metro households with unaffordable rents was above the national average in six states (California, Colorado, Florida, Hawaii, Louisiana, and New York), and more than half of metro rental households in these states had unaffordable rents.
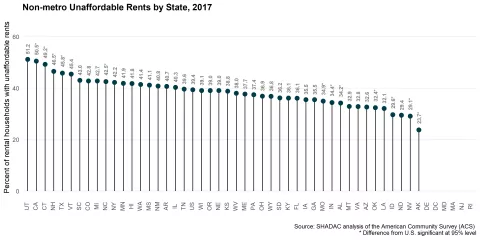
There was also substantial variation across states in the share of non-metro rental households with unaffordable rents in 2017, ranging from 23.7% in Alaska to 51.2% in Utah. In seven states, the share of non-metro households with unaffordable rents was below the national average; the share of non-metro households with unaffordable rents was above the national average in five states.
Disparities in unaffordable rents by metro status vary by state
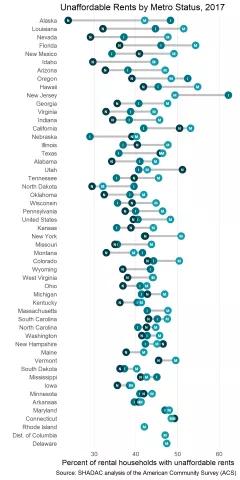
There were substantial disparities across the states in rates of unaffordable rents by metro status. In 2017, 31 states had significant differences in rates of unaffordable rents by metro status. Fifteen states saw the greatest margins between metro and non-metro areas; twelve had the widest gap between metro and indeterminate metro areas; one saw significant difference between indeterminate and metro areas; and three saw disparities between indeterminate metro and non-metro areas. The gap between the lowest and highest state-level rates of unaffordable rents by metro status ranged from 0.8 percentage points in Connecticut to 24.6 percentage points in Alaska.
Metro rental households were most likely to have unaffordable rents at the national level and in 13 states. Indeterminate rental households in indeterminate areas were most likely to have unaffordable rents in two states (NJ and OR). Non-metro rental households were least likely to have unaffordable rents in six states (AL, AK, ID, LA, OK and OR). Rates of unaffordable rents by metropolitan status were statistically equivalent in 18 states.
Learn more about the estimates used in this analysis, as well as other measures related to social determinants of health, at State Health Compare. For more on how statistics are calculated using significance testing our methodological technical brief can be found here.
Related Reading
Examining Unaffordable Rents as a Social Determinant of Health (Infographics)


