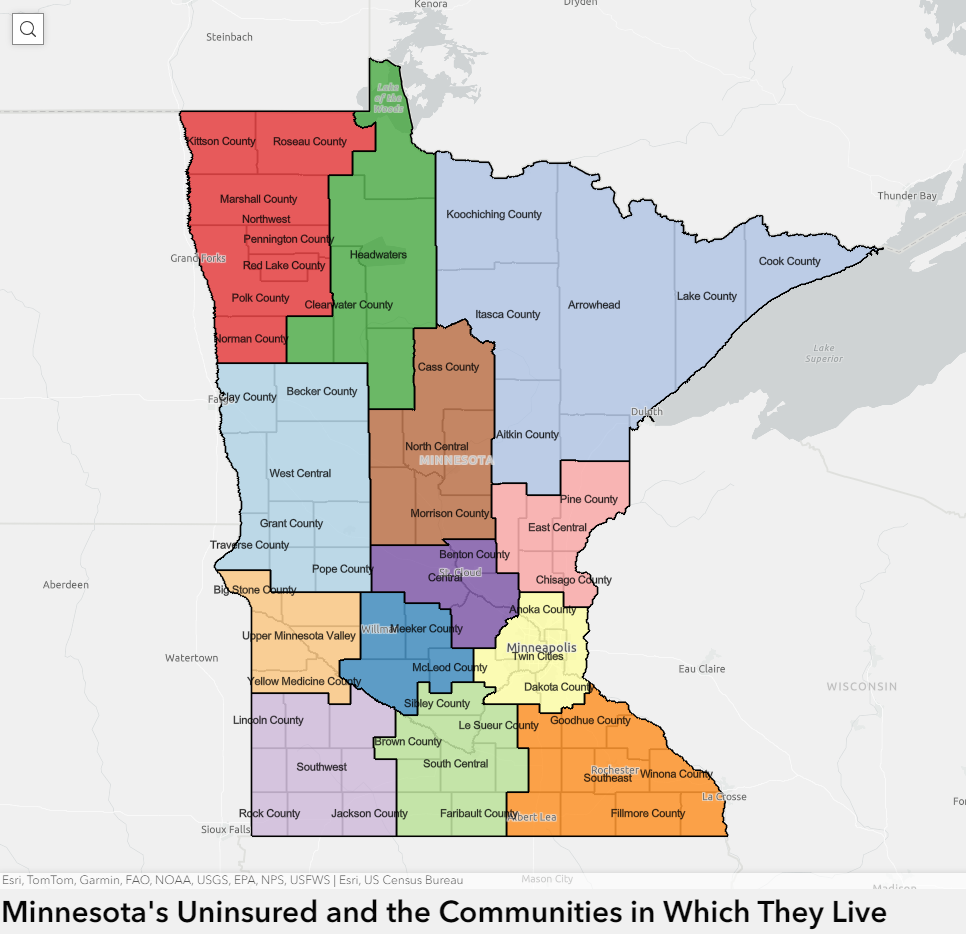
SHADAC has made some exciting updates to our resource, “Minnesota’s Community and Uninsured Profile.” This profile, created with funding from the Blue Cross and Blue Shield of Minnesota Foundation, was designed to provide accessible information to policymakers and community members alike on Minnesota uninsured people and populations.
Along with updating the profile with 2022 American Community Survey data, researchers have also updated and added to the interactive map of Minnesota that allows users to visually explore the information & data, including information on Minnesotan communities' social vulnerability index. Our hope is that this update will make it even easier for people to:
- Explore the varied communities in the state
- Evaluate community needs
- Monitor equity initiatives, and
- Inform strategic planning
Let’s take a look at the major updates we’ve made to both the profile and its accompanying interactive map:
1. Social Vulnerability Index (SVI) Added to Interactive Map at the Zip Code Level
 SHADAC Researchers have added Social Vulnerability Index (SVI) ratings to the Minnesota Community and Uninsured Profile Interactive Map. What is SVI, though, and what does it mean for communities in Minnesota and beyond?
Social Vulnerability is defined by the Centers for Disease Control and Prevention (CDC) as, “the demographic and socioeconomic factors (such as poverty, lack of access to transportation, and crowded housing) that adversely affect communities that encounter hazards and other community-level stressors.” In short, it represents how vulnerable a community is to stressors, whether that’s a natural stressor (like a tornado or hurricane, for example) or human-caused (like a chemical spill, for example).
The Social Vulnerability Index (SVI) quantifies an area’s social vulnerability, assigning a numerical value that allows for comparison of different locations (counties, zip codes, etc.) to understand how different communities may respond to or be affected by hazards and stressors.
The index measures vulnerability based on four overall factors: socioeconomic status (including insurance status, educational status, housing costs, employment, poverty level), household characteristics (like age composition, English language proficiency, etc.), racial & ethnic minority status, and housing type & transportation (like multi-unit structures, mobile homes, access or lack of access to vehicle, public transit, overcrowding, etc.).
This SVI information now lives on the BCBS Minnesota Community and Uninsured Profile’s Interactive Map – users can click on each zip code area on the map revealing that area’s SVI along with other data such as rate of uninsured, population, and more. Find the map here or click on the image of the map.
2. Every Geographic Layer Now Clickable with Basic Stats
Before the latest update, users were only able to click on Zip Code Tabulation Areas (ZCTAs). Now, researchers have made it possible for users to click on various geographic layers. Along with ZCTAs, users can now click to get basic data (population, number of uninsured, and rate of uninsured) by:
- County
- Economic development region
- House district
- Senate district
- MNsure region
- And more
This allows users to view data in a larger variety of ways and view increasingly specific data in a more easily accessible way.
3. Toggle Other Relevant Factors
Researchers also updated the feature allowing users to toggle relevant indicators on the map such as:
- Native American reservation locations & names
- Hospitals
- Schools
- County seat
- And more
These relevant factors can have large impacts on that area’s overall community makeup and social vulnerability. For example, a geographic area that is close in proximity to multiple hospitals may be less socially vulnerable than a rural area that has no hospitals close by.
4. Profile Updated with Latest Available Data
Along with these key updates to the profile’s accompanying interactive map, researchers also recently updated the profile itself with 2022 American Community Survey data. Learn more about the data update in this blog post.
Start Using the Interactive Map to Learn About Minnesota’s Varied Communities
Understanding communities’ needs begins with understanding those communities and the people within them.
The Minnesota Community and Uninsured Profile was created to help people better understand the many diverse communities within the state. It provides users with important data and information that is accessible, specific, and relevant. Its accompanying interactive map puts that data and information into a clear visual space, helping users understand how geographic location impacts communities and their needs throughout the state.
Ready to learn more about the diversity of Minnesotan communities? Start exploring the interactive map here, and check out the full profile at this link.
