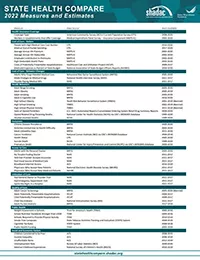
As part of our commitment to releasing relevant and timely state-level data, estimates for six measures on SHADAC’s State Health Compare web tool have recently been updated with data from the first years of the COVID-19 pandemic, 2020 and 2021. Data for each of these measures is drawn from a variety of different data sources, which are detailed in the notes below.
Measures that have been updated include:
- Alcohol-Involved Deaths (2020)
Alcohol-Involved Deaths is a newer measure that was added to State Health Compare last year. Estimates for this measure provide state-level rates of deaths that were determined to be “alcohol-induced,” as defined by the Centers for Disease Control (CDC), including deaths from conditions such as alcohol poisoning and alcoholic liver disease that CDC considers to be entirely alcohol-attributable (a full listing of which is available on the data measure homepage). Data are available for years 1999 through 2020.
- Opioid-Related Deaths (2020)
Opioid-related Drug Poisoning Deaths is a measure that encompasses all age-adjusted rates of deaths caused by drug poisoning (i.e., overdose) per 100,000 people. Users can select national and state-level estimates for this measure for comparison by individual drug types, including legal (natural and semi-synthetic opioids; synthetic opioids [non-methadone]) and illegal (heroin) opioids, cocaine, and psychostimulants, as well as high-level “all opioids” and “all drugs” categories. Estimates are available from 1999 through 2020.
- Suicide Deaths (2020)
Suicide Deaths provides a measure of age-adjusted deaths from suicide per 100,000 people. Estimates can be viewed across categories that include age, sex, race/ethnicity, firearm or non-firearm method, and metropolitan status. Data are available for years 1999 through 2020.
- Premature Death (2020)
Premature Death measures the average number of years of potential life lost prior to age 75 per 100,000 persons. In addition to viewing this measure for the entire state population, data users can compare rates of premature death by race and ethnicity. Data are available for this measure for years 2000 through 2020.
- Adverse Childhood Experiences (2019-2020)
Adverse Childhood Experiences measures the percent of children (age 0–17) residing in households who had experienced no, one, or two or more adverse childhood experiences (ACEs) out of a possible nine ACEs ([1] hard to cover basics on family's income; [2] parent or guardian divorced or separated; [3] parent or guardian died; [4] parent or guardian served time in jail; [5] saw or heard parents or adults slap, hit, kick, punch one another in the home; [6] was a victim of violence or witnessed violence in neighborhood; [7] lived with anyone who was mentally ill, suicidal, or severely depressed; [8] lived with anyone who had a problem with alcohol or drugs; and [9] treated or judged unfairly due to race/ethnicity). Data users can make national and state-level comparisons of ACEs rates of by age, health insurance coverage type, parental education, poverty level, and race/ethnicity. Data are available for the two-year pooled periods 2016–2017, 2017–2018, 2018–2019, and 2019-2020.
- Unemployment Rate (2021)
Unemployment Rate measures the average annual percent of the civilian labor force (age 16 and older) that was unemployed. Individuals are defined as unemployed if they do not have a job, have actively looked for work in the prior four weeks, and are currently available for work. Users are able to compare data estimates for years 2000 through 2020 for national and state total population; however, only 2000-2020 data is available for viewing by race/ethnicity categories, as 2021 data is still forthcoming.
Notes
Data for Alcohol-involved Deaths, Opioid-related Deaths, and Suicide Deaths come from the CDC WONDER system. Data for Premature Death come from the CDC WISQARS system. Estimates for Adverse Childhood Experiences are produced using microdata from the National Survey of Children’s Health. Data for Unemployment Rate come from the U.S. Bureau of Labor Statistics’ Local Area Unemployment Statistics program.

