Authors: Robert Hest and Julia Ngep
In order for the more than 80 million Medicaid beneficiaries to access needed care in a timely manner, there must be a sufficient number of health care providers to serve these patients. There has long been concern that providers are less likely to accept Medicaid patients than patients with other types of health insurance coverage. Because Medicaid policies—and providers’ responses to those policies—differ substantially across states, state-level data is critical for monitoring the providers’ decisions to accept Medicaid patients and for understanding the factors that influence those decisions.
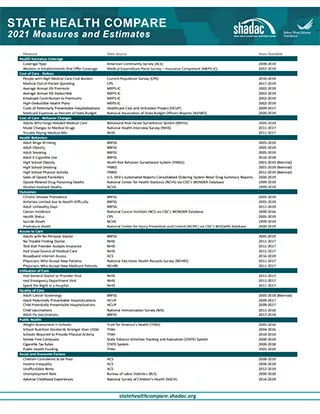
Using data from the 2011-2017 National Electronic Health Records Survey (NEHRS),1 SHADAC performed an analysis to examine and compare physician acceptance of new Medicaid patients at the state level and by physician and practice characteristics. This analysis was performed under contract with the Medicaid and CHIP Payment and Access Commission (MACPAC) and is presented in two new measures on SHADAC’s State Health Compare web tool as well as in a new MACPAC factsheet.
State Health Compare Measures
Physicians who accept new patients
Physicians who accept new patients measures the percent of physicians who accept new patients by type of coverage: private, Medicare, and Medicaid. Data years were pooled where single-year estimates were not possible and are available for 2011-2013 and 2014-2017.
In 2014-2017, state-level physician acceptance of Medicaid patients ranged from 42.2 percent in New Jersey to 99.4 percent in North Dakota, acceptance of Medicare patients ranged from 77.1 percent in Georgia to 98.3 percent in North Dakota, and acceptance of private patients ranged from 80.3 percent in the District of Columbia (D.C.) to 100.0 percent in Nebraska.
Physicians who accept new Medicaid patients
Physicians who accept new Medicaid patients measures the percent of physicians who accept new Medicaid patients by the following physician/practice characteristics:
- Setting (private solo/group versus total) available for pooled data years 2011-2012 and 2014-2017;
- The share of Medicaid existing patients (above versus below national average) available for pooled data years 2011 & 2013 and 2014-2017;
- And the ratio of mid-level providers (above versus below national average) available for pooled data years 2014-2017.
At the national level in the most recent time period: physicians in private solo/group practices were less likely to accept new Medicaid patients compared to all physicians (70.4% versus 74.0%); physicians with an above-average share of existing Medicaid patients were more likely to accept new Medicaid patients compared to all physicians (87.4% versus 63.8%); and physicians with an above-average ratio of mid-level providers were more likely to accept new Medicaid patients compared with all physicians (80.5% versus 73.7%).
New MACPAC Factsheet
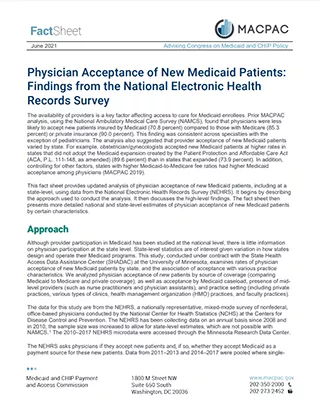
Physician Acceptance of New Medicaid Patients: Findings from the National Electronic Health Records Survey
This new MACPAC factsheet analyzes physician acceptance of new Medicaid patients at the national and state levels. As Medicaid programs vary by each state and there is little information on physician participation in Medicaid at the state level, this analysis provides an important update of previous MACPAC work analyzing physician acceptance at the national level and prior literature analyzing state-level physician acceptance, last updated for data year 2013.
The analysis found significant differences in rates of physician acceptance of new patients by coverage type, with physicians being more likely to accept private and Medicare patients compared with Medicaid patients. Acceptance of Medicaid patients varied significantly by state and by various patient, physician, and practice characteristics. These include source of patient coverage (Medicaid, Medicare, and private), physician specialty, practice setting, existing Medicaid caseload, and presence of mid-level providers. The analysis found that nationally, rates of physician acceptance were stable over time and increased significantly in a handful of states, with no states experiencing significant decreases in rates of acceptance.
1 Data for 2016 was not released by National Center for Health Statistics (NCHS), which conducts the NEHRS. Data were unavailable by setting in data year 2013; data were unavailable by share of existing Medicaid patients for data year 2012; and data were unavailable by ratio of mid-level providers for data years 2011-2013.
New Resources Explore Physician Acceptance of New Medicaid Patients


