Using the new detail level data available from the American Community Survey (ACS), SHADAC has produced state and county level tables and state-level maps on coverage that are available here. This blog provides an overview of the type of information that is available in the state profiles.
Uninsured Rates by Characteristic for Each State
For each of the 50 states, D.C. and Puerto Rico, SHADAC has produced a 2-page profile that includes uninsured rates by characteristics including:
- Age
- Race
- Citizenship status
- Education
- Work experience
- Income
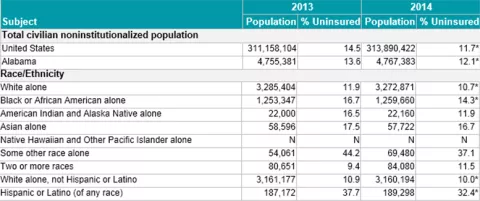
By accessing these tables, you can get information about the number and percent of uninsured within specific population segments. For example, the table below shows that in Alabama 14.3% of blacks were uninsured in 2014, a drop from 16.7% in 2013.
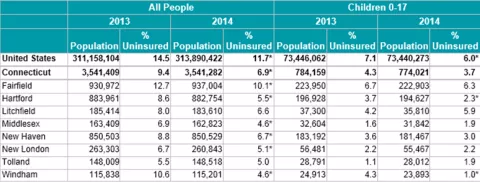
In addition, the state profiles contain a comparison of 2013 and 2014 uninsurance rates for large counties in the state (e.g. counties with a population greater than 65,000). For example, the table below shows that in Hartford County Connecticut 5.5% of all people and 2.3% of children were uninsured in 2014, a drop from 8.6% and 3.7% in 2013, respectively.


