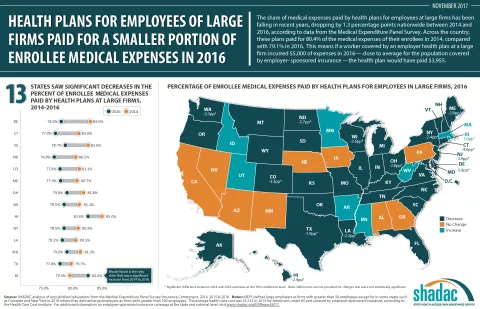
The share of medical expenses paid by health plans for employees at large firms has been falling in recent years, dropping by 1.3 percentage points nationwide between 2014 and 2016, according to data from the Medical Expenditure Panel Survey. Across the country, these plans paid for 80.4% of the medical expenses of their enrollees in 2014, compared with 79.1% in 2016.
This means if a worker covered by an employer health plan at a large firm incurred $5,000 of expenses in 2016—close to the average for the population covered by employer-sponsored insurance [1]—the health plan would have paid $3,955. (Text continues below infographic.)
THE STATE STORY
In all, 13 states saw significant decreases from 2014 to 2016:
- Delaware -5.0pp (83.0% to 78.0%)
- Connecticut -4.0pp (81.0% to 77.0%)
- New Jersey -3.9pp (82.6% to 78.7%)
- North Dakota -3.7pp (80.5% to 76.8%)
- Colorado -3.3pp (81.1% to 77.8%)
- Maine -2.8pp (80.7% to 77.9%)
- Ohio -2.8pp (81.8% to 79.0%)
- Wisconsin -2.6pp (81.1% to 78.5%)
- Hawaii -2.4pp (85.0% to 82.6%)
- New York -2.4pp (80.9% to 78.5%)
- Louisiana -2.3pp (80.5% to 78.2%)
- Washington -2.3pp (81.3% to 79.0%)
- Texas -1.9pp (79.7% to 77.8%)
Rhode Island is the only state that saw a significant increase in the percentage of medical expenses paid by health plans for employees at large firms, with a 3.0 percentage-point increase from 2014 to 2016 (from 79.5% to 82.5%).
In all, 36 states saw no significant change in the percentage of medical expenses paid by employer plans from 2014 to 2016.
Source: SHADAC analysis of unpublished tabulations from the Medical Expenditure Panel Survey/Insurance Component, 2014, 2015 & 2016.
*MEPS defines large employers as firms with greater than 50 employees except for in some states such as Colorado and New York in 2016 where they defined large employers as firms with greater than 100 employees.
For additional information on employer-sponsored insurance coverage at the state and national level, visit www.shadac.org/ESIReport2017.
[1] Health Care Cost Institute. November 2016. “2015 Health Care Cost and Utilization Report.” Available at http://www.healthcostinstitute.org/report/2015-health-care-cost-utilization-report/

