|
BRFSS SPOTLIGHT SERIES OVERVIEW |
Click on the infographic image to enlarge
Adult Obesity
For the final post in our BRFSS Spotlight Series blog, we focused on trends in adult obesity rates. Though much attention has been paid to issues such as the opioid crisis or the rapid rise in youth vaping and e-cigarette use, the prevalence of obesity in the United States since the 1980s has made this one of the longest-running, currently declared public health emergencies in the nation.1
“Obesity” is defined as a Body Mass Index (BMI) of 30 and over, and the measure of “Adult Obesity” from the BRFSS encapsulates the self-reported prevalence of obesity among adults for the civilian non-institutionalized population 18 years and over. In using these BRFSS estimates, it is important to understand that self-reported data like these underestimates obesity rates as compared with the measured data from the National Health and Nutrition Examination Survey (NHANES). A 2016 research article from Ward et al. demonstrates a bias correction method for the BRFSS estimates that is beyond the scope of this analysis, but may be of interest to researchers.
Trends in Obesity Rates from 2017 to 2018*
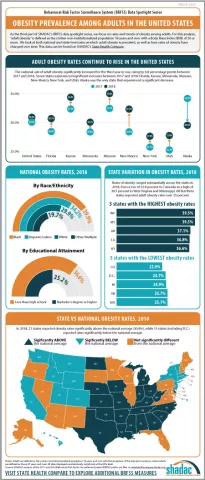
The rate of adult obesity significantly increased for the third year in row nationwide from 2017 to 2018, rising by 0.8 percentage points to 30.9 percent from 30.1 percent in 2017.
Seven states experienced statistically significant increases in the rate of adult obesity from 2017 to 2018: Florida, Kansas, Minnesota, Missouri, New Mexico, New York, and Utah. Alaska was the only state to experience a statistically significant decline in the rate of obesity, decreasing 4.6 percentage points from 34.2 percent in 2017 to 29.5 percent in 2018.
Overall, however, a large majority of states (43 including D.C.) did not experience a statistically significant change in obesity rates from 2017.
State Variation (2018)
Rates of obesity ranged substantially across the states in 2018, from a high of 39.5% in West Virginia and Mississippi to a low of 22.9% in Colorado. When compared to the national rate…
- 21 states had obesity rates that were significantly higher.
- 15 states (including DC) had obesity rates that were significantly lower.
- 15 states had obesity rates that were not statistically different.
Persistently high rates of obesity are concerning in their own right, but also because obesity increases the risk for other serious health conditions such as heart disease, diabetes, stroke, and certain types of cancers, among many others.2
Unfortunately, current projections for the future indicate that the already high rates of obesity in America will only continue to increase. Without new interventions to prevent the spread of obesity, a new study using data from the BRFSS and published in the New England Journal of Medicine predicts that by 2030, nearly half of the United States population (48.9 percent) will be considered obese, with over a quarter of the nation registering as severely obese.
Notes
*All differences described here are significant at the 95% level of confidence unless otherwise specified.
For this analysis, adults are defined as those age 18 and over.
Estimates are from SHADAC analysis of the 2018 Behavioral Risk Factor Surveillance System and are available on State Health Compare.
1 Centers for Disease Control and Prevention (CDC). (1999, October 26). Obesity epidemic increases dramatically in the United States: CDCD director call for national prevention effort. Retrieved from https://www.cdc.gov/media/pressrel/r991026.htm
Health tidbits. (1999). J Natl Med Assoc, 91(12), 645. https://www.ncbi.nlm.nih.gov/pmc/articles/PMC2608606/
2 Centers for Disease Control and Prevention (CDC). (2020, February 4). Adult obesity causes & consequences. Retrieved from https://www.cdc.gov/obesity/adult/causes.html#Consequences

