|
BRFSS SPOTLIGHT SERIES OVERVIEW |
Click on the infographic image to enlarge
Adult Binge Drinking*
For this second post in our BRFSS Spotlight Series blog, we focus on an analysis of our Adult Binge Drinking measure (for which all differences described are statistically significant at a 95% confidence level unless otherwise specified). “Binge drinking” is defined by the Centers for Disease Control and Prevention (CDC) in the BRFSS as “drinking 5 or more drinks on an occasion for men or 4 or more drinks on an occasion for women" in the past 30 days.1
Over the past five years, adult binge drinking at the national level has increased a small but statistically significant amount from 16.0 percent in 2014 to 16.4 percent in 2018. For this analysis we also examined binge drinking by educational attainment, and found that adults (25 years and over) with a bachelor’s degree or higher in the U.S. reported a binge drinking rate of 15.7 percent in 2018, up from 15.3 percent in 2014 (percentage point difference was not statistically significant); and adults with less than a high school degree reported a rate of 13.5 percent in 2018, up from 12.8 percent in 2014.
Trends in Binge Drinking Rates from 2017 to 2018
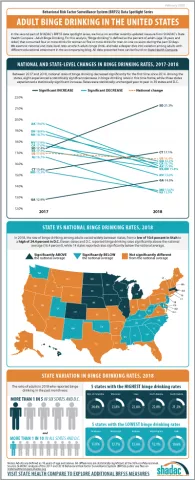
Nationally, rates of binge drinking fell by 0.6 percentage points from 17.0 percent in 2017 to 16.4 percent in 2018—the first decrease since 2014. Statistically significant decreases in rates of binge drinking were seen in eight states: Alaska, California, Kansas, Maryland, New Hampshire, New Jersey, Nevada, and Ohio. Rates of binge drinking were statistically unchanged year to year in 39 states and D.C. Rates of binge drinking increased significantly in three states from 2017 to 2018: South Dakota, which experienced an increase of 3.9 percentage points (17.4 percent to 21.3 percent); Connecticut, which saw a 1.7 percentage-point increase (15.4 percent to 17.1 percent); and Georgia, with an increase of 1.6 percentage points (12.9 percent to 14.5 percent) between the two years.
State Variation (2018)
In 2018, rates of binge drinking varied widely between states, from a low of 10.6 percent in Utah to a high of 24.4 percent in D.C. Eleven states and D.C. reported rates of binge drinking above the national average (16.4 percent), and 14 states reported rates that fell below.
More than one in five adults reported binge drinking in the past month in six states—Iowa, Minnesota, Nebraska, North Dakota, South Dakota, and Wisconsin—and D.C., of which all but the latter were Midwest or Plains states.
Binge Drinking Rates across Education Levels+
Nationally, adults with less than a high school education were 14.1 percent less likely to report binge drinking compared to adults with a bachelor’s degree or higher level of education (13.5 percent vs. 15.7 percent).
Among the 48 states and D.C. where estimates of binge drinking among adults with a less than a high school education were statistically reliable^:
- Utah was both the only state where adults with less than a high school education were statistically more likely to report binge drinking than adults with a bachelor’s degree or higher, and also the state with the largest relative gap (89.2 percent) in binge drinking rates by education (14.7 percent vs. 7.8 percent).
- Adults with less than a high school education were statistically less likely to report binge drinking compared to adults with a bachelor’s degree or higher in 14 states, and the size of this gap varied from a low of 19.4 percent in Minnesota (15.1 percent vs. 18.8 percent) to a high of 56.6 percent in Missouri (7.8 percent vs. 17.9 percent).
- There was no statistically significant difference between these groups’ rates of binge drinking in 33 states and D.C.
This analysis follows recent trends reported by the Centers for Disease Control and Prevention, which indicates binge drinking is more common among people of higher educational levels and with household incomes of $75,000 or more. Individuals with lower incomes and educational levels in the U.S., however, consume more binge drinks (i.e., number of drinks in a binge drinking occasion) per year.2
Notes
All differences described in the post are statistically significant at the 95% confidence level unless otherwise specified.
* Rate of binge drinking among adults for the civilian noninstitutionalized population 18 years and over.
+ For the education analysis, adults are defined as those age 25 and older.
^ Estimates were considered statistically unreliable if the standard error was more than 30% as large as the estimate (i.e., RSE > 30%) - in this instance, estimates were statistically unreliable for Alaska and New Jersey.
References
1Centers for Disease Control and Prevention (CDC). (2020, January 2). Data on excessive drinking. Retrieved from https://www.cdc.gov/alcohol/data-stats.htm.
There is some differentiation between agencies (such as the CDC, National Institute of Alcohol Abuse and Alcoholism [NIAAA], and the National Institute of Health [NIH]) over whether binge drinking is defined as four drinks for women and five drinks for men on “one occasion” or “within a two-hour period,” but the question included in the BRFSS uses the “on one occasion” phrasing.
2 Kanny D, Naimi TS, Liu Y, Lu H, Brewer RD. (2018). Annual total binge drinks consumed by U.S. adults, 2015. Am J Prev Med, 54(4), 486-496.

