The suicide death rate for the United States reached another historic high in 2018, rising to 14.2 deaths per 100,000 people from 14.0 in 2017, according to new vital statistics data from the U.S. Centers for Disease Control and Prevention (CDC). This newest jump continues a decades-long increase in death rates from suicide in the U.S.—a trend that predates the current COVID-19 pandemic, which early evidence indicates is taking a significant toll on mental health.
According to a recent national poll by the Kaiser Family Foundation, more than half of respondents (56%) reported that worry or stress related to the pandemic has led to at least one negative effect on their mental health, such as trouble sleeping or eating, increased alcohol use, or worsening chronic conditions. While experts will look to suicide rates as one important indicator of the mental health impact of COVID-19, data on suicide deaths for the current period will not be available until next year at the earliest. In the meantime, new data from 2018, estimates of which can be found on the SHADAC State Health Compare web tool, provide an updated baseline to help understand potential changes during COVID-19.
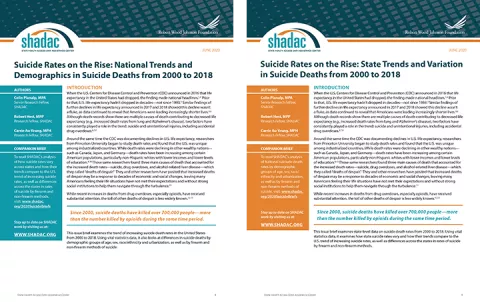
Two new SHADAC briefs draw on this data to present trends and variations in suicide death rates across the nation, among the states, and by subpopulation breakdowns from 2000 to 2018. The briefs paint a picture of the current landscape of suicide deaths—highlighting geographic areas and demographic groups that warrant particular attention as mental health stressors increase nationwide.
The first brief looks at national trends and demographics in suicide deaths, and the second brief looks at state trends and variations. Below are highlighted findings from the two briefs.
National Trends and Demographics in Suicide Death Rates from 2000 to 2018
The 2018 U.S. suicide death rate of 14.2 per 100,000 people represents a 37% increase from the 2000 rate of 10.4 deaths per 100,000 people—an additional 3.8 deaths per 100,000 people per year. This increase represents about 110,000 more lives lost than if the U.S. suicide rate had remained steady.
The increase in suicide deaths has not followed a consistent trend; rather, growth has accelerated more recently. From 2000 to 2009 the suicide death rate grew by 13 percent, but from 2009 to 2018 the rate grew by 21 percent.
Suicide Deaths by Age
- In 2018, children age 10-14 had the lowest suicide rate, at 2.9 per 100,000. This was the only rate we examined that was lower than the overall rate of 14.8 per 100,000.1 However, this age group experienced the largest increase in suicide rates from 2000 to 2018, at 95 percent.
- Adults age 55-64 had the highest suicide death rate in 2018, at 20.2 per 100,000.
Suicide Deaths by Sex
- In 2018, the suicide rate for males was 22.8 per 100,000, while the suicide rate for females was 6.2 per 100,000. However, the suicide rate increased more for females (56 percent) than for males (28 percent) from 2000 to 2018.
Suicide Deaths by Race/Ethnicity
- In 2018, American Indians and Alaska Natives had the highest suicide death rate at 22.1 per 100,000 people, significantly higher than the overall population rate of 14.2 per 100,000. Whites had the second-highest rate at 18.0 per 100,000, which was also significantly higher than the overall rate.
- Asians and Pacific Islanders, Blacks, and Hispanics registered similar rates of suicide death in 2018 (7.0, 7.2, and 7.4 per 100,000, respectively), all of which were significantly lower than the overall population rate.
- Rates of death from suicide have increased significantly across all races and ethnicities from 2000 to 2018. However, suicide death rates increased more rapidly among American Indians and Alaska Natives than among other groups, with American Indians and Alaska Natives seeing an 86 percent increase in suicide deaths since 2000.
For further analysis, including an examination of suicide death rates by urbanization and cause of death (i.e., firearm vs. non-firearm), see the full SHADAC issue brief on suicide rates at the national level.
State Trends and Variation in Suicide Death Rates from 2000 to 2018
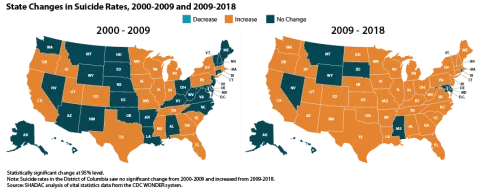
State-level trends in suicide death rates suggested a pattern of acceleration similar to the national one described above: From 2000 to 2009, 22 states experienced statistically significant increases in their suicide rates, whereas from 2009 to 2018, 41 states experienced significant increases.
State Variation
-
41 states and the District of Columbia experienced significant increases in suicide death rates between 2000 and 2018. Increases ranged from a low of 14 percent in Maryland, where rates grew from 9.0 to 10.2 suicide deaths per 100,000 people, to a high of 97 percent in the District of Columbia, where rates grew from 3.8 to 7.5 deaths per 100,000.2
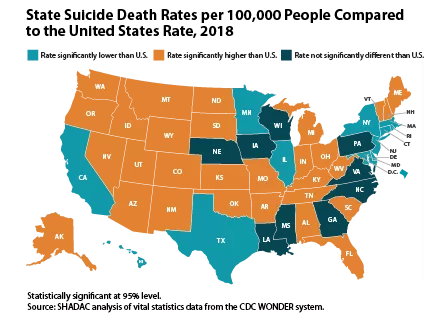
- Wyoming had the highest 2018 suicide rate at 25.2 deaths per 100,000 people, and the District of Columbia had the lowest rate at 7.5 deaths per 100,000 people.
- Twelve states and the District of Columbia had suicide death rates in 2018 that were significantly lower than the overall U.S. rate (14.2 deaths per 100,000 people), 9 had rates that were statistically equivalent to the U.S. rate, and 29 had rates that were significantly higher than the U.S. rate.
For further analysis, including an examination of state-level suicide death rates by cause of death, see the full SHADAC issue brief on suicide rates at the state level.
About the Data
SHADAC accesses vital statistics data from the Centers for Disease Control and Prevention, National Center for Health Statistics, via the CDC WONDER Database.
Except where otherwise indicated, rates of suicide deaths presented here are age-adjusted. Rates and standard errors were obtained from the CDC Wonder Database using ICD-10 cause-of-death codes U03 (Suicide terrorism); X60-X84 (Intentional self-harm); and Y87.0 (Sequelae of intentional self-harm).
Explore the Data
Suicide death rate data from the CDC WONDER Database can be accessed on SHADAC’s State Health Compare data tool. Data are available for the years 1999 to 2018 for the U.S. and all 50 states and the District of Columbia, and can be analyzed by age, sex, race/ethnicity, metropolitan status, and firearm vs. non-firearm cause of death.
Related Research
Like the Kaiser Family Foundation (KFF), SHADAC recently fielded a survey that asked a nationally representative sample of U.S. adults about changes in their stress levels in response to the COVID-19 pandemic as well as how they were coping with coronavirus-related stress. Results from the survey echoed the troubling findings from KFF, with over 90% of respondents reporting increased stress levels, and nearly 74% correspondingly reporting increased use of coping mechanisms in response to rising stress—including those with negative consequences, such as eating more (and more unhealthy foods) and increased alcohol consumption, smoking, and vaping.
1 When analyzing suicide rates by age groups, the rates cannot be age-adjusted as for other portions of this analysis. Because of that, we use an overall U.S. suicide rate that is not age-adjusted when analyzing age groups, so that rate varies slightly from the rate presented elsewhere in this analysis.
2 Although the District of Columbia’s suicide rates are relatively low compared to other states, its suicide death rates also are relatively volatile year-to-year. For example, its suicide death increased about 70 percent from 2000 to 2001, whereas its rate decreased about 40 percent from 2008 to 2009.


