As states roll out the vaccines to the first phases of recipients, planning is already underway for subsequent phases of vaccination for the broader public. However, these plans will need to adapt to operation on a much larger scale in order to reach experts’ recommended vaccination thresholds of 70-90% in order to achieve “herd immunity,” as well as respond to Dr. Anthony Fauci’s recent declaration of a vaccine “open season” by April—that essentially any member of the general public who wants a vaccine will be able to get one.
To aid states in developing campaigns to achieve these ambitious targets, SHADAC researchers have recently published a number of resources—including an issue brief funded by the California Health Care Foundation—looking to the nation’s previous experiences with implementing another mass vaccination campaign: influenza. By using past flu vaccination rates as a proxy for understanding challenges to widespread vaccination, states can plan for challenges in coronavirus vaccination.
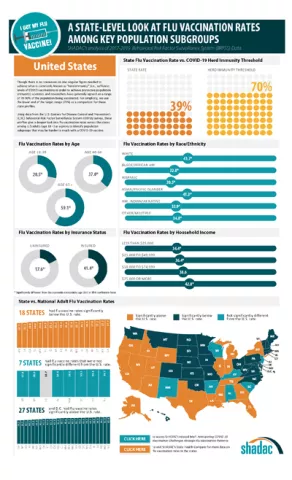
Adding to this group of resources, SHADAC has produced a set of two-page infographics focused on flu vaccination rates for adults (age 18+) using data for all 50 states and the District of Columbia (D.C.) from the Behavioral Risk Factor Surveillance System (BRFSS) survey. The infographics provide comparisons for individual state flu vaccine rates to a COVID-19 herd immunity target and also highlight vaccination rates for individual states as compared to by a number of demographic categories, including age, race/ethnicity, household income level, insurance status, chronic conditions, access to care, and educational attainment.
| HIGHLIGHTS |
National COVID-19 vaccination hurdles
COVID-19 vaccination campaigns face a number of stumbling blocks to effective implementation, including general and specific groups’ vaccine hesitancy, the potential for overpromising and under-delivering on vaccine distribution, a lack of available vaccine doses, for example.
However, as flu vaccination data demonstrate, much work must be done to address issues of vaccine distribution in order to achieve population-level immunization from the novel coronavirus. Only 38.7 percent of U.S. adults reported getting a flu shot during the survey years of 2017-2019—barely more than half the minimum anticipated 70 percent target for herd immunity.
Data from various segments of the national population also show low adult vaccination rates across specific demographic groups. For instance, vaccination rates were significantly lower than the national average for American Indian and Alaska Natives (33.9 percent), Black adults (32.8 percent), and Latino people (30.9 percent).
Younger adults (age 18-39) were also significantly less likely to receive a flu vaccine, at 28.5 percent, as were adults with incomes below $25,000 (34.8 percent), those who reported having no personal doctor (20.1 percent), and people without health insurance, reporting the lowest rate at just 17.6 percent.
State variation in flu vaccination rates
While the Biden administration has signaled plans to take an active role in the distribution and administration of the COVID-19 vaccines, responsibility for the rollout has still largely been borne by the states. It is therefore important that each individual state understands the specific needs of not only their residents broadly, but also by subpopulations, some of whom are more likely than others to require targeted outreach efforts in a vaccination campaign strategy.
Examining adult flu vaccinations across the states shows wide variation in rates. Eighteen states had vaccination rates significantly below the U.S. average, with Nevada having the lowest at 32.7 percent; just seven did not differ significantly from the U.S. rate; and 27 states and the District of Columbia (D.C.) had vaccination rates significantly higher than the U.S.
While the fact that over half of states are above the national average in flu vaccination is a good initial sign, even the highest individual state rate of 45.4 percent in North Carolina unfortunately falls far short of the minimum goal of 70% vaccination for COVID-19 herd immunity. This discrepancy between actual rates of vaccination and goals for coronavirus vaccination campaigns underscores the need to not only examine rates at state levels, but to further break down data to understand the specific needs of states’ populations by demographic subgroups.
For instance, continuing to look at North Carolina, with the highest state vaccination rate, and Nevada, with the lowest, both states face similar barriers in overcoming low vaccination rates among individuals without health insurance coverage (21.8 percent and 14.4 percent, respectively; less than half the rates among those with insurance) and those without a personal doctor (23.8 percent and 17.5 percent; again less than half of flu vaccination rates among adults who report having a personal doctor). However, when analyzing vaccination rates by race and ethnicity, American Indian and Alaska Natives and those reporting “Other/multiple” race in North Carolina each had vaccination rates significantly lower than the overall state rate (33.7 percent and 36.0 percent, respectively), while the same groups in Nevada reported rates of vaccinations higher than the overall adult population (39.3 percent for American Indian and Alaska Natives and 34.7 percent for “Other/multiple” races).
Conclusions
While state and federal organizations continue to build and ramp up data collection on COVID-19 vaccines, looking to flu vaccination rates in the meantime can provide important guidance for understanding the challenges faced in mounting large scale COVID vaccination campaigns, especially in focusing targeted outreach efforts on population subgroups that need it most.
These two-page infographics provide important and detailed information on vaccination rates not only by state, but by demographic categories, as well as how their rates differ from state and national averages for the most recent data years available, 2017-2019.
|
State Health Compare Flu Vaccination Data Click here to explore the flu vaccination measure further on State Health Compare |
Further Reading and Resources
Anticipating COVID-19 Vaccination Challenges through Flu Vaccination Patterns
SHADAC Brief, January 2021
New Brief Examines Flu Vaccine Patterns as a Proxy for COVID – Anticipating and Addressing Coronavirus Vaccination Campaign Challenges at the National and State Level
SHADAC Blog, January 2021
COVID-19 Vaccine Challenges: Illustrating Hurdles to Population Immunity and Equity Using Flu Vaccination Data
SHADAC Webinar, February 2021
Ensuring Equity: State Strategies for Monitoring COVID-19 Vaccination Rates by Race and Other Priority Populations
SHVS Expert Perspective, February 2021