Though still in the midst of the coronavirus pandemic, the United States continues to grapple with other national public health emergencies, such as the opioid crisis. Indeed, many public health experts have voiced concerns about the potential effects of COVID-19 on mental health and associated issues, including the rates of suicide deaths, alcohol-related deaths, and opioid and related drug overdose deaths, commonly referred to as “deaths of despair.”
SHADAC researchers have been researching these topics using vital statistics data, recently publishing an analysis of national and state suicide death rates, as well as producing this set of updated two-page infographics focused on opioid and opioid-related drug overdose deaths using the latest annual data for all 50 states and the District of Columbia. SHADAC also makes all of the 2018 data used in those infographics publicly available through our State Health Compare online data tool.*
Click on a state below to see its two-page infographic or download all state's infographics here.
HIGHLIGHTS
Background: U.S. trends in drug overdose deaths
As data have increasingly shown, the opioid crisis has continued to evolve beyond just the different classes of opioids—such as natural and semi-synthetic opioids, synthetic opioids, and heroin—to include two types of non-opioid illicit drugs that have commonly been reported in combination with opioid overdoses: cocaine and psychostimulants (such as methamphetamine).
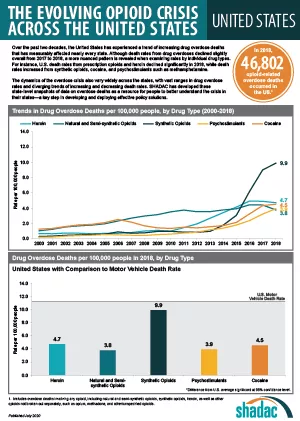
From 2000 to approximately 2011, the growth in opioid overdose deaths was driven primarily by natural and semi-synthetic opioids (i.e., prescription opioid painkillers); but that death rate has since largely plateaued. Beginning around 2011, deaths from heroin began to increase more rapidly, but reached their own plateau in 2015. Since around 2013, it is deaths from synthetic opioids (such as fentanyl) that have experienced the largest increases—a trend that continued in 2018, with the national rate from this drug category (9.9 deaths per 100,000 people) registering nearly three times as high as natural and semi-synthetic opioids (3.8 per 100,000 people) and almost double that of heroin (4.7 per 100,000 people).
Around the same time that death rates from heroin and synthetic opioids began to increase, deaths from cocaine and psychostimulants (e.g., methamphetamine) also began to rise; due in part, evidence has strongly suggested, to deaths involving multiple drugs.1 In 2018, overdose death rates for both drugs reached new highs at 4.5 per 100,000 people for cocaine and 3.9 per 100,000 people for psychostimulants.
State variation in overdose deaths
While it is important to understand the national toll of the crisis, the story at the state level shows the dynamics of this public health crisis can vary widely, both in the prevalence of overdose deaths and the types of drugs associated with those deaths.
Opioid Overdose Deaths
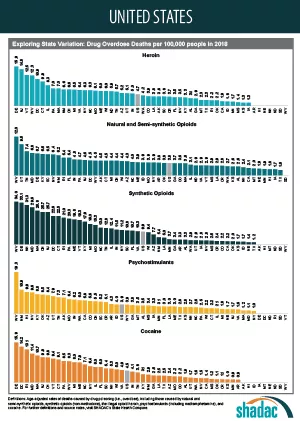
Although most states have experienced measurable increases in opioid overdose deaths between 2017 and 2018, the scale of the crisis has seen wide variation. For example, while the rate for the state with the number of deaths from synthetic opioids in 2018, West Virginia, decreased from 37.4 per 100,000 people in 2017 to 34.0 per 100,000 in 2018, this rate was still nearly 30 times the rate of the lowest state, Texas (1.2 deaths per 100,000 people).
The types of opioids most commonly associated with overdoses can also vary across states. For example, as in 2017, Utah had the second-highest rate of deaths from natural and semi-synthetic opioids in 2018, at 9.6 deaths per 100,000 people; however, contrary to the U.S. trajectory, the state’s rate of deaths from synthetic opioids remained relatively steady, at 3.1 per 100,000 people in 2017 and 2.9 per 100,000 in 2018—well below the U.S. rate of 9.9 per 100,000 people (up significantly from 9.0 per 100,000 in 2017).
Overdose Deaths from Cocaine and Psychostimulants
The scale of overdose deaths from non-opioid illicit drugs also varies widely across states. For example, the 2018 overdose death rate from cocaine was highest in Delaware at 15.9 per 100,000; the state jumped four places to overtake the District of Columbia (17.6 deaths per 100,000 people in 2017), and Delaware’s rate was 17 times that of Arkansas and Minnesota (0.9 deaths per 100,000 people).
In 2018, the state with the highest overdose death rate from psychostimulants was again West Virginia at 19.3 per 100,000 people, a significant increase from 13.6 deaths per 100,000 people in 2017; West Virginia’s rate was more than 19 times the rate of 1.0 deaths per 100,000 people in New York.
Regional Patterns in Drug Overdose Death Rates
Despite the evidence of state variation in drug overdose death rates, further analysis illustrates some broader patterns across regions that have remained fairly consistent between 2017 and 2018:
Heroin and synthetic opioids
Death rates from heroin and synthetic opioids are generally higher east of the Mississippi River, particularly among states in the Northeast, the Appalachian region, and the industrial Midwest.
Natural and semi-synthetic opioids
Higher death rates from natural and semi-synthetic opioids are more geographically dispersed than those from heroin and synthetic opioids. While some eastern U.S. states have particularly high rates of deaths from natural and semi-synthetic opioids (e.g., Maryland, Tennessee, and West Virginia), there are other states in the western U.S. that also have similarly high death rates from these drugs (e.g., Utah, New Mexico, and Nevada).
Cocaine
An examination of cocaine death rates reveals a pattern similar to that of death rates from heroin and synthetic opioids, with states east of the Mississippi River exhibiting higher rates of cocaine overdose deaths.
Psychostimulants
Death rate patterns from psychostimulants appear to be almost the opposite of those for heroin and synthetic opioids, with relatively low death rates in the Northeast and particularly high rates of deaths in the western U.S. and the Southeast. Only two states—Kentucky and West Virginia—show strong overlaps between psychostimulant and heroin and synthetic opioid deaths.
Conclusion
Some early data from the CDC show encouraging signs that progress is being made in the fight against opioids, with the national drug overdose rate declining from 2017 to 20182; however, examining trends at the state level show a more nuanced picture. While improvements have been found in key states such as Ohio, which saw significant decreases in nearly every drug category (heroin, natural and semi-synthetic opioids, synthetic opioids, and cocaine) from 2017 to 2018, other states such as Delaware have seen historic increases in their rates of overdose deaths from synthetic opioids, heroin, and cocaine (the state now ranks highest among all 50 states in the latter two drug categories) for this same time period. Because of the opioid crisis’s history of evolving and changing, it will be important to continue monitoring data on drug overdoses to track whether death rates continue to decline or experience a resurgence—possibly driven by new drugs.
Explore the drug overdose death data further on State Health Compare.
Further Reading and Resources
The Opioid Epidemic in the United States
SHADAC Resource, March 2020 (Updated)
The Evolving Opioid Epidemic: Observing the Changes in the Opioid Crisis through State-level Data
SHADAC Webinar, September 2019
The Opioid Epidemic: National and State Trends in Opioid-Related Overdose Deaths from 2000 to 2017
SHADAC Briefs, June 2019
1 Kariisa, M., Scholl, L., Wilson, N., Seth, P., & Hoots, B. (2019, May 3). Drug overdose deaths involving cocaine and psychostimulants with abuse potential—United States, 2003-2017. MMWR, 68(17), 388-395. DOI: http://dx.doi.org/10.15585/mmwr.mm6817a3
Drug Enforcement Administration (DEA) Strategic Intelligence Section. (2020). 2019 National Drug Threat Assessment [DEA-DCT-DIR-007-20]. Retrieved from https://www.dea.gov/sites/default/files/2020-01/2019-NDTA-final-01-14-2020_Low_Web-DIR-007-20_2019.pdf
Insufficient evidence exists as to whether the pattern of non-opioid illicit substances is driven primarily by unintentional contamination (e.g., drug traffickers accidentally mixing fentanyl into cocaine due to sloppy packaging) or intentional mixing of different drug types (e.g., drug traffickers purposefully blending methamphetamine and fentanyl into counterfeit prescription pills).
2 Hedegaard, H., Miniño, A.M., & Warner, M. (2020). Drug overdose deaths in the United States, 1999-2018 [Data brief No. 356]. Retrieved from https://www.cdc.gov/nchs/data/databriefs/db356-h.pdf


