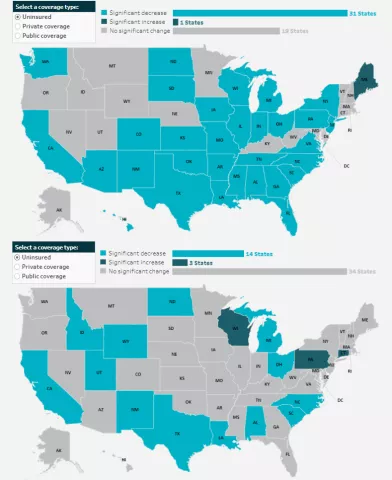
The U.S. Census Bureau has released an initial report detailing the state of health insurance coverage in the United States for 2022.
Drawing on data from the Current Population Survey Annual Social and Economic Supplement (CPS ASEC), the report highlights good news overall as the percentage of the population without health insurance coverage at any point in 2022 fell to 7.9% from 8.3% in 2021—a decrease of 0.4 percentage points or approximately 1.3 million people (25.9 million in 2022 vs. 27.2 million in 2021).
The following blog post explores changes in national-level coverage rates by demographic characteristics - such as age, employment, race and ethnicity, immigration status, poverty status, and Medicaid expansion status - for nonelderly adults (age 19-64) and for children (age 0-18). While neither group saw an overall significant change in uninsured rates, both experienced shifts across demographic subgroups.
Additionally of note, though not within the scope of this blog to explore further, elderly adults (age 65+) saw a significant increase in Medicare rates, which the Census Bureau notes is due to a larger elderly population overall, not a larger share of those adults having Medicare. The continued growth of an aging population will continue to have ramifications for a number of health-related measures, including health insurance coverage rates, and bears following in future research.
Changes in Uninsurance by Age (Nonelderly Adults age 19-64, and Children age 0-18) and Characteristics
Among nonelderly adults, the overall rate of uninsurance fell to 10.8% in 2022, a 0.8 percentage point (PP) decrease from 2021.
Comparatively, the uninsured rate among children remained statistically unchanged from 2021 (5.0%) at 5.4% in 2022.
Race and ethnicity
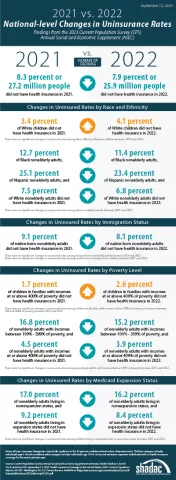
In 2022, rates of uninsurance fell among nonelderly Black, Hispanic, and White adults, declining to 11.4%, 23.4%, and 6.8% (versus 12.7%, 25.1%, and 7.5%), respectively. Rates of uninsurance among nonelderly Asian adults were unchanged at 7.4%.
Similarly, while uninsurance rates remained stable for children of several racial and ethnic groups in 2022 - 4.1% for Asian children, 4.7% for Black children, and 8.6% for Hispanic children - the rate of uninsurance rose significantly among White children, increasing to 4.1% in 2022 from 3.4% in 2021.
Immigration status
The rate of uninsurance among native-born nonelderly adults fell to 8.2% in 2022 from 9.1% in 2021, while the uninsurance rate among foreign-born adults remained statistically unchanged at 22.1% in 2022 compared to 22.8% in 2021.
Rates of uninsurance were unchanged among native-born children at 4.7% in 2022 and among foreign-born children at 20.6% in 2022.
Poverty level
When examining coverage by poverty level, rates of uninsurance were unchanged at 24.2% among nonelderly adults with incomes below 100% poverty, decreased to 15.2% from 16.8% for those between 100%-399% poverty, and decreased to 3.9% from 4.5% for those living at or above 400% poverty.
In 2022, rates of uninsurance were unchanged for children in the two lower poverty level categories—8.9% for those in families with incomes below 100% poverty and 6.1% for those living in families with incomes between 100%-399% poverty. However, uninsured rates rose to 2.6% among children in families with incomes at or above 400% of poverty, an increase of 0.9 PP from 2021.
Medicaid expansion status
As of January 1, 2022, 38 states and the District of Columbia have chosen to act on the option provided by the Affordable Care Act (ACA) and expand Medicaid eligibility requirements, with the additions of Missouri and Oklahoma last year. Comparing rates of uninsurance by expansion and nonexpansion states revealed divergent trends for nonelderly adults and children.
In 2022, the uninsured rate fell to 8.4% in 2022 from 9.2% in 2021 for nonelderly adults living in expansion states and fell to 16.2% in 2022 from 17.0% in 2021 for those in nonexpansion states.
However, children in expansion and nonexpansion states saw no significant change in uninsured rates for 2022 compared to 2021 at 4.1% and 8.1%, respectively.
Notable Public and Private Coverage Changes
Among nonelderly adults, rates of public coverage and private coverage were unchanged at 19.1% and 72.9%, respectively. Rates of employer-based coverage increased to 63.5% in 2022 among nonelderly adults, up 0.6 PP from 2021. Rates of Medicare coverage fell to 3.6% among nonelderly adults in 2022, down from 3.8% in 2021.
By Race and Ethnicity (Total Population)
Rates of private and public coverage were statistically unchanged among Asian (72.2% and 27.8%, respectively) and Hispanic individuals (49.4% and 37.7%, respectively).
Among Black persons, the percentage with private coverage rose to 56.6% in 2022, up from 55.1% in 2021, and the percentage with public coverage fell to 41.2% in 2022, down from 42.7% in 2021.
Among White individuals, the percentage with private coverage fell to 72.3% in 2022, down from 73.2% in 2021, and the percentage with public coverage rose to 35.4% in 2022, up from 34.6% in 2021.
Immigration Status (Total Population)
Rates of private and public coverage were unchanged among the native-born population at 67.6% and 36.7%, respectively. Among the foreign-born population, the percent with private coverage was unchanged at 54.4% while the percentage with public coverage rose to 32.8% in 2022 from 31.7% in 2021.
Medicaid Expansion Status (Total Population)
In expansion states, the share with private coverage fell to 66.6% in 2022 from 67.1% in 2021 while the share with public coverage rose to 37.6% in 2022 from 36.9% in 2021. In nonexpansion states, the share of the population with private coverage and public coverage were unchanged at 63.6% and 32.9%, respectively.
Employment Status (Nonelderly Adults)
Public coverage rose among working nonelderly adults in 2022 to 12.6% from 11.8% in 2021 while the share with private coverage was stable at 80.0%. Public coverage rose among those who worked full-time year round and those who worked less than full-time, year round, rising to 8.9% and 23.5%, respectively. Private coverage was unchanged among these groups at 84.8% and 66.0%, respectively. Private and public coverage were unchanged among those who did not work, at 47.5% and 42.6%, respectively.
More on the insurance coverage changes among working-age adults can be found in a topically focused blog released today by the Census Bureau.
Notes
All changes are tested at the 90% confidence level.
All estimates come from the 2022 and 2023 Current Population Survey Annual Social and Economic Supplements, which provide data for years 2021 and 2022, respectively.
Uninsured estimates represent individuals with no health insurance coverage for the entire calendar year.
Estimates of health insurance coverage type represent individuals with that type of coverage at any point during the calendar year. Types of health insurance coverage are not mutually exclusive.
COVID-19 Public Health Emergency Impacts
Continuous Coverage Requirement
The continuous coverage requirement that prevented states from terminating individuals’ Medicaid coverage during the pandemic ended on March 31, 2023. The resumption of Medicaid eligibility redeterminations and renewals (and potential disenrollments), a process commonly referred to as the “unwinding,” began on April 1, 2023, and each state has a year to navigate a return to normal operations while also meeting reporting requirements set by CMS for publicly sharing coverage transitions and outcomes data during this time. While the health insurance estimates released by the US Census Bureau for 2022 precede the beginning of the unwinding process, the data will provide an essential baseline for understanding how health insurance coverage is distributed across the U.S. and among the states prior to the unwinding, as well as marker to measure the impacts of this seismic coverage transition as potentially millions of individuals, both adults and children, are poised to lose Medicaid and must either find another form of coverage (e.g., state-based marketplace or employer-sponsored insurance [ESI]), or risk becoming uninsured.
Several resources have been compiled by SHADAC to track the unwinding process in a variety of avenues, falling under several broader categories:
Guidance for States
- Using Surveys to Monitor Coverage Transitions During the Unwinding of the Medicaid Continuous Coverage Requirement
- Best Practices for Publicly Reporting State Unwinding Data
Health Insurance Coverage Data Tracking
- State-Based Marketplace Transition Data During the Unwinding
- State Dashboards to Monitor the Unwinding of the Medicaid Continuous Coverage Requirement
- Tracking Health Insurance Coverage During the Unwinding: Monthly Data from the Household Pulse Survey
Data Collection and Dissemination - Nonresponse Bias
While Census Bureau researchers have not cited any concerns with CPS ASEC data collection or release processes, an ongoing issue of persistently lower response rates and resultant nonresponse bias has been documented for the past few years, coinciding with the beginning of the COVID-19 pandemic. In March 2023 (the point in time that the CPS is administered), the response rate fell to its lowest point yet, at 68.9%, compared to a pre-pandemic rate of 82% (March 2019). This lower response rate particularly affects the CPS measures of income, and since 2020, the Census Bureau has been working to address the bias in higher reported earnings using new weighting methods to create adjusted income and poverty estimates. More detail on this methodology can be found in a companion blog released today by Census Bureau researchers.
National Health Insurance Coverage Estimates Show Falling Rates of Uninsurance and Direct-Purchase Coverage


