The National Center for Health Statistics (NCHS) has released quarterly estimates of health insurance coverage beginning in January 2021 through March 2022 from the National Health Interview Survey (NHIS) as part of the NHIS Early Release Program.
After disruptions to data collection operations due to COVID-19 in 2020 and 2021, NHIS quarterly estimates for 2022 were able to collect and produced as usual.1 Estimates for each included category of insurance coverage (uninsured, public, and private) have been disaggregated by age group and family incomes as a percentage of the federal poverty level (FPL), reported race and ethnicity categories, and by geographic region.2
Uninsured rate saw significant decreases while public and private coverage remain stable
As the United States emerges from the height of the COVID-19 pandemic, estimates from the NHIS indicate positive trends for health insurance rates across coverage types thus far in 2022.
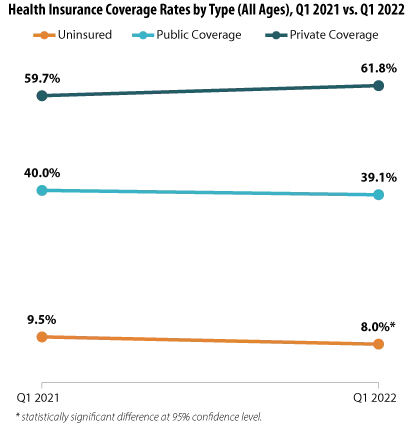
The uninsured rate dropped significantly across all age groups, decreasing by an incredible 1.5 percentage points (PP) from 9.5% during Q1 2021 to a historic low of just 8.0% during Q1 2022.
While public and private insurance coverage rates showed no statistically significant changes between the Quarter 1 time periods (measuring at 40.0% in 2021 and 39.1% in 2022 and 59.7% in 2021 and 61.8% in 2022, respectively), the potential shifts in coverage that are hinted at by the NHIS data offer hope toward a continuing post-pandemic recovery. A possible rise in private insurance coverage would indicate the potential for a resurgence in employer-sponsored insurance (ESI) due to a prospective rise in employment (unemployment rates fell sharply to 5.3% in 2021 from 8.1% in 2020).3 Consequently, this potential rise in private insurance coverage appears to be possibly offset by a reduction in public insurance coverage, indicating a consequent reduction in the portion of the national population needing to rely on safety net public insurance programs such as Medicaid. Again, our analysis of the NHIS insurance estimates did not find the year-to-year changes in public and private coverage to be statistically significant; therefore, these data will require further monitoring to see if these possible trends bear out.
Falling uninsured rates across demographic groups
Examining the NHIS coverage estimates for Q1 (January-March) 2022 revealed further good news in that a number of demographic subgroups saw a significant reduction in uninsured rates: by age, by race and ethnicity, and by geographic region.
Findings by age group
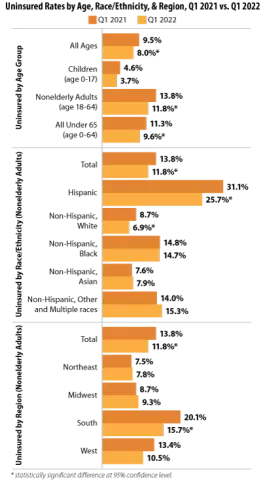
Our analysis showed not only a significant drop in uninsurance across all age groups from 2021 to 2022 (9.5% to 8.0%, respectively), but this decrease was underscored by rates for individuals under 65 (11.3% to 9.6%) and for nonelderly adults age 18-64 (13.8% to 11.8%). Rates for children (age 0-17) remained stable between the two years’ first quarters.
Findings by race and ethnicity
Uninsured rates also decreased significantly for Hispanic nonelderly adults (age 18-64)—dropping from 31.1% in Q1 2021 to 25.7% in Q1 2022—and for Non-Hispanic, White nonelderly adults (age 18-64) —dropping from 8.7% in Q1 2021 to 6.9% in Q1 2022.
Findings by geographic region
While uninsured rates in most regions remained stable between January-March of 2021 and 2022, NHIS data showed a significant drop in uninsurance for nonelderly adults (age 18-64) in the South, a region that traditionally has seen higher rates of uninsurance, falling to 15.7% in 2022 from 20.1% in 2021.4
Overall, data from Q1 of 2022 indicated positive trends in health insurance coverage, with uninsured rates falling significantly for a number of population subgroups and a potential (though not significant) recovery for private insurance and a lessening of public insurance coverage.
About the Numbers
The above estimates provide a point-in-time measure of health insurance coverage, indicating the percent of individuals with (or without) a specific type of coverage at the time of the interview. The estimates discussed in this blog are only from Q1 (January-March) 2022 and the same period in 2021.
Differences in estimates are statistically significant at the 95% confidence level unless otherwise specified.
Notes
1 SHADAC has previously documented the ways that data collection efforts for the NHIS, as well as a number of other federal surveys, were impacted in 2020 due to the COVID-19 pandemic. Additionally, NCHS—the organization which conducts the NHIS—has provided additional detail on the ways that COVID impacted collection in 2021 to a lesser degree. From January through April 2021, NHIS interviews continued to be attempted by telephone first, with personal visits used only to follow-up on nonresponse, deliver recruitment materials, and conduct interviews when telephone numbers were unknown. Starting in May, field representatives were given discretion to decide whether or not to resume personal visits based on their own health risk and the conditions in the area.
2 FPL categories have been further stratified than in previous years. Through 2020, poverty level estimates were classified in categories of “poor,” “near poor,” and “not poor,” which corresponded with 2021 classifications of “<100% FPL,” “100% to less than 200% FPL,” and “200% and greater FPL.” In the 2022 estimates, the categories were expanded to include a “200% to less than 400% FPL” category and a “400% and greater FPL.”
3 SHADAC analysis of Bureau of Labor Statistics data for 2020 and 2021. State Health Compare. Unemployment rate: 2020; 2021 [Data set]. State Health Access Data Assistance Center. http://statehealthcompare.shadac.org/trend/148/unemployment-rate-by-total#0/1/a/19,20,9,10,11,12,13,14,1,2,3,4,5,6,7,8,15,24,25,27,32,37/185
4 Tolbert, J. & Orgera, K. (2020, November 6). Key facts about the uninsured population. Kaiser Family Foundation (KFF). https://www.kff.org/uninsured/issue-brief/key-facts-about-the-uninsured-population/
Office of Health Policy. (2021, March 23). The remaining uninsured: Geographic and demographic variation [No. HP-2021-06]. Office of the Assistant Secretary for Planning and Evaluation (ASPE). https://aspe.hhs.gov/sites/default/files/private/pdf/265286/Uninsured-Population-Issue-Brief.pdf
NHIS Report Citation
Cohen, R.A. & Cha, A.E. (July 2022). Health insurance coverage: Early release or quarterly estimates from the National Health Interview Survey, January 2021–March 2022. National Center for Health Statistics (NCHS). https://www.cdc.gov/nchs/data/nhis/earlyrelease/Quarterly_Estimates_2022_Q11.pdf
2022 NHIS Early Release: Quarter 1 estimates show potential post-pandemic rebounds


