Throughout the United States, a majority of Americans and their families receive health insurance coverage through their employer. In 2021, the number of individuals enrolled in this type of coverage–known as employer-sponsored insurance or ESI–exceeded 62.2 million. In this blog, infographic, and companion documents, SHADAC researchers use data from the Medical Expenditure Panel Survey-Insurance Component (MEPS-IC) to analyze the private-sector ESI landscape in 2021 on a national level and within the states. As discussed in SHADAC’s 2020 ESI coverage blog, the COVID-19 pandemic complicated the collection and analysis of data throughout recent years, leading our researchers to compare 2021 ESI access data against pre-pandemic (2019) estimates and 2021 ESI cost data against 2020 estimates.
Key Findings
Employee Access to Coverage (2019 vs. 2021)
Establishment
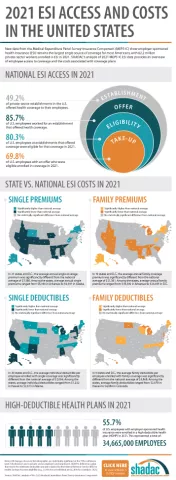
Not all private sector establishments offer their employees health insurance coverage. In fact, slightly less than half of establishments in the U.S. offered coverage in 2021 (49.2%). This was a significant increase from 47.4% in 2019.
Offer
The offer of employer-sponsored insurance coverage was extended to the majority of private-sector employees. In 2021, 85.7% of employees in the U.S. worked in establishments that offered health insurance coverage, a rate that remained statistically unchanged from 2019 (85.3%).
Eligibility
Among employees working at establishments that offered coverage, the percent eligible for coverage was 80.3% in 2021; an increase from 77.7% in 2019.
Take-Up
The take-up rate of ESI-eligible employees has varied over the years, and in 2021, 69.8% of eligible employees enrolled in coverage. This represented a 2.1 percentage-point decrease from 2019 (71.9%).
Employee Coverage Costs (2020 vs. 2021)
Premiums and contributions
- The average annual premium for single coverage rose to $7,380 in 2021, a $231 or 3.2% increase from 2020.
- For those enrolled in family coverage, average annual premiums also rose. In this case, premiums climbed to $21,381 in 2021, a $623 or 3.0% increase from 2020.
Deductibles
- For single coverage, the 2021 average individual deductible was $2,004. This represented a significant increase of 3.0% from 2020 ($1,945).
- Among those enrolled in family coverage, the average deductible per employee enrolled was $3,868 in 2021. This was also a significant increase of 3.9% from 2020 ($3,722).
High-Deductible Health Plans
- In 2021, the share of employees enrolled in high-deductible health plans (HDHPs) increased substantially in 2021 to 55.7% – an increase of 5.3 percentage points from 2020.
Key Takeaways
With so many Americans relying on their employers for health insurance coverage, ESI findings remain an important indicator of the financial and health burdens many individuals and families face. In 2021, the U.S. experienced several continuing ESI trends, including rising costs across employee premiums, premium contributions, and deductibles. Additionally, the share of private sector employees enrolled in high-deductible plans increased substantially. In regards to coverage, more employers offered ESI to their employees in 2021 when compared to pre-pandemic levels. Meanwhile, the rate of ESI-eligible employees enrolling in offered coverage was down overall from pre-pandemic, though unchanged from 2020.
For more detailed information on ESI findings from SHADAC, see the following products:
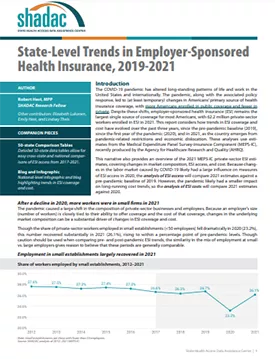
Report NarrativeThe report narrative provides an in-depth look at 2019-2021 ESI estimates including state-level changes and trends.
50-State Comparison Tables
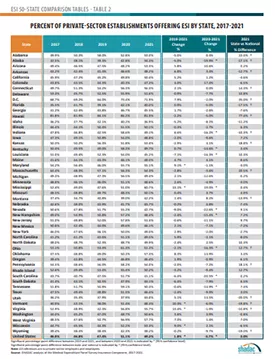
The 50-state tables include 2017-2021 ESI estimates and allow for easy cross-state and state vs. national analysis.
Other related resources
• 2021 ESI Blog (2019-2020 data)
• 2020 ESI Report, Blog, and Infographic (2015-2019 data)
• 2019 ESI Report, Blog, and Infographic (2014-2018 data)
A National-Level Look at ESI Cost and Coverage Rates in 2021


