National Story
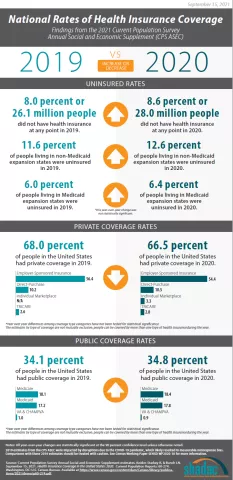
The U.S. Census Bureau has released 1-year health insurance coverage estimates for 2020 from the Current Population Survey Annual Social and Economic Supplement (CPS ASEC). The Census report, “Health Insurance Coverage in the United States: 2020,” showed that the national uninsured rate was 8.6 percent in 2020, which represented a significant increase from 8.0 percent in 2019.1
No state-level estimates were published in the report, which in the past has drawn on data from the Census Bureau’s American Community Survey (ACS) for information on health insurance coverage by state. Estimates from the 2020 1-Year ACS will not be released as usual this year due to substantial COVID-19-pandemic-related disruptions to data collection operations and resulting issues with data quality. However, the CPS ASEC does provide important breakdowns of available health insurance coverage estimates at the national level, which are explored in this blog, and SHADAC plans to soon release state-level 2020 health insurance coverage estimates from the CPS ASEC.
Public/Private
In 2020, 66.5 percent of the United States population had private coverage, which represented a 1.6 percentage-point (PP) decrease from 68.0 percent in 2019. Conversely, the portion of the U.S. population with a public plan increased by 0.7PP to 34.8 percent in 2020 from 34.1 percent in 2019.
Among categories of private-based insurance coverage…
… employer-sponsored insurance (ESI) continued to be the most common form of coverage at 54.4 percent, followed by direct-purchase coverage (including marketplace coverage) at 10.5 percent, individual marketplace coverage at 3.3 percent, and TRICARE at 2.8 percent.
Among categories of public-based insurance coverage…
… Medicare and Medicaid were split nearly evenly at 18.4 percent and 17.8 percent, respectively. Individuals who had the Department of Veterans Affairs (VA) or Civilian Health and Medical Program of the Department of Veterans Affairs (CHAMPVA) made up 0.9 percent of public coverage.
Medicaid Expansion Status
Differences in uninsured rates were also apparent when examined by state Medicaid expansion status. In 2020, the rate of uninsured for states that expanded Medicaid was 6.4 percent, and in non-expansion states the uninsured rate for 2020 measured at 12.6 percent.
Age
Looking at rates of uninsured individuals by age, children age 19 and younger measured at 5.6 percent in 2020. Adults under age 65 had an uninsured rate of 10.2 percent in 2020, while uninsured rates for adults over the age of 65 measured at just 1.0 percent in 2020.
Race/Ethnicity
Estimates of uninsurance by race/ethnicity were also included within the CPS ASEC report. For 2020, the portion of the population who identified as White had an uninsured rate of 8.3 percent, those who identified as Black had an uninsured rate of 10.4 percent, the uninsured rate for those who identified as Asian was 5.9 percent, and those who identified as Hispanic regardless of their race had a rate of 18.3 percent who were uninsured.
Income
The report also provided health insurance coverage data by poverty levels. The rate of uninsured for 2020 for those below 100 percent of poverty measured at 17.2 percent and individuals below 138 percent of poverty saw a similar rate of 16.1 percent in 2020. Conversely, individuals at or above 400 percent of poverty had an uninsured rate of 3.4 percent.
Access the full report on “Health Insurance Coverage in the United States: 2020.”
Current and Future Data Releases and Products
In addition to their health insurance coverage report, the Census Bureau also published two new companion blogs to the CPS ASEC release.
The first post discusses the way in which the CPS has changed its measure of health insurance coverage within a particular year as a result of the 2014 questionnaire redesign, as well as providing an overview of subannual coverage in the CPS from 2018 to 2020, and whether and how these measures may be compared with estimates from other surveys such as the Medical Expenditure Panel Survey (MEPS) and the Survey of Income and Program Participation (SIPP).
The second blog takes a deeper dive into the effects of the COVID pandemic on response rates for the 2021 CPS ASEC and the extent that nonresponse bias played a factor in the outcome of the 2020 estimates for income, poverty, and health insurance coverage.
Experimental data from the 2020 ACS 1-Year Estimates are expected to be published by the Census Bureau in November 2021, and 2016-2020 ACS 5-Year Estimates are planned for release in December 2021 (though Census is still evaluating whether the 5-Year ACS estimates meet their standards for data quality).
SHADAC will monitor these planned ACS releases and will assess whether and how any of these products could be used to produce state-level health insurance coverage and related estimates. We will also assess if and which other data sources may be useful for producing the coverage estimates we typically get from the ACS.
Notes
1 All statistically significant differences in this post are evaluated at the 90% confidence level.
2019 estimates from the CPS ASEC were impacted by disruptions due to the COVID-19 pandemic, which likely resulted in measurable nonresponse bias. Comparisons with these 2019 estimates should be treated with caution. See Census Working Paper SEHSD WP2020-10 for more information.
2021 CPS ASEC: Private Coverage Fell while Public Coverage Rose

