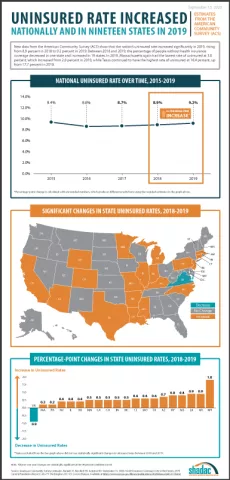
New 2019 health insurance coverage estimates from the U.S. Census Bureau’s American Community Survey (ACS) were released this morning, and findings from the survey show the national rate of uninsured increased from 8.9% in 2018 to 9.2% in 2019.
This 0.3 percentage-point increase represents approximately 1.07 million more individuals without health insurance in 2019, almost double the increase from 2017-2018 (535,000 individuals). Additionally, this is the third consecutive year of increases in the rate of uninsured after 0.1 percentage-point increases seen in both 2017 and 2018.
State-Level Uninsured Rate Changes from 2018 to 2019
Along with the nationwide growth in uninsurance, 19 states also experienced significant increases in their rates of uninsured. Wyoming saw the largest increase, with its uninsured rate growing from 10.5% in 2018 to 12.3% in 2019, or 1.8 percentage points. This is double the next-largest increase of 0.9 percentage points seen by both Louisiana and Arkansas.
Massachusetts and Pennsylvania saw the smallest increases in uninsurance (0.2 percentage points), with rates rising from 2.8% to 3.0% and 5.5% to 5.8%, respectively.
Virginia was the only state to experience a decrease in its uninsured rate, which fell from 8.8% to 7.9% in 2019—a drop of 0.9 percentage points. Virginia implemented Medicaid expansion on January 1, 2019.
States with significant changes in uninsured rates, 2018-2019
| State | 2018 Percent Uninsured | 2019 Percent Uninsured |
Percentage-Point Change, 2018-2019* |
| Wyoming | 10.5 | 12.3 | 1.8 |
| Louisiana | 8.8 | 7.9 | 0.9 |
| Arkansas | 8.2 | 9.1 | 0.9 |
| Kentucky | 5.6 | 6.4 | 0.8 |
| Mississippi | 12.1 | 13.0 | 0.8 |
| Arizona | 10.6 | 11.3 | 0.7 |
| Connecticut | 5.3 | 5.9 | 0.6 |
| Missouri | 9.4 | 10.0 | 0.6 |
| Texas | 17.7 | 18.4 | 0.6 |
| Minnesota | 4.4 | 4.9 | 0.5 |
| California | 7.2 | 7.7 | 0.5 |
| Colorado | 7.5 | 8.0 | 0.5 |
| Indiana | 8.3 | 8.7 | 0.5 |
| North Carolina | 10.7 | 11.3 | 0.5 |
| Michigan | 5.4 | 5.8 | 0.4 |
| Illinois | 7.0 | 7.4 | 0.4 |
| New Jersey | 7.4 | 7.9 | 0.4 |
| United States | 8.9 | 9.2 | 0.3 |
| Massachusetts | 2.8 | 3.0 | 0.2 |
| Pennsylvania | 5.5 | 5.8 | 0.2 |
| Virginia | 8.8 | 7.9 | -0.9 |
The states with the lowest and highest uninsured rates in 2019 were unchanged from the previous year. Massachusetts again had the lowest rate of uninsured at 3.0%, though this rate did increase by 0.2 percentage points from 2.8% in 2018, and Texas continued to have the highest rate of uninsured at 18.4%, a 0.6 percentage-point increase from 17.7% in 2018.
Medicaid Expansion Status and State Uninsured Levels, 2019
Expansion States
Among the 32 states and D.C. that had adopted Medicaid expansion as of January 1, 2019, an overall 14 states saw increases in their uninsured rates. Massachusetts had the lowest rate of uninsured at 3.0% and Alaska had the highest rate at 12.2%.
Louisiana had the largest increase at 0.9 percentage points, jumping to 8.9% from 8.0% in 2018, and Pennsylvania had the smallest significant increase at 0.2 percentage points from 5.5% in 2018 to 5.8% in 2019.
After implementing Medicaid expansion on January 1, 2019, Virginia was the only state to experience a decrease in the uninsured rate, falling 0.9 percentage points to 7.9% in 2019 from 8.8% in 2018.
Non-Expansion States
Among the 18 states that had not adopted Medicaid expansion as of January 1, 2019, Wisconsin had the lowest rate of uninsured at 5.7% and Texas had the highest rate of uninsured at 18.4%.
Additionally, across these same states that had not adopted Medicaid expansion, five (Wyoming, Mississippi, Missouri, Texas and North Carolina) experienced increases in their rates of uninsured. Wyoming saw the largest increase at 1.8 percentage points, with its rate climbing to 12.3% in 2019 from 10.5% in 2018. North Carolina saw the smallest significant increase in its uninsured rate, rising to 11.3% in 2019 from 10.7% in 2018, a change of 0.5 percentage points.
More Insights on the 2019 Health Insurance Coverage Estimates at Upcoming September 23rd Webinar with SHADAC and Census Bureau Experts
On Wednesday, September 23rd at 12:00 PM Central Time (1:00 PM Eastern), SHADAC will host a webinar to examine the new 2019 coverage estimates from the ACS as well as from the Current Population Survey (CPS), with technical insight provided by researchers from SHADAC and from the U.S. Census Bureau, which administers both surveys.
Speakers will discuss the new national and state-level estimates, and attendees will learn:
- When to use which estimates from which survey
- How to access the estimates via Census reports and the new data.census.gov site
- How to access state-level estimates from the ACS using SHADAC tables
- Attendees will have an opportunity to ask questions after the speaker presentations.
Related Materials:
- 2019 ACS: Insurance Coverage Overall Fell Nationwide and among the States, with Private and Public Coverage Declines Seen at the State Level
- 2019 ACS Tables: State and County Uninsured Rates, with Comparison Year 2018
- New Subsidized Marketplace Data and Other Data Tables Now Available from the 2019 American Community Survey (ACS)
Notes
All differences described here are statistically significant at the 90% level of confidence unless otherwise specified.
All estimates are for the civilian noninstitutionalized population and come from the American Community Survey 1-Year Estimates as reported in Table A3 of “Health Insurance Coverage in the United States: 2019,” available at https://www.census.gov/library/publications/2020/demo/p60-271.html

