The U.S. Census Bureau has released the Small Area Health Insurance Estimates (SAHIE) for 2018, providing estimates of health insurance coverage for all counties and states. This year, the Census Bureau has also added an animated map tool, so that users can view county coverage trends over time for the past decade (2008-2018).
The SAHIE program is the only source of single-year health insurance estimates for every county in the US. Estimates are available for each county by sex, age, and Federal Poverty Level (FPL). Race/ethnicity information is available at the state level.
The following are highlights from the 2018 SAHIE release.
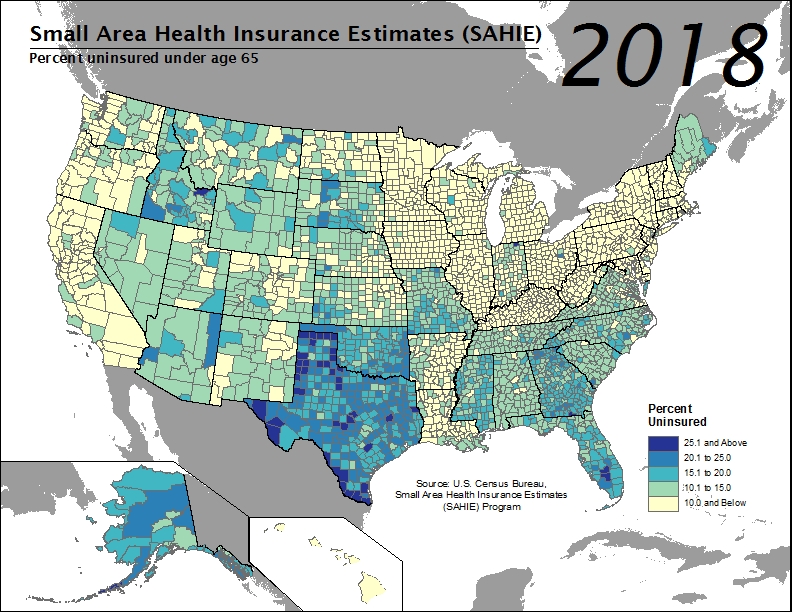 Across the nation in 2018, county uninsured rates for the nonelderly population (i.e., under age 65) ranged from 2.4% to 32.2%, with a median county uninsured rate that held steady from the previous year at 10.6%.
- In 1,184 counties, or approximately 37.7% of all counties, the 2018 nonelderly uninsured rate was at or below 10%. An estimated 493 counties (15.7%) had uninsured rates greater than or equal to 15.0%, a figure which was unchanged from 2017.
- Among the 493 counties with uninsured rates at or above 15.0%, the majority (85.0%, or 419 counties) were located in the South. The remaining were located in the Midwest (36 counties) and West (38 counties). No counties in the Northeast fell into this category.
- Alaska, Florida, Georgia, Idaho, Indiana, and Texas all had counties with 2018 nonelderly uninsurance rates that exceeded 25.0%.
- In states that expanded Medicaid eligibility, 7.9% of counties (119 out of 1,498 counties) had an estimated uninsured rate above 20.0%, compared to 80.8% of counties (1,327 out of 1,643 counties) in states that did not expand it.
- From 2017 to 2018, the nonelderly population (i.e., under age 65) in over 95% of counties (2,990) did not have a statistically significant change in their uninsured rate. Among counties that did experience changes in their uninsured rates, more saw an increase (81 counties) than a decrease (70 counties).
Access the full 2018 SAHIE report and visualizations.
Access the 2018 SAHIE estimates.
Find your county’s 2018 uninsured rate using SAHIE’s interactive data tool.
About SAHIE
SAHIE are created using statistical models that combine American Community Survey (ACS) data with population estimates and administrative records.
SAHIE are consistent with the direct ACS survey estimates, but SAHIE are more precise than the ACS 1-year and 5-year survey estimates alone for most counties because SAHIE are supplemented with other data sources.
The SHADAC brief entitled Small Area Health Insurance Estimates from the Census Bureau provides an overview of how the SAHIE are developed as well as a comparison of the SAHIE model-based methodology to that used by ACS (see Table 2 in the brief).