July 24, 2024
July is Disability Pride Month – a month dedicated to sharing the experiences, accomplishments, and challenges of the estimated 61 million people with a disability in the United States.
Those with a disability or disabilities face different obstacles and barriers compared to those who are not disabled. Barriers can be physical (e.g., inaccessible office building, public transport, etc.), structural (e.g., lack of access to programs or community organizations), and economic (e.g., fewer employment opportunities, high costs of medical care, etc.), among others.
These barriers can lead to economic, social, and health inequities for those with a disability or disabilities. Some documented examples include:
- Unfair treatment in health care settings, at work, or when applying for public benefits
- Adults with disabilities are more likely to live in poverty compared to adults with no disability
- People with a disability often have increased medical expenses, with a study from the National Disability Institute estimating that a U.S. household containing an adult with a disability must spend an estimated 28% more income to obtain the same standard of living as a household with no disability
- Those with disabilities have twice the risk of developing chronic health conditions like depression, diabetes, asthma, and poor oral health
Health care inequities for the disabled community are varied and complex, especially when considering other social determinants of health that can impact health care and health outcomes alongside disability status, like race and ethnicity, educational access, social & community context, sexual orientation and gender identity (SOGI), among others. The National Institutes of Health has officially designated people with disabilities as a population with health disparities.
Disability is something that can affect anyone at any time – understanding how this community experiences inequities is crucial for providing accessible and quality health care for all. In this post, we will introduce SHADAC resources that can be leveraged to better understand these inequities.
Federal Survey Sample Size Analysis: Disability, Language, and Sexual Orientation and Gender Identity
The Medicaid and CHIP Payment and Access Commission (MACPAC) contracted with SHADAC to conduct a review and sample size analysis of 13 federal surveys to assess the quality and availability of data for the following populations:
- People who indicated sexual orientation or gender identity (SOGI)
- People with language access needs, and
- People with disabilities
The review provides information about total sample size and sample size for people enrolled in Medicaid, which is a program that serves many people with disabilities. This review helps researchers, policymakers, and other stakeholders understand what data sources are available to information about people with disabilities, and where there are important gaps. While findings did show that the majority of the surveys examined include questions related to functional disability, fewer than half of the surveys included questions on intellectual disability or serious mental illness.
Learn more about the sample size analysis and overall findings from the surveys in the full brief here.
Collection of Self-Reported Disability Data in Medicaid Applications: A Fifty-State Review of the Current Landscape (SHVS Brief)
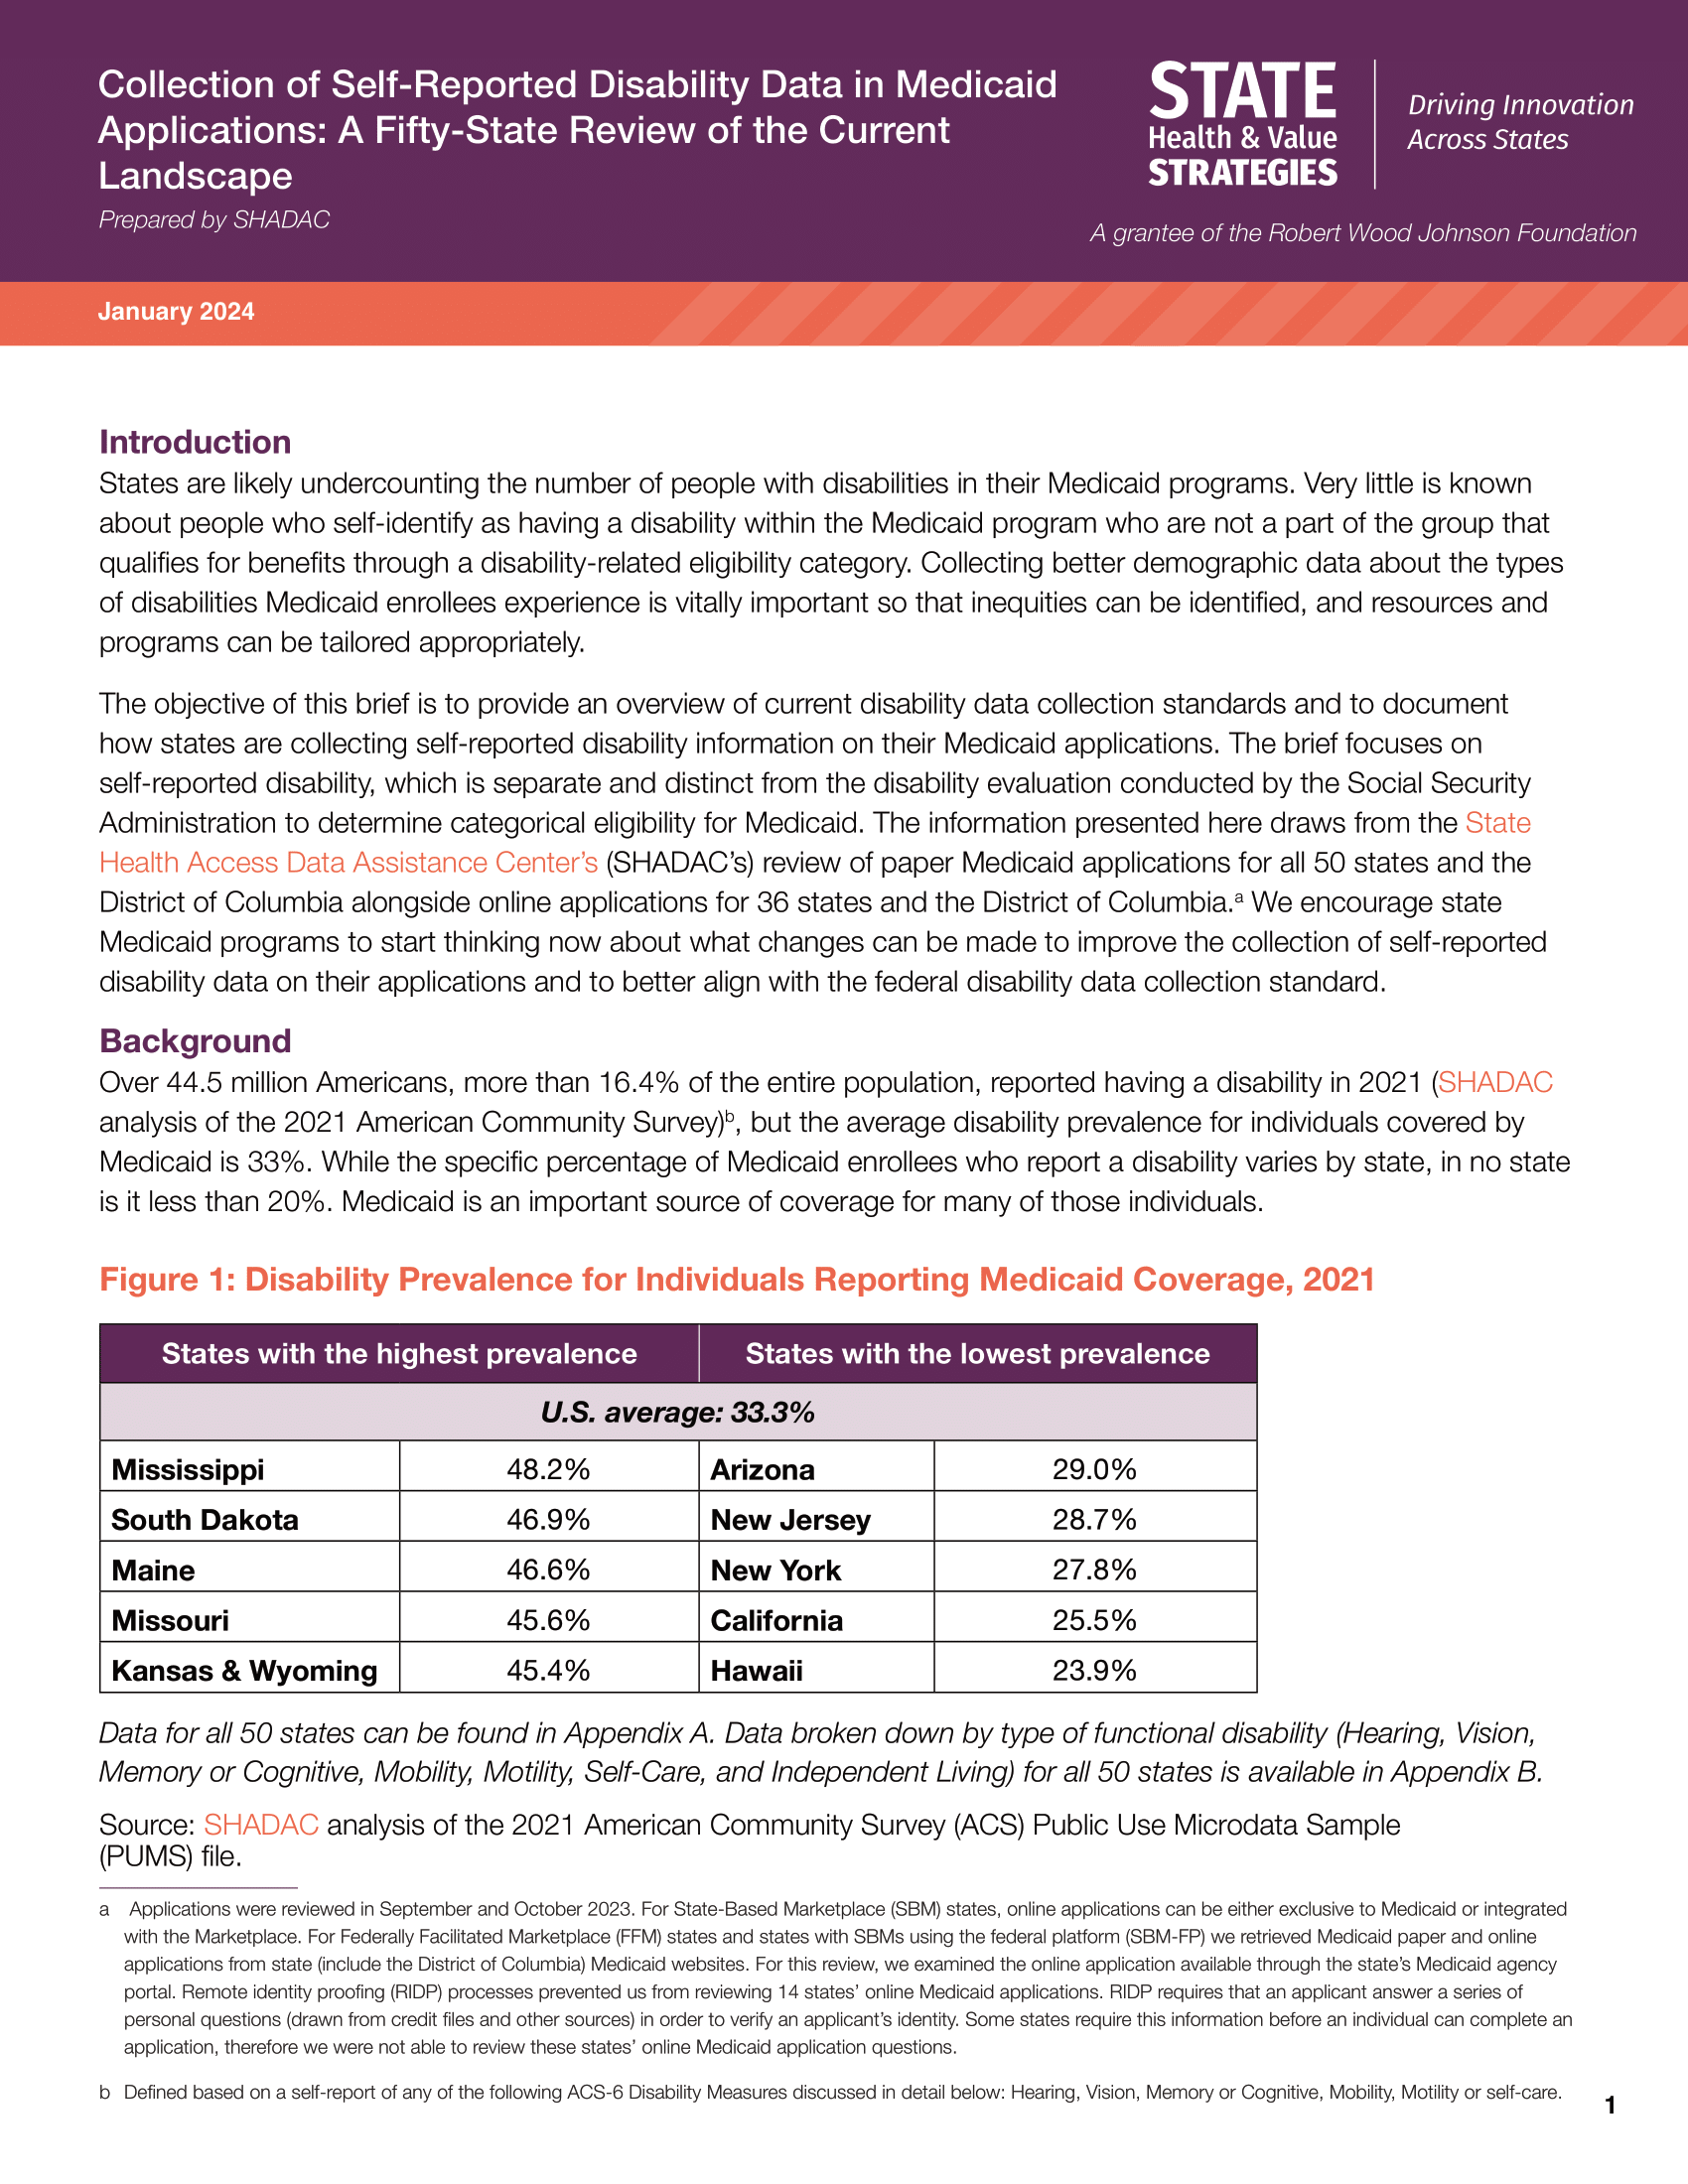
States are likely undercounting the number of people with disabilities in their Medicaid programs. While some people with disabilities are covered by Medicaid as a result of disability- related eligibility, little is known about people with disabilities who are eligible on the basis of income or other factors.
This State Health and Value Strategies (SHVS) Brief authored by SHADAC researchers Emily Zylla and Elizabeth Lukanen provides an overview of current disability data collection standards, including information on how states are collecting self-reported disability information on Medicaid applications. SHADAC researchers reviewed paper Medicaid applications for all 50 states and the District of Columbia alongside online applications for 36 states and the District of Columbia.
Understanding and collecting better demographic data about the types of disabilities Medicaid enrollees experience can help us both identify any existing inequities and tailor possible solutions and resources appropriately. Read the brief in full here.
State Health Compare Disability Breakdowns
On SHADAC’s State Health Compare tool, users are able to examine a number of different measures related to health and health care at the state level. A number of these measures can be broken down by demographic categories, including by disability status, including:
Data disaggregation such as this can help in identifying differences, trends, and similarities between different groups and demographics. See an example of what you can do with this data below, where we breakdown the measure ‘Adult Unhealthy Days’ by Disability Status.
Explore all of the measures including each of their available breakdowns at this link.
Housing Affordability Matters: Unaffordable Rents Infographics Updated with 2022 Data
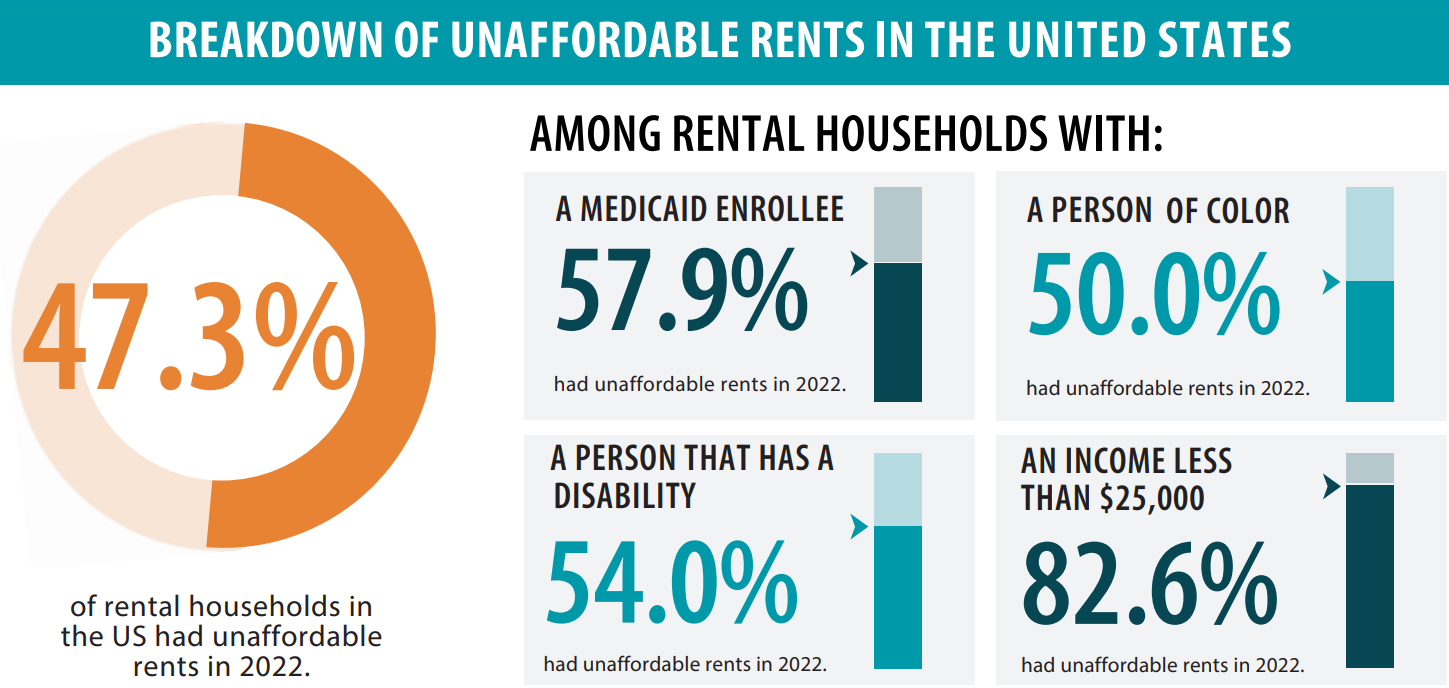
Using data from the American Community Survey (ACS) in the ‘Unaffordable Rents’ measure on State Health Compare, we created a blog plus six accompanying infographics containing information on the connection between affordable housing and health. Within these publications, we included specific information on housing affordability for households with a person with a disability alongside all rental households to understand any differences in unaffordable rents between demographic groups.
For example, in the United States as a whole, 47.3% of rental households had unaffordable rents in 2022. In rental households that include a person that has a disability, that jumps to 54% had unaffordable rents in 2022.
These resources also present data on other demographic groups including Medicaid enrollees, people of color, and household incomes less than 25,000 annually.
You can find each of the infographics created for the US and five individual states along with an explanatory blog on the topic here.
Minnesota Community and Uninsured Profile
This resource, originally funded by the Blue Cross Blue Shield of Minnesota Foundation, provides users with a tool that provides rates and counts of uninsured Minnesotans at various levels (ZIP code, county, MNSure rating area, state, etc.). The profile then can provide further breakdowns by a number of demographic factors, including by age, income, educational attainment, and disability status.
While this profile currently represents communities and uninsured populations from the single state of Minnesota, SHADAC researchers can provide additional technical assistance, profile customization, and analysis to other organizations and groups upon request.
If you or your organization is interested in working with this profile, or creating one relevant to you or your needs, don’t hesitate to reach out at shadac@umn.edu or on our contact page here.
Stay Informed on Disability Health Data Resources and Information
The resources and products above represent just some of the work SHADAC is doing that we hope can help advance health equity. Examining different demographic groups, identities, and experiences helps researchers, policymakers, and other stakeholders understand the challenges and barriers different people face – and, hopefully, use that information to tailor health equity work towards those differing needs in the future.
You can stay up to date on our latest releases and updates by following us on LinkedIn, or by signing up for our newsletter.
Continue your journey to understand health disparities and health equity with the following products:


