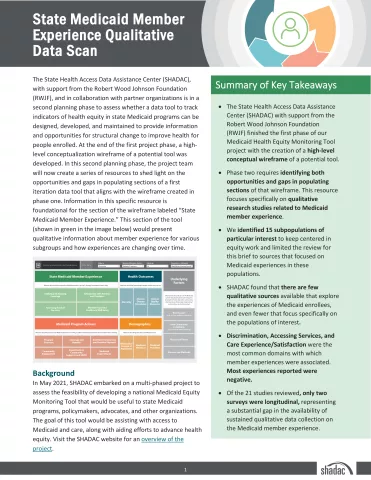
As part of the ongoing work in Phase 2 of the Medicaid Equity Monitoring Tool project, SHADAC researchers have been working to understand what available data sources and measures currently exist that could be useful in populating a potential Medicaid Equity Monitoring Tool.
In Phase 1, the project team conceptualized a high-level wireframe, displaying what such a tool could look like, and how measures could be included and categorized. Currently, five general categories have been proposed - State Medicaid Member Experience, Health Outcomes, Medicaid Program Actions, Demographics, and Underlying Factors - further stratified into various domains, under which individual measures could be housed.
In the case of State Medicaid Member Experience, the category of focus for SHADAC’s initial data scan, four domains have been proposed:
- Accessing Needed Services
- Member-Reported Health and Well Being
- Satisfaction with Services and Providers
- Seeking and Keeping Coverage
In starting the initial data scan process, SHADAC has already faced a number of critical decision points – first and foremost, where to begin.
With five main categories and a multiplicity of potential domains under each, there were numerous points of entry into a process we hoped would help to gain a better understanding of the potential measures currently available (as well as a process to identity gaps in such data collection) to populate a tool.
After deciding to start with the Medicaid Member Experience category, a secondary decision split the data scan process into two parts, quantitative and qualitative.1 A resource documenting the quantitative data scan's process, findings, and further recommendations was published in January 2024. This new resource examines the qualitative aspects of Member Experience through identification of related research studies.
Top-level findings reveal that there are few sources documenting qualitative data collection methods regarding the experiences of Medicaid enrollees – our scan found just 21 – even fewer that focus specifically on our project’s 15 identified subpopulations of interest, and even fewer studies conducted over extended periods of time (2).
In addition to a summation of the scan results, the resource also contains an appendix table that crosswalks each source to all relevant measurement domains (e.g., Accessing Needed Services, Member-reported Health and Well Being, Satisfaction with Services and Providers, Seeking and Keeping Coverage, and Discrimination), provides relevant quotes from either Medicaid members themselves or their representatives, and includes population demographics such as race/ethnicity, disability status, and geographic location, among others.
Click on the image above to access the full report, or access it at this link.
[1] For more on the decision-making process regarding the initial data scan, please see the State Medicaid Member Experience Quantitative Data Scan page.

