Blog & News


Employer-Sponsored Insurance (2019-2021): A National-Level Look at Cost and Coverage Rates (Infographic)
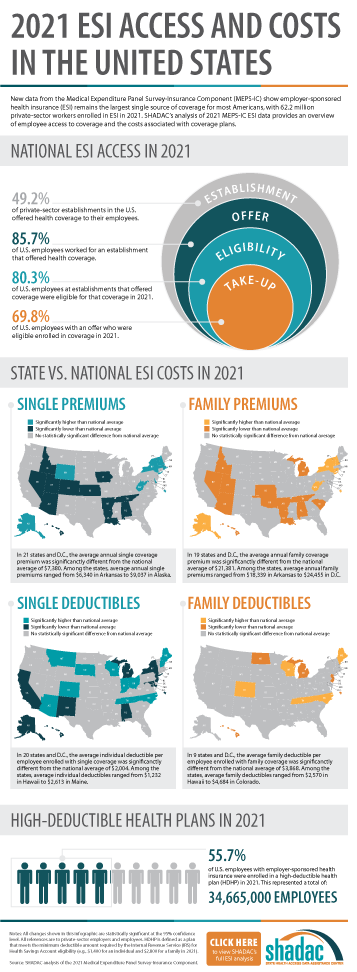
August 30, 2022:Throughout the United States, a majority of Americans and their families receive health insurance coverage through their employer. In 2021, the number of individuals enrolled in this type of coverage–known as employer-sponsored insurance or ESI–exceeded 62.2 million. In this blog, infographic, and companion documents, SHADAC researchers use data from the Medical Expenditure Panel Survey-Insurance Component (MEPS-IC) to analyze the private-sector ESI landscape in 2021 on a national level and within the states. As discussed in SHADAC’s 2020 ESI coverage blog, the COVID-19 pandemic complicated the collection and analysis of data throughout recent years, leading our researchers to compare 2021 ESI access data against pre-pandemic (2019) estimates and 2021 ESI cost data against 2020 estimates.
Key Findings
Employee Access to Coverage (2019 vs. 2021)
Establishment
Not all private sector establishments offer their employees health insurance coverage. In fact, slightly less than half of establishments in the U.S. offered coverage in 2021 (49.2%). This was a significant increase from 47.4% in 2019.
Offer
The offer of employer-sponsored insurance coverage was extended to the majority of private-sector employees. In 2021, 85.7% of employees in the U.S. worked in establishments that offered health insurance coverage, a rate that remained statistically unchanged from 2019 (85.3%).
Eligibility
Among employees working at establishments that offered coverage, the percent eligible for coverage was 80.3% in 2021; an increase from 77.7% in 2019.
Take-Up
The take-up rate of ESI-eligible employees has varied over the years, and in 2021, 69.8% of eligible employees enrolled in coverage. This represented a 2.1 percentage-point decrease from 2019 (71.9%).
Employee Coverage Costs (2020 vs. 2021)
Premiums and contributions
- The average annual premium for single coverage rose to $7,380 in 2021, a $231 or 3.2% increase from 2020.
- For those enrolled in family coverage, average annual premiums also rose. In this case, premiums climbed to $21,381 in 2021, a $623 or 3.0% increase from 2020.
Deductibles
- For single coverage, the 2021 average individual deductible was $2,004. This represented a significant increase of 3.0% from 2020 ($1,945).
- Among those enrolled in family coverage, the average deductible per employee enrolled was $3,868 in 2021. This was also a significant increase of 3.9% from 2020 ($3,722).
High-Deductible Health Plans
- In 2021, the share of employees enrolled in high-deductible health plans (HDHPs) increased substantially in 2021 to 55.7% – an increase of 5.3 percentage points from 2020.
Key Takeaways
With so many Americans relying on their employers for health insurance coverage, ESI findings remain an important indicator of the financial and health burdens many individuals and families face. In 2021, the U.S. experienced several continuing ESI trends, including rising costs across employee premiums, premium contributions, and deductibles. Additionally, the share of private sector employees enrolled in high-deductible plans increased substantially. In regards to coverage, more employers offered ESI to their employees in 2021 when compared to pre-pandemic levels. Meanwhile, the rate of ESI-eligible employees enrolling in offered coverage was down overall from pre-pandemic, though unchanged from 2020.
For more detailed information on ESI findings from SHADAC, see the following products:
 Report Narrative
The report narrative provides an in-depth look at 2019-2021 ESI estimates including state-level changes and trends.
50-State Comparison Tables
The 50-state tables include 2017-2021 ESI estimates and allow for easy cross-state and state vs. national analysis.
Other related resources
• 2021 ESI Blog (2019-2020 data)
• 2020 ESI Report, Blog, and Infographic (2015-2019 data)
• 2019 ESI Report, Blog, and Infographic (2014-2018 data)
Blog & News

2022 NHIS Early Release: Estimates from Quarter 1 (January-March) show potential post-pandemic rebounds in health insurance coverage
August 8, 2022:The National Center for Health Statistics (NCHS) has released quarterly estimates of health insurance coverage beginning in January 2021 through March 2022 from the National Health Interview Survey (NHIS) as part of the NHIS Early Release Program.
After disruptions to data collection operations due to COVID-19 in 2020 and 2021, NHIS quarterly estimates for 2022 were able to collect and produced as usual.1 Estimates for each included category of insurance coverage (uninsured, public, and private) have been disaggregated by age group and family incomes as a percentage of the federal poverty level (FPL), reported race and ethnicity categories, and by geographic region.2
Uninsured rate saw significant decreases while public and private coverage remain stable
As the United States emerges from the height of the COVID-19 pandemic, estimates from the NHIS indicate positive trends for health insurance rates across coverage types thus far in 2022.
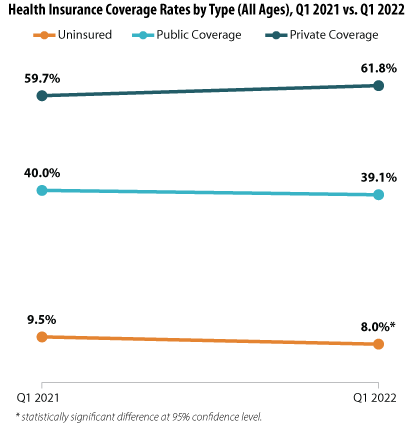
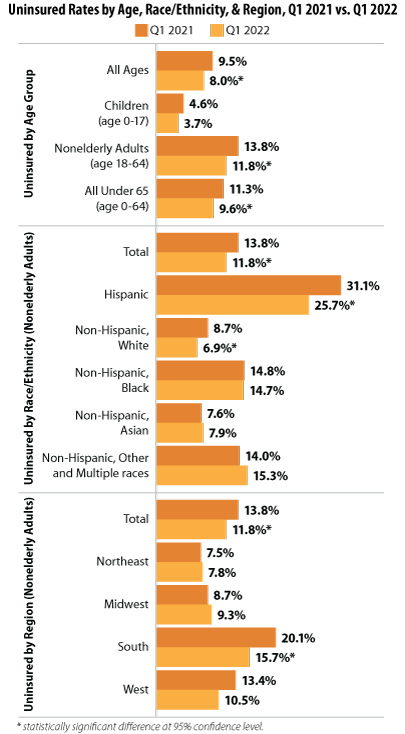
The uninsured rate dropped significantly across all age groups, decreasing by an incredible 1.5 percentage points (PP) from 9.5% during Q1 2021 to a historic low of just 8.0% during Q1 2022.
While public and private insurance coverage rates showed no statistically significant changes between the Quarter 1 time periods (measuring at 40.0% in 2021 and 39.1% in 2022 and 59.7% in 2021 and 61.8% in 2022, respectively), the potential shifts in coverage that are hinted at by the NHIS data offer hope toward a continuing post-pandemic recovery. A possible rise in private insurance coverage would indicate the potential for a resurgence in employer-sponsored insurance (ESI) due to a prospective rise in employment (unemployment rates fell sharply to 5.3% in 2021 from 8.1% in 2020).3 Consequently, this potential rise in private insurance coverage appears to be possibly offset by a reduction in public insurance coverage, indicating a consequent reduction in the portion of the national population needing to rely on safety net public insurance programs such as Medicaid. Again, our analysis of the NHIS insurance estimates did not find the year-to-year changes in public and private coverage to be statistically significant; therefore, these data will require further monitoring to see if these possible trends bear out.
Falling uninsured rates across demographic groups
Examining the NHIS coverage estimates for Q1 (January-March) 2022 revealed further good news in that a number of demographic subgroups saw a significant reduction in uninsured rates: by age, by race and ethnicity, and by geographic region.
Findings by age group
Our analysis showed not only a significant drop in uninsurance across all age groups from 2021 to 2022 (9.5% to 8.0%, respectively), but this decrease was underscored by rates for individuals under 65 (11.3% to 9.6%) and for nonelderly adults age 18-64 (13.8% to 11.8%). Rates for children (age 0-17) remained stable between the two years’ first quarters.
Findings by race and ethnicity
Uninsured rates also decreased significantly for Hispanic nonelderly adults (age 18-64)—dropping from 31.1% in Q1 2021 to 25.7% in Q1 2022—and for Non-Hispanic, White nonelderly adults (age 18-64) —dropping from 8.7% in Q1 2021 to 6.9% in Q1 2022.
Findings by geographic region
While uninsured rates in most regions remained stable between January-March of 2021 and 2022, NHIS data showed a significant drop in uninsurance for nonelderly adults (age 18-64) in the South, a region that traditionally has seen higher rates of uninsurance, falling to 15.7% in 2022 from 20.1% in 2021.4
Overall, data from Q1 of 2022 indicated positive trends in health insurance coverage, with uninsured rates falling significantly for a number of population subgroups and a potential (though not significant) recovery for private insurance and a lessening of public insurance coverage.
About the Numbers
The above estimates provide a point-in-time measure of health insurance coverage, indicating the percent of individuals with (or without) a specific type of coverage at the time of the interview. The estimates discussed in this blog are only from Q1 (January-March) 2022 and the same period in 2021.
Differences in estimates are statistically significant at the 95% confidence level unless otherwise specified.
Notes
1 SHADAC has previously documented the ways that data collection efforts for the NHIS, as well as a number of other federal surveys, were impacted in 2020 due to the COVID-19 pandemic. Additionally, NCHS—the organization which conducts the NHIS—has provided additional detail on the ways that COVID impacted collection in 2021 to a lesser degree. From January through April 2021, NHIS interviews continued to be attempted by telephone first, with personal visits used only to follow-up on nonresponse, deliver recruitment materials, and conduct interviews when telephone numbers were unknown. Starting in May, field representatives were given discretion to decide whether or not to resume personal visits based on their own health risk and the conditions in the area.
2 FPL categories have been further stratified than in previous years. Through 2020, poverty level estimates were classified in categories of “poor,” “near poor,” and “not poor,” which corresponded with 2021 classifications of “<100% FPL,” “100% to less than 200% FPL,” and “200% and greater FPL.” In the 2022 estimates, the categories were expanded to include a “200% to less than 400% FPL” category and a “400% and greater FPL.”
3 SHADAC analysis of Bureau of Labor Statistics data for 2020 and 2021. State Health Compare. Unemployment rate: 2020; 2021 [Data set]. State Health Access Data Assistance Center. http://statehealthcompare.shadac.org/trend/148/unemployment-rate-by-total#0/1/a/19,20,9,10,11,12,13,14,1,2,3,4,5,6,7,8,15,24,25,27,32,37/185
4 Tolbert, J. & Orgera, K. (2020, November 6). Key facts about the uninsured population. Kaiser Family Foundation (KFF). https://www.kff.org/uninsured/issue-brief/key-facts-about-the-uninsured-population/
Office of Health Policy. (2021, March 23). The remaining uninsured: Geographic and demographic variation [No. HP-2021-06]. Office of the Assistant Secretary for Planning and Evaluation (ASPE). https://aspe.hhs.gov/sites/default/files/private/pdf/265286/Uninsured-Population-Issue-Brief.pdf
NHIS Report Citation
Cohen, R.A. & Cha, A.E. (July 2022). Health insurance coverage: Early release or quarterly estimates from the National Health Interview Survey, January 2021–March 2022. National Center for Health Statistics (NCHS). https://www.cdc.gov/nchs/data/nhis/earlyrelease/Quarterly_Estimates_2022_Q11.pdf
Blog & News

Pandemic-Era Trends in Employer-Sponsored Health Insurance (ESI), 2019-2020
July 7, 2022:The COVID-19 pandemic continues to disrupt many patterns of life and work in the United States and internationally, while exacerbating many long-standing concerns regarding health care affordability, access, and utilization as well as rates of health insurance coverage for Americans. In this regard, one area of potential pandemic-related impact to consider is coverage rates for employer-sponsored health insurance (ESI), which remains the largest source of coverage for Americans, with 60.1 million private-sector employees enrolled in ESI in 2020.1
In anticipation of the release of the 2021 Medical Expenditure Panel Survey Insurance Component (MEPS-IC) data, SHADAC researchers analyzed private-sector ESI estimates from the 2020 MEPS-IC to better contextualize the forthcoming 2021 estimates. Understanding 2020 coverage data will supply a pandemic-era baseline, while providing a critical vantage point from which to observe and interpret trends in ESI composition, affordability, and access in this critical market.
This narrative provides an overview of the 2020 MEPS-IC private-sector ESI estimates, covering firm size, ESI cost, and access. It’s important to note that the overlay of COVID-19 on this data makes it difficult to interpret the cause of certain changes when compared to pre-pandemic estimates. One area where this is evident is within the composition of private-sector employees by employer firm size.
Small firms declined significantly in 2020
Many employers offer ESI to their employees, regardless of the number of individuals they employ. However, while ESI remains the most common source of coverage for Americans, the composition of private sector employees enrolled in ESI shifted significantly from 2019 to 2020. Specifically, the number of employees in small firms (defined here as <50 employees) experienced a 19 percent decline over this timeframe, leaving a greater proportion of medium and large firms (defined here as >50 employees) to drive trends in ESI access to coverage and cost.
With larger firms comprising an increasingly significant portion of the private sector, trends among this subset of firms are driving overall changes between 2020 and 2019. For this reason, it is difficult to analyze changes in ESI estimates from 2020 to 2019, as these changes could be attributed to actual trends in access, cost, and affordability, or they could be directly tied to this shift in composition of employers and employees.
Number of private-sector employees in the United States, by firm size: 2019—2020
| Employees, all firms |
Less than 50 employees |
50 or more employees |
|
| 2019 | 131,333,000 | 35,113,000 | 96,220,000 |
| 2020 | 122,677,000 | 28,507,000 | 94,171,000 |
| 2019-2020 Change | -8,656,000 | -6,606,000 | -2,049,000 |
| 2019-2020 Percent Change | -7% | -19% | -2% |
Source: SHADAC analysis of the Medical Expenditure Panel Survey—Insurance Component, 2019, 2020.
ESI costs and premiums remain mostly stable
Monitoring costs associated with ESI is essential for understanding health care-related financial burdens for employees. Nationally, 2020 premiums and cost sharing remained relatively stable for employees enrolled in ESI. While premiums for single coverage increased slightly by 2.5 percent ($177), family premiums, employee contributions, and deductibles (for both single and family coverage) remained steady when compared to 2019.
When examined on a state-level, 2020 ESI costs are more varied. Nationally, the average premium for single coverage was $7,149. Certain states exceeded that average in 2020, with Alaska and New York monthly premiums surpassing $8,000 ($8,635 and $8,177 respectively). Meanwhile, Alabama had the lowest premium for single coverage at $6,393. There was also a great deal of variation across states in the size of deductibles. Nationally, the average deducible for single coverage was just under $2,000 in 2020. However, deductibles ranged from an average of $2,500 in Montana to less than $1,500 in Hawaii.
High-deductible health plans (HDHP) represent one common form of ESI. Nationwide, the percent of employees enrolled in a HDHP increased in 2020, rising from 50.5 to 52.9 percent. Moreover, the majority of private-sector employees were enrolled in a HDHP across 36 states in 2020. North Carolina had the highest percentage of HDHP-enrolled employees at 69.5 percent, and Hawaii was at the other end of the spectrum with only 17.6 percent of employees enrolled in HDHPs.
Access to coverage varies by state
Employee access to ESI has three components:
Employee Offer: An employee must work in an establishment that offers coverage.
Employee Eligibility: An employee must meet the criteria established by the employer to be eligible for coverage that is offered.
Employee Take-Up: The employee must decide to enroll in (“take up”) the offer of ESI coverage.
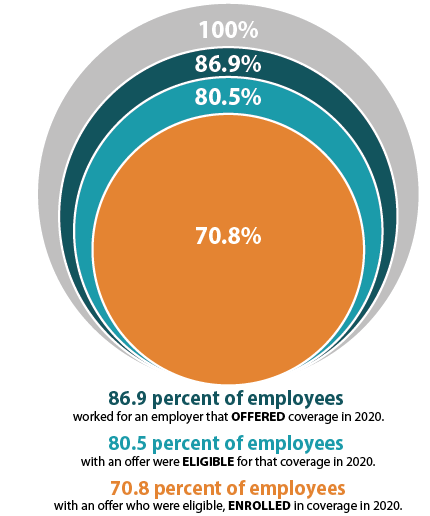
The decision to offer ESI to employees is determined by the employer, with 51.1 percent of private sector firms choosing to offer coverage in 2020 (compared to 47.4 percent in 2019). However, although over half of employers provided optional ESI, not all of their employees were eligible to enroll in that coverage. Meaning, while 86.9 percent of employees worked for an employer offering ESI coverage in 2020, only 80.5 percent were eligible for that coverage; eligibility could be based on a minimum number of hours worked per pay period or a minimum length of service with an employer, for example. Among employees eligible for ESI, overall enrollment declined in 2020, dropping from 71.9 percent to 70.8 percent—a difference of 1.745 million employees.
ESI access also varied across states in 2020. In Hawaii, Tennessee, Massachusetts, Illinois, Pennsylvania, New Jersey, and the District of Columbia (D.C.), more than 90 percent of employees worked at a firm that offered ESI. Meanwhile, less than 75 percent of Montana and Wyoming employees worked for an employer that offered ESI (73.8 percent and 70.6 percent, respectively).
It’s important to note that trends in access are particularly difficult to interpret due to the sharp decline in employees who work in firms with <50 employees, as small firms are much less likely to offer coverage.
To revisit 2019 ESI findings from SHADAC, see the following products:
- Printable version of 2019 ESI Report Narrative
- Companion Blog and Infographic highlighting key findings at the national level regarding ESI coverage affordability and access
- Two-Page Profiles on ESI trends for each state
- 50-State Interactive Map showing levels of, and changes in, average annual premiums for single and family coverage in 2019, with links to state profile pages
- 50-State Comparison Tables including 2015-2019 ESI data
Notes and Sources
Hawaii has a broad employer mandate that preceded the ACA. The Hawaii Prepaid Health Care Act, enacted in 1974, requires private employers to provide health insurance for employees who work at least 20 hours (some exceptions apply).
High-deductible health plans (HDHP) are defined as plans that meet the minimum deductible amount required for Health Savings Account (HSA) eligibility (e.g., $1,400 for an individual and $2,800 for a family in 2020).
The labor market changed significantly between 2019 and 2020 with a dramatic reduction in small firm employment. It is difficult to determine whether 2020 changes in ESI were driven by this change in the labor force or reflect actual changes in ESI access and cost.
Data are from the 2019–2020 Medical Expenditure Panel Survey–Insurance Component (MEPS-IC), produced by the Agency for Healthcare Research and Quality (AHRQ), and are available on SHADAC’s State Health Compare web tool at statehealthcompare.shadac.org.
1 State Health Access Data Assistance Center. (n.d.). Health Insurance Coverage Type (2020)* http://statehealthcompare.shadac.org/bar/279/health-insurance-coverage-type-2020-by-total#0/1/5,4,1,10,86,9,8,6/32/325
Blog & News
Updates to Minnesota's Community and Uninsured Profile Resource to Reflect 2016-2020 ACS Estimates
June 2, 2022: Following the release of the 2020 U.S. Census Bureau’s American Community Survey 5-year data file (2016-2020), SHADAC has made important updates to the Minnesota Community and Uninsured Profile resource to incorporate an analysis of the 2020 data.
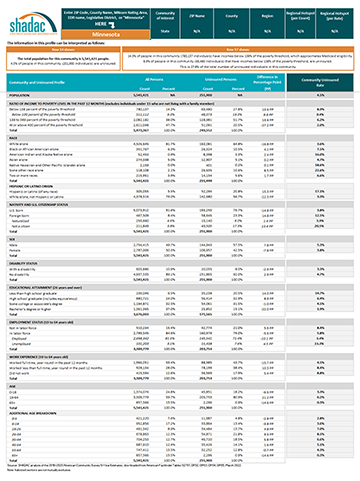 The Community and Uninsured Profile can be used in two ways: (1) to support other equity-focused work, advocacy work, strategic planning, community needs assessments, and grant-writing, and (2) to target health insurance coverage outreach and enrollment efforts.
The Community and Uninsured Profile provides rates and counts of Minnesotans at a range of geographic levels. Users can explore characteristics of the total population and the uninsured population in a specific ZIP code while also overlaying in-depth community characteristics. In addition, users can look at rates and characteristics of the community and uninsured within the state as a whole, by region, county, and state legislative district. Users can also filter by MNsure rating areas -- the geographic regions health insurers use to set premiums on MNsure.
This resource was originally developed as part of “Minnesota’s Uninsured and the Communities in Which They Live,” a project funded by the Blue Cross Blue Shield Foundation of Minnesota that supports targeted outreach and enrollment activities of health insurance navigators and provides information about the uninsured to Minnesota policymakers as they develop strategies to reach the remaining uninsured in Minnesota.
To download the Profile, access additional information, or request the development of a similar tool for another state, visit the Minnesota Community and Uninsured Profile Resource page.
Blog & News

State and Federal Relief Prevented Deep Backslide in Health Care Affordability in California in 2020 (CHCF Cross Post)
May 18, 2022:The following content is cross-posted from California Health Care Foundation. It was first published on May 18, 2022.
Author: Colin Planalp, Research Fellow, SHADAC
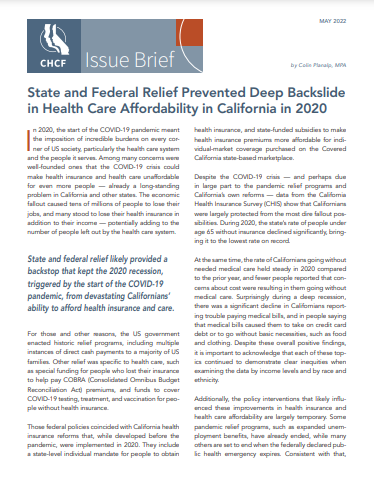 In 2020, the start of the COVID-19 pandemic meant the imposition of incredible burdens on every corner of US society, particularly the health care system and the people it serves. There were well-founded fears that the pandemic, and the concurrent economic crisis, could make health insurance and health care unaffordable for even more people — already a long-standing problem in California.
In response to the pandemic, the US government enacted historic relief programs, including multiple instances of direct cash payments to a majority of US families. Those federal policies coincided with California health insurance reforms that, while developed before the pandemic, were implemented in 2020.
This analysis of the California Health Insurance Survey (CHIS) shows that Californians were largely protected from experiencing a major erosion in their ability to pay for health insurance and care. Despite this overall positive finding, the 2020 CHIS data on health care affordability continued to demonstrate clear inequities by income and race/ethnicity.
Key Findings
California’s uninsured rate declines, yet cost remains top reason for lacking health insurance. The rate of Californians under 65 without health insurance reached a historic low of 7.0% in 2020. However, 51.9% of uninsured people said they lacked coverage because it was too expensive.
Rate of going without needed care due to cost dropped in 2020. Among the 8.6% of Californians who reported forgoing needed medical care in 2020, 32.0% said it was concerns about the cost that caused them to go without care. That rate was significantly lower than the rate of 43.6% in 2019.
Fewer Californians reported difficulty paying medical bills. From 2019 to 2020, the rate of Californians reporting that they’ve had trouble paying medical bills in the past year declined significantly, from 13.3% to 11.1%. However, when breaking out the data by income, only those with higher incomes saw statistically significant improvement. Californians with lower incomes — 200% to 299% of federal poverty guidelines (FPG), 100% to 199% FPG, and below 100% FPG — reported no significant changes.
Less trouble affording necessities due to medical bills in 2020. In 2020, the rate of Californians who reported having trouble paying for basic necessities (such as food or clothing) because of medical bills declined significantly to 31.0% from 39.8% in 2019. Rates of trouble paying for necessities due to medical bills also declined across most income levels.
Practice of using credit card debt to finance medical bills declined. In 2020, the rate of Californians who reported taking on credit card debt to finance medical bills declined significantly, from 56.5% in 2019 to 44.3%. That finding held consistent for Californians across income levels — except for those with the lowest incomes.
Racial and ethnic disparities persisted in 2020. Although California experienced significant improvements in some measures of health care and insurance affordability in 2020, certain long-standing inequities persisted. For example, Black people reported the highest rate of trouble paying medical bills in 2020, at 14.0%, followed closely by Latinos/x, at 12.7%. Asians, Black people, and Latinos/x also reported similarly high rates of trouble paying for necessities due to medical bills (39.4%, 36.2%, and 33.1%, respectively).
Together, these findings provide some encouraging news. In a year of massive economic upheaval that would typically have caused serious financial problems for many Californians, they instead reported improvements in health care and insurance affordability. However, improvements were likely due, at least in part, to federal programs that were mostly designed to be temporary. Some have already expired. Additionally, the historically high inflation of 2021 and 2022 have since strained people’s finances.
But the fact that California experienced such measurable improvements in health insurance and health care affordability during a broad and deep recession shows that those problems don’t have to be intractable. In the future, it will be key to monitor these measures as policymakers in California and at the federal level consider initiatives to protect people against unaffordable health care and insurance costs, which remain a long-term challenge.